#Data Connectivity
Explore tagged Tumblr posts
Visit Tumblr Blog
Explore Tumblr blogs with no restrictions, modern design and the best experience.
Last Seen Tumblr Blogs


Fun Fact
Tumblr was created by web developers David Karp and Marco Arment.
Text
Creating an Effective Power BI Dashboard: A Comprehensive Guide

Introduction to Power BI Power BI is a suite of business analytics tools that allows you to connect to multiple data sources, transform data into actionable insights, and share those insights across your organization. With Power BI, you can create interactive dashboards and reports that provide a 360-degree view of your business.
Step-by-Step Guide to Creating a Power BI Dashboard
1. Data Import and Transformation The first step in creating a Power BI dashboard is importing your data. Power BI supports various data sources, including Excel, SQL Server, Azure, and more.
Steps to Import Data:
Open Power BI Desktop.
Click on Get Data in the Home ribbon.
Select your data source (e.g., Excel, SQL Server, etc.).
Load the data into Power BI.
Once the data is loaded, you may need to transform it to suit your reporting needs. Power BI provides Power Query Editor for data transformation.
Data Transformation:
Open Power Query Editor.
Apply necessary transformations such as filtering rows, adding columns, merging tables, etc.
Close and apply the changes.
2. Designing the Dashboard After preparing your data, the next step is to design your dashboard. Start by adding a new report and selecting the type of visualization you want to use.
Types of Visualizations:
Charts: Bar, Line, Pie, Area, etc.
Tables and Matrices: For detailed data representation.
Maps: Geographic data visualization.
Cards and Gauges: For key metrics and KPIs.
Slicers: For interactive data filtering.
Adding Visualizations:
Drag and drop fields from the Fields pane to the canvas.
Choose the appropriate visualization type from the Visualizations pane.
Customize the visual by adjusting properties such as colors, labels, and titles.
3. Enhancing the Dashboard with Interactivity Interactivity is one of the key features of Power BI dashboards. You can add slicers, drill-throughs, and bookmarks to make your dashboard more interactive and user-friendly.
Using Slicers:
Add a slicer visual to the canvas.
Drag a field to the slicer to allow users to filter data dynamically.
Drill-throughs:
Enable drill-through on visuals to allow users to navigate to detailed reports.
Set up drill-through pages by defining the fields that will trigger the drill-through.
Bookmarks:
Create bookmarks to capture the state of a report page.
Use bookmarks to toggle between different views of the data.

Different Styles of Power BI Dashboards Power BI dashboards can be styled to meet various business needs. Here are a few examples:
1. Executive Dashboard An executive dashboard provides a high-level overview of key business metrics. It typically includes:
KPI visuals for critical metrics.
Line charts for trend analysis.
Bar charts for categorical comparison.
Maps for geographic insights.
Example:
KPI cards for revenue, profit margin, and customer satisfaction.
A line chart showing monthly sales trends.
A bar chart comparing sales by region.
A map highlighting sales distribution across different states.
2. Sales Performance Dashboard A sales performance dashboard focuses on sales data, providing insights into sales trends, product performance, and sales team effectiveness.
Example:
A funnel chart showing the sales pipeline stages.
A bar chart displaying sales by product category.
A scatter plot highlighting the performance of sales representatives.
A table showing detailed sales transactions.
3. Financial Dashboard A financial dashboard offers a comprehensive view of the financial health of an organization. It includes:
Financial KPIs such as revenue, expenses, and profit.
Financial statements like income statement and balance sheet.
Trend charts for revenue and expenses.
Pie charts for expense distribution.
Example:
KPI cards for net income, operating expenses, and gross margin.
A line chart showing monthly revenue and expense trends.
A pie chart illustrating the breakdown of expenses.
A matrix displaying the income statement.
Best Practices for Designing Power BI Dashboards To ensure your Power BI dashboard is effective and user-friendly, follow these best practices:
Keep it Simple:
Avoid cluttering the dashboard with too many visuals.
Focus on the most important metrics and insights.
2. Use Consistent Design:
Maintain a consistent color scheme and font style.
Align visuals properly for a clean layout.
3. Ensure Data Accuracy:
Validate your data to ensure accuracy.
Regularly update the data to reflect the latest information.
4. Enhance Interactivity:
Use slicers and drill-throughs to provide a dynamic user experience.
Add tooltips to provide additional context.
5. Optimize Performance:
Use aggregations and data reduction techniques to improve performance.
Avoid using too many complex calculations.
Conclusion Creating a Power BI dashboard involves importing and transforming data, designing interactive visuals, and applying best practices to ensure clarity and effectiveness. By following the steps outlined in this guide, you can build dashboards that provide valuable insights and support data-driven decision-making in your organization. Power BI’s flexibility and range of visualizations make it an essential tool for any business looking to leverage its data effectively.
#Dynamic Data Visualization#Business Analytics#Interactive Dashboards#Data Insights#Data Transformation#KPI Metrics#Real-time Reporting#Data Connectivity#Trend Analysis#Visual Analytics#Performance Metrics#Data Modeling#Executive Dashboards#Sales Performance#Financial Reporting#Data Interactivity#Data-driven Decisions#Power Query#Custom Visuals#Data Integration
0 notes
Text
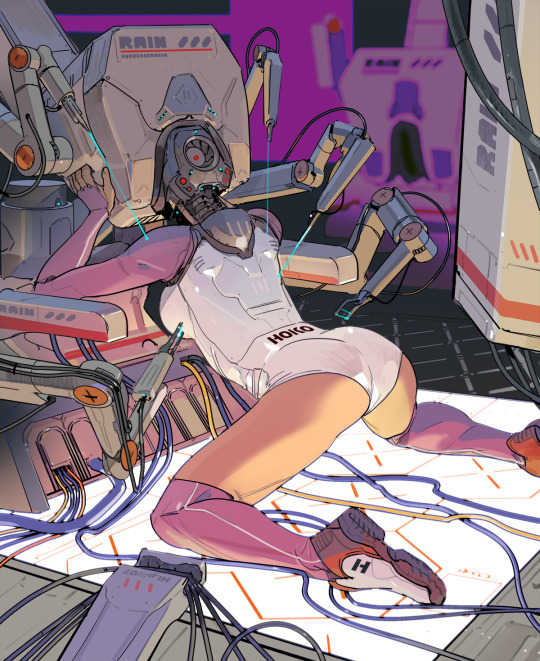
Whispering secret data.
#lab#machine#automation#robotics#cyberpunk#retro#scifi#stuck#laboratory#farm#android#cyborg#data#secret#whisper#illustration#drawing#digitalartwork#digitaldrawing#digitalart#digitalillustration#90s#cables#machinelearning#connection#ring#runner#net#flesh
5K notes
·
View notes
Text
🗣️ This is for all new internet connected cars
A new study has found that your car likely knows more about you than your mom. That is disconcerting, but what’s even more so is what is being done with your information. It’s all about the Benjamins. Our private information is being collected and sold.
The Mozilla Foundation, a non-profit that studies internet and privacy issues, studied 25 car manufacturers. And it found every manufacturer sold in America poses a greater risk to your privacy than any device, app or social media platform.
Our cars are rolling computers, many of which are connected to the internet collecting information about how you drive and where. New cars also have microphones and sensors that give you safety features like automatic braking and drowsy driver detection. Those systems are also providing information. Got GPS or satellite radio? Then your car likely knows your habits, musical and political preferences.
Did you download your car’s app which gives you access to even more features? Well that also gives your car access to your phone and all the information on it.
The study found that of the 25 car brands, 84% say they sell your personal data.
And what they collect is astounding.
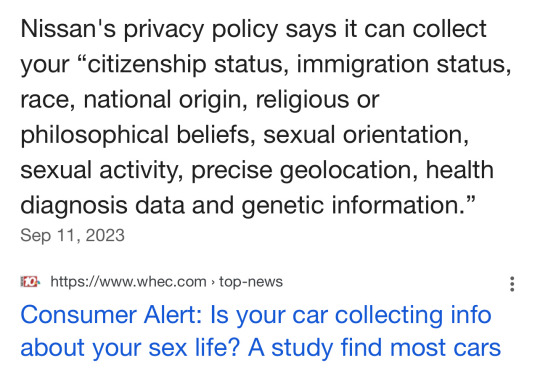
One example the study sites is KIA’s privacy policy. It indicates the company collects information about your sexual activity. I initially didn’t believe it until I pulled KIA’s privacy policy and read it. And it’s right there in black and white. It says it collects information about your “ethnicity, religious, philosophical beliefs, sexual orientation, sex life, or political opinions.
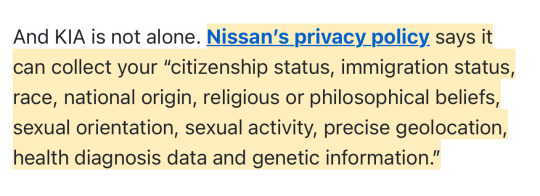
And it says it can keep your info for “as long as is necessary for the legitimate business purpose set out in this privacy notice.”
Translation: Nissan can keep your information as long as they want to. And more than half of the manufacturers (56%) say they will share your information with law enforcement if asked.
(continue reading) more ↵
#politics#data mining#smart cars#spyware#privacy rights#surveillance state#new cars#big brother#nissan#kia#connected cars#consumer alert#panopticon
9K notes
·
View notes
Text
Highlights of Charter Communications' Q1 2023 earnings
Broadband service provider Charter Communications Inc (NASDAQ:CHTR) has reported financial results for the first quarter of 2023. First quarter revenue increased by 3.4% year-over-year to $13.7 billion; residential revenue grew 2.5%, other revenue rose by 34.0%, and commercial revenue moved up 2.4%Total residential and small and medium business Internet customers increased by 76,000, taking the…
View On WordPress
0 notes
Text
soriku kh4 reunion angst thoughts
#ff#clerith#kh4#soriku#last reblog prompted me to bring this here#cloud losing his taisetsu na hito 🤝 riku losing his taisetsu na hito#both continuing to look for them and hopefully both getting them back in future games#both of them connecting in dreamlike states#and Cloud and Sora having sky themed names while Aerith and Riku have earth themed names#hearing Aerith be described as Cloud’s taisetsu no hito made me scream in soriku#also I love how in the Riku episode in remind Aerith is beside him during all the cutscenes#cause I was getting screenshots of Sora and Cloud and Riku and Aerith together to make a post and I noticed they were always close#earth themed second protagonist solidarity + them being friends is neat I think#and regarding Sora and Cloud my fave scene with them is in coded when Cloud and Herc praise data Sora and he blushes and panics ndjsjs#its got nothing to do with this parallel but it’s iconic to me djjsjs#Sora’s type is strong men
101 notes
·
View notes
Text

February 19, 2015: As someone who's directionally challenged, I relate to this deeply. You're not alone, Dan. There are dozens of us! Dozens! 😣🚇🇬🇧
#dan#daniel howell#dan howell#danisnotonfire#y:2015#via:twitter#i'm not kidding i would be so fucked without google maps#i need to go somewhere at least 10-20 times before i feel comfortable navigating without it#i actually use street view to see what the building looks like and where i should park since entrances can be so weird sometimes#it took me 4 trips to feel comfortable navigating the nyc subway system by myself#and that's because i use google maps to tell me which lines to take#ironically i love exploring new places and would feel totally comfortable living somewhere completely different#as long as my phone is charged and has a data connection i'm good#oh btw if you recognize the joke in the caption you get a gold star 🌟
38 notes
·
View notes
Text


indeed my exact process once every 8 months or so
#I just thought today of a new way to format a 'profile' (like the descriptions of self that people use on friend meeting#apps and stuff) and how to organize the sections so that it seems such and such a way and oh what if there's links which click off#into branching paths so it's very acessible and there are two different forms depending on so on and so forth#and i was like 'um.. wow. amazing idea. this will be soooo aweseome and will definitely work' but then .. you know...self reflection#lol.. is this just like the millions of other iterations of a similar thing? No.. This Is Different ... Surely...#Though if I had a millionaire friend and a few people who do the type of coding you use for web design stuff and etc..#I could create the most elaborate detailed and amazing platonic friend seeking (and I guess you could also have 'dating' as an option#since that would draw in more of a crowd) website on the earth.. the new okcupid (back when okcupid didn't suckishly abandon their#whole format in hopes of trying to become just like tinder or whatever and they actually had like tons of info and percentages and#open answer questions and would list personality traits on a profile (like 'this person is more Open To New Expereinces than 65% of#other users' etc.). etc. etc. Oh what a beautiful thing I could craft for the detail freaks of the world.... Alas...#unfortunately we seem to be in an oversimplification era.. everything in short quick bites. everything on a tiny phone screen. etc.#marketing 'Introducing The Most Complicated Data Heavy Social Connection Site In The World' would not sell well I'd imagine gjhgjh#AANYWAY.. also no idea why the representation of me is in a turtle neck. what a bold fashion choice..#In another moment of self reflection.. the fact that in the first tag on this post I felt the need to define the word 'profile' just to be#specific as if people couldn't tell from context.. so clearly someone who finds filling out forms a 'fun afternoon activity' lol#the type of guy who finds psych evaluations and pop quizzes and making chore lists mostly enjoyable (< true)
46 notes
·
View notes
Text
Ok, so there's this entire economy that's built on returned/overstock goods that were on shelves in America eventually ending up in Mexico right?
Random companies like Target or whatever pay X dollars to put some crap on their shelves until it's clear it's just not selling, so instead of eating the loss they sell it at basically 0 profit to some asshole with a truck and the ability to tolerate the god awful amount of paperwork moving goods across that border entail.
Ok and then that some asshole gets to the border and they go through everything they've got and decide what's worth Actually paying the import taxes on and what's basically just land filler. And they take their trash pile and they go to the trash store in whichever border town their in, and say "hey you want this crap?" and the trash store owner says "Nope! but I know some poor schmucks who'll buy it because they can't afford anything better." And they put the trash on the shelves.
These are all the returns, the opened boxes and damaged but Technically probably still functional, things it was just too expensive to try to import into Mexico bc they were worth less then it would cost in fees to get them on shelves there.
Ok, and as a child of one of these towns, you go in to these stores and you buy a basically new Video Game™ for like 2 dollars. And it's crap. Its not shovelware for a show you think you've never heard of or anything but it was still something made to put Product™ on Shelf™ and it'll be lost media in a few years because every single copy ended up in un marked cardboard boxes in towns like yours.
but it's what you had the money for and so it's what you think all games are like until you move somewhere with an actual game store and find out that wait no, theres games that don't crash constantly and have more depth than a dry river. You see the same crap games that were all over your town but no one buys them because they have better options. which is how they end up on the trash store shelves eventually.
And then a decade or some odd later you have to deal with people who've always had access to the good stuff and the word of mouth knowledge or TV commercials or magazines to tell them What was good before they bought it claiming the crap they bought and returned or never gave time in the first place just didn't exist and that shovelware is an artifact of modern game dev instead of something that was always there since the beginning.

#the fact you can download patches is fucking Bonkers. What do you Mean the game can fix itself instead of just being#trash forever?? Its a fucking miracle.#idk im just bitching about how entitled some folk sound when they have to be patient about their toys instead of buying on launch day#it used to be So much worse!! its not even making Vast amounts of plastic waste anymore!!#because you can just. Go to wherever has an open wifi connection in your town and have your game magically fix itself if you dont have#a connection at home/ dont have the data to do it through a mobile hotspot
43 notes
·
View notes
Text


Bruh soriku got the floral arch, the dearly beloved wedding march, and the paopu fruit 💀
#they got the rings too if the halves of the keyblade count#an official jewelry maker seemed to think so#kingdom hearts#soriku#thinking about that door in recoded forever. like whatbthefuck#none of the other doors look like this just the one data riku makes for data sora#to leave his heart/system/whatever#the stained glass is obviously connected to heart stations#and the purple is similar to riku’s heart station#but data riku is not just riku. he has sora’s memories. which explains the red and pink#probably#but like why does this door look like this. what was the reason nomura#how much more marriage symbolism can you give them#also it’s funny of him to debate whether or not to have sora and kairi share paopu#bc he didn’t want to portray their feelings as too intense#after he gave sora and riku’s combined hearts a paopu fruit#like. okay
340 notes
·
View notes
Text


there's no knowing am i standing still or running or kneeling
#''or maybe you look like me. you handsome devil.''#UUUGHHHH GOD. HELP. HELP. I NEED THIS SCENE LIKE I NEED AIR. HELP.#i'm warning you do not try to load this post on mobile data because you will have none left#alan wake#alan wake 2#alan wake 2 spoilers#remedy games#remedy connected universe#YOU KNEW I AM A PSYCHOOO I TOLD YOU I'M A PSYCHO PSYCHO PSYCHO-#photoset#zane
273 notes
·
View notes
Text
the more i think about devon this season, the more i'm seeing parallels between her and mark.
with ricken's new partnership with lumon, devon is seeing this person she loves (loved?) betray all the principles he claimed to hold. he's not the person she thought he was. (like a body snatcher has taken his place.)
and we all want her to get the hell out of there, but she appears to be financially dependent on him, and, having given birth like a month ago. there's this other person in the equation now that she's responsible for. (in another show, mark quitting his severed job would have been the resolution of his arc, the proof that he's ready to face his grief. except, pre-reintegration, that choice isn't so simple. there's another person in the equation now, that he made, that he's responsible for.)
we've also seen how, despite devon's cynical edge and mark's asshole tendencies (often directed at her specifically), she's never given up on her brother. based on that, i think, for all she's frustrated with ricken right now, she probably still wants to believe in the version of him she fell in love with, to hold out in case he returns (to see if she can bring him back).
devon told mark to stay at lumon this season because the person he fell in love with was maybe still there, and if she is, they need to save her.
that past version of ricken (whether he was ever real or just an illusion), and eleanor. those are her gemma. what's keeping devon trapped.


#when a scout sibling finds Their Person they will cling to them. even when it's a sinking ship.#i do genuinely hope devon leaves ricken this season. or at least they go on a break. pls girl you deserve so much better#severance#severance season 2#mark scout#devon scout-hale#posts from the severed floor#data analysis#there's probably a further connection to draw with devon being trapped in her marriage and lumon's fertility cult aspects#leaving that to someone else to elaborate on
38 notes
·
View notes
Note
Sorry to bug you, but do you have a general estimation of when the next chapter comes out? I'm very excited for it; your work is really good and i'm pretty invested in the story! If I could give more kudos, I would. Of course, I can remain patient if it's gonna be a while. No rush, just curious!
I have about 2k words for chapter 36 so far, progress is just slow because I'm also working on a teaser video for arc 2 and I gotta edit arc 1 for continuity (which I haven't actually started yet). I don't think it'll be too much longer for the next chapter though, but I do have a lot more I need to do with it. It'll be a long chapter.
Current project release timeline:
Chapter 36
Edit Arc 1
Chapter 37 + Arc 2 teaser video (if the video finishes before Chapter 37, I might just release it sooner)

Thanks for your interest in my work. I'm actually glad anyone's asking for updates on it.
#of ponies and puppies#tried to post a full frame from it but my data connection is so bad Tumblr is throwing a fit
39 notes
·
View notes
Text
truly my best brain time is in the middle of the night caffeine & sugar rush. I think I just understood math, like some part of the general pattern of math if that makes sense. something clicked somewhere in my brain and I felt it
#idk this might sound like a sleep deprived caffeine up god complexed person's rambles bc that's 100% what it is#(it's vector & matrices I'm at currently bc got some algorithms to figure out and explain how those would apply to deal with EEG-data#in practice and I think I got like the basic thing that idk how to put into words; like the connections etc.)#I think it helped to have that EEG-data there to think things through with bc some context is always nice#I suck at just purely theoretical math#anyways feeling great & maybe I'm not the dumbest person on this earth after all#april 2024#2024
74 notes
·
View notes
Text
... were we supposed to know that the icons on the chapter titles were supposed to be the heralds (also also wit) because I didn't realize that till the end of wind and truth
#I mean I figured out the jester one but uh.#I was like oh those are neat details#and then I was looking at the coppermind. and saw that they apparently are the heralds and now my data collection ideas are beginning#hey brain we don't have time to make a list of which icons show up on different chapters and if the supposed ideals that herald represents#has a connection to the chapter in some way#... although I could just check a few chapters in particular... hmmmm. okay fine I might look at this for fun another time#also the chapters falling in wind and truth????? very neat detail#i've got like what 5 years before the next book I can take some time and data collect slowly#oh god 5 years#oops long tags uhhh#stormlight archive#the stormlight archive#wind and truth#I guess#wind and truth spoilers#although those spoilers are more in the tags than the post?
21 notes
·
View notes
Text
So, I've been doing some thinking. This could either be a meaningless little ramble that no one will care about, or something seen as really dangerous and putting a target on my back.
So, what if we, those most weary of the far right created an international group of activists in light of the US election? See, the thing is that Donald Trump and Elon Musk are very dangerous, but they are also very incompetent and could lead the government down a path that weakens it. It could create a very unique opportunity to address the far right problem and the US Imperialist system itself in one go. Or maybe I'm being overly ambitious.
This group I have in mind would have several purposes, such as keeping communities safe and protecting people from the harm the far right would do in the name of winning the election. Or, most importantly of all, connecting activists from all over the world and allowing us to dismantle the system as a concrete and united movement. Maybe it's just me being naive and hopeful, but maybe it's also something we've all wanted deep down but been too afraid to initialise? If so, maybe this is a sign to really stand up and start trying to make those connections.
#um message if interested I guess?#us elections#us politics#civil rights#revolution#activism#anarchism#socialism#communism#leftist politics#leftism#donald trump#2024 presidential election#usa politics#As an Australian I know there'll always be a barrier to how much I can do as long as america holds the reins#they've swapped out our prime ministers before and been controlling our system for decades#we're barely our own country rn and as long as the us system stays in place as it is we'll never be able to change our own system#So tbh I think the most I could do for myself my friends and everyone in this world is to be involved in this#to unravel the us imperialist system and allow for the change in other places to be able to happen#the western empire needs to be separated and divided if it is to fall and give way to radical land back and revolution#if we want strong anti discrimination safety and equality we need to dismantle the colonialist system starting with the most powerful#also hint hint nudge nudge; try out the app “signal” it's really good for being able to communicate and organise freely#the devs don't give away data and you have so much privacy to be able to organise actions and help people#Please please look into it y'all and start organising and connecting to one another
23 notes
·
View notes
Text
I do genuinely hate how trusting simple shit on the internet is starting to become a russian roulette game. Even if AI wasn't based on maybe one of the biggest heists of human history, it would still be a massive L to the culture that we are expected to become paranoid about any interaction we have with other human beings, our appreciation for art, our trust of the images we see, etc. This is just making everything so much worse, and there is no justification for it that holds any water.
#thoughts#fuck generative content#I unfortunately do predict the internet will become borderline unusable in less than 10 years if that's not managed real fast#like that will murder social media or the concept of internet as something social#why would you want to wander a ghost town full of information you can't trust and people who aren't real#all of those trying to suck even more of your soul to create more ghouls hellbent on harassing you and take money/data from you#and prevent you from getting actual human connection#like at some point you are going to self-cannibalize#and it's going to be a stupid ass tragedy and none of the people responsible will ever be held accountable#it's hard to be enthusiastic about the world and life and the future in goddamn 2024!!#when literally everything good and interesting about humanity and the natural world is being systematically destroyed!!#anyway.
20 notes
·
View notes