#geographic
Explore tagged Tumblr posts
Text

#gulf of mexico#gulf of america#gulf#mexico#united states#american#us politics#american politics#political#politics#USpol#renaming#map#maps#meme#memes#funny memes#map meme#geography#geographical#geographic
101 notes
·
View notes
Text

68 notes
·
View notes
Text

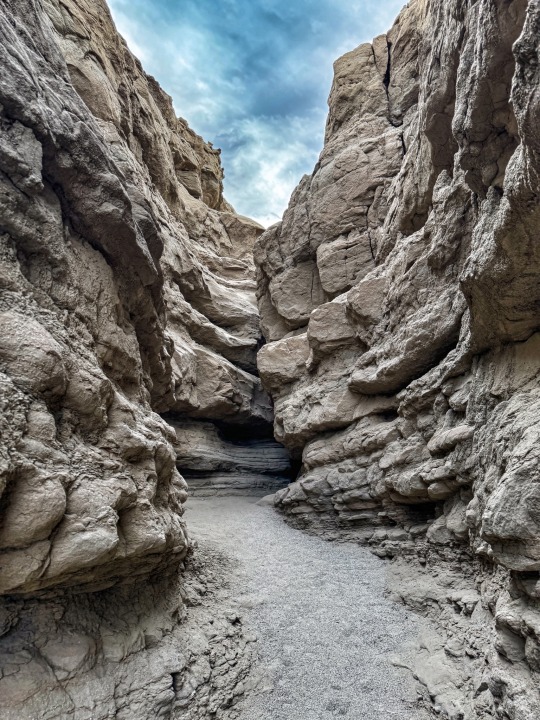
#geology#rocks#hike#nature hikes#labyrinth#geographic#nature pictures#mobile photography#iphoneography#national park#crazy#photooftheday
29 notes
·
View notes
Text

The Pastels, 1986. photo by Lawrence Watson
21 notes
·
View notes
Text

3 notes
·
View notes
Text
#polls#tumblr polls#poll#only polls#tunblr#tumble polls#tumblr poll#direction#location#north#east#south#west#geographic
34 notes
·
View notes
Text
4/26/24.
Happy Bandcamp Friday. Here's a post about an album not currently on Bandcamp. Yes, the music is The Pastels excellent debut compilation "Up For A Bit With The Pastels", but really this is about a new collaboration between Stephen Pastel (and at times members of The Pastels) and Gavin Thompson.
"This Is Memorial Device" is the musical companion to the theater production based on the cult novel by David Keenan. Memorial Device is the fictional band in the book, and Stephen Pastel and Gavin Thompson bring the book to life with their music. Geographic (sub-label of Domino Recording Co. curated by Stephen Pastel) is releasing the album. There are two tracks currently available: "Introduction To Why I Did It" and "We Have Sex". The latter is built upon teenage recordings Stephen made with his friend Corky.
According to the Domino release page, this sounds like The Pastels in some spots and nothing like The Pastels in others. This endeavor recalls the BMX Bandits' soundtrack to the film Dreaded Light.
#The Pastels#Stephen Pastel#Gavin Thompson#David Keenan#Domino Recording Co.#Geographic#BMX Bandits#Bandcamp
2 notes
·
View notes
Photo

Zoio, Portugal - 2023.07.26
#douradinhasilvestre#smallskipperthymelicussylvestrisemliberdadewildlifenunoxavierlopesmoreira#all#animais#animals#ao#ar#geographic#liberdade#livre#moreira#national#nature#natureza#nuno#ngc#photographer#pics#portugal#nunoxaviermoreira#selvagem#us#wild#wildlife#xavier#xpress#wildnature
3 notes
·
View notes
Text


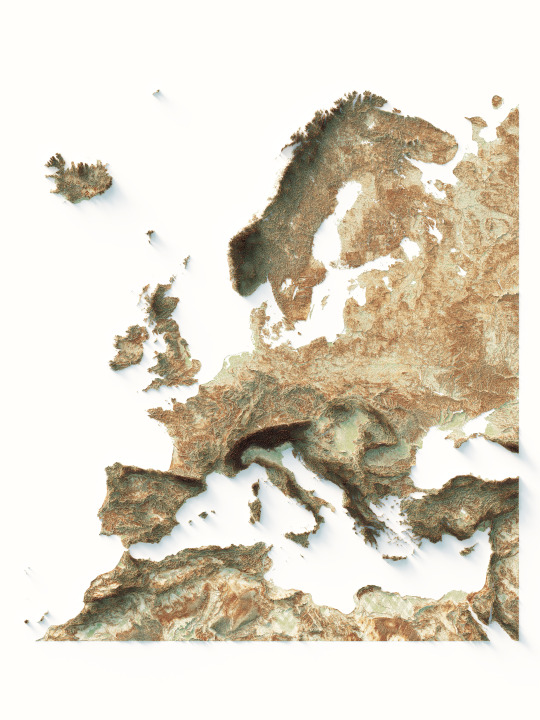
Shaded relief map of Europe. We use geo palette with hypsometric coloration.
If you like our work, want to see our daily updates (or want to say hello to our studio), consider to follow our Instagram or Twitter account. Otherwise if are interested in our prints or have a custom request check our shop.
#elevationmap#elevationtint#europe#maps#mapstagram#topographicmaps#mapsarecool#europemap#green#traveler#cartography#europa#geography#geoart#european#datavizsociety#europe trip#geographic#geografia
2 notes
·
View notes
Text
youtube
Comparing Different Countries Population, Population Density and Size - Find out more here ->
#countries#countryrankings#countrysize#country#rankings#geography#population#populationdensity#illuminatingfacts#interestingfacts#geographic#geographical#nations#comparisons#Youtube
5 notes
·
View notes
Text
21K notes
·
View notes
Text

51K notes
·
View notes
Text
10K notes
·
View notes
Text
The changing geography of “energy poverty”
New Post has been published on https://thedigitalinsider.com/the-changing-geography-of-energy-poverty/
The changing geography of “energy poverty”


A growing portion of Americans who are struggling to pay for their household energy live in the South and Southwest, reflecting a climate-driven shift away from heating needs and toward air conditioning use, an MIT study finds.
The newly published research also reveals that a major U.S. federal program that provides energy subsidies to households, by assigning block grants to states, does not yet fully match these recent trends.
The work evaluates the “energy burden” on households, which reflects the percentage of income needed to pay for energy necessities, from 2015 to 2020. Households with an energy burden greater than 6 percent of income are considered to be in “energy poverty.” With climate change, rising temperatures are expected to add financial stress in the South, where air conditioning is increasingly needed. Meanwhile, milder winters are expected to reduce heating costs in some colder regions.
“From 2015 to 2020, there is an increase in burden generally, and you do also see this southern shift,” says Christopher Knittel, an MIT energy economist and co-author of a new paper detailing the study’s results. About federal aid, he adds, “When you compare the distribution of the energy burden to where the money is going, it’s not aligned too well.”
The paper, “U.S. federal resource allocations are inconsistent with concentrations of energy poverty,” is published today in Science Advances.
The authors are Carlos Batlle, a professor at Comillas University in Spain and a senior lecturer with the MIT Energy Initiative; Peter Heller SM ’24, a recent graduate of the MIT Technology and Policy Program; Knittel, the George P. Shultz Professor at the MIT Sloan School of Management and associate dean for climate and sustainability at MIT; and Tim Schittekatte, a senior lecturer at MIT Sloan.
A scorching decade
The study, which grew out of graduate research that Heller conducted at MIT, deploys a machine-learning estimation technique that the scholars applied to U.S. energy use data.
Specifically, the researchers took a sample of about 20,000 households from the U.S. Energy Information Administration’s Residential Energy Consumption Survey, which includes a wide variety of demographic characteristics about residents, along with building-type and geographic information. Then, using the U.S. Census Bureau’s American Community Survey data for 2015 and 2020, the research team estimated the average household energy burden for every census tract in the lower 48 states — 73,057 in 2015, and 84,414 in 2020.
That allowed the researchers to chart the changes in energy burden in recent years, including the shift toward a greater energy burden in southern states. In 2015, Maine, Mississippi, Arkansas, Vermont, and Alabama were the five states (ranked in descending order) with the highest energy burden across census bureau tracts. In 2020, that had shifted somewhat, with Maine and Vermont dropping on the list and southern states increasingly having a larger energy burden. That year, the top five states in descending order were Mississippi, Arkansas, Alabama, West Virginia, and Maine.
The data also reflect a urban-rural shift. In 2015, 23 percent of the census tracts where the average household is living in energy poverty were urban. That figure shrank to 14 percent by 2020.
All told, the data are consistent with the picture of a warming world, in which milder winters in the North, Northwest, and Mountain West require less heating fuel, while more extreme summer temperatures in the South require more air conditioning.
“Who’s going to be harmed most from climate change?” asks Knittel. “In the U.S., not surprisingly, it’s going to be the southern part of the U.S. And our study is confirming that, but also suggesting it’s the southern part of the U.S that’s least able to respond. If you’re already burdened, the burden’s growing.”
An evolution for LIHEAP?
In addition to identifying the shift in energy needs during the last decade, the study also illuminates a longer-term change in U.S. household energy needs, dating back to the 1980s. The researchers compared the present-day geography of U.S. energy burden to the help currently provided by the federal Low Income Home Energy Assistance Program (LIHEAP), which dates to 1981.
Federal aid for energy needs actually predates LIHEAP, but the current program was introduced in 1981, then updated in 1984 to include cooling needs such as air conditioning. When the formula was updated in 1984, two “hold harmless” clauses were also adopted, guaranteeing states a minimum amount of funding.
Still, LIHEAP’s parameters also predate the rise of temperatures over the last 40 years, and the current study shows that, compared to the current landscape of energy poverty, LIHEAP distributes relatively less of its funding to southern and southwestern states.
“The way Congress uses formulas set in the 1980s keeps funding distributions nearly the same as it was in the 1980s,” Heller observes. “Our paper illustrates the shift in need that has occurred over the decades since then.”
Currently, it would take a fourfold increase in LIHEAP to ensure that no U.S. household experiences energy poverty. But the researchers tested out a new funding design, which would help the worst-off households first, nationally, ensuring that no household would have an energy burden of greater than 20.3 percent.
“We think that’s probably the most equitable way to allocate the money, and by doing that, you now have a different amount of money that should go to each state, so that no one state is worse off than the others,” Knittel says.
And while the new distribution concept would require a certain amount of subsidy reallocation among states, it would be with the goal of helping all households avoid a certain level of energy poverty, across the country, at a time of changing climate, warming weather, and shifting energy needs in the U.S.
“We can optimize where we spend the money, and that optimization approach is an important thing to think about,” Knittel says.
#000#1980s#ADD#Administration#air#American#approach#author#Building#change#chart#climate#climate change#Community#cooling#data#dates#dating#Design#Economics#energy#energy consumption#Evolution#federal#financial#fuel#Funding#geographic#Geography#Government
0 notes
Text
Maximizing Your Business Potential with Local SEO
Local SEO is a crucial strategy for businesses aiming to attract customers within a specific geographic area. Unlike general SEO, which targets a broad audience, local SEO focuses on optimizing your online presence to appear in search results for users searching in your local vicinity. By leveraging local keywords, creating and optimizing a Google My Business profile, and garnering positive local reviews, businesses can significantly enhance their visibility to nearby potential customers.
Effective local SEO involves several key practices. Firstly, ensure your business's name, address, and phone number (NAP) are consistent across all online directories. Incorporate localized keywords into your website content, meta descriptions, and titles to improve search engine rankings. Additionally, engaging with local community events and building backlinks from reputable local sites can further boost your local search presence.
The benefits of local SEO extend beyond just visibility. It drives highly targeted traffic to your business, which can lead to increased foot traffic, phone inquiries, and online conversions. By prioritizing local SEO, businesses can effectively compete in their local markets, attract more relevant customers, and ultimately drive growth and success.
0 notes
Text

"Fluid as water, brilliant as silver, heavier than lead, mercury spills through a mine worker's fingers."
National Geographic
October 1972
ph. Robert W. Madden
68K notes
·
View notes