#antarctic peninsula map
Explore tagged Tumblr posts
Visit Tumblr Blog
Explore Tumblr blogs with no restrictions, modern design and the best experience.
Last Seen Tumblr Blogs


Fun Fact
There are dozens of funny blogs to kill time on Tumblr.
Text
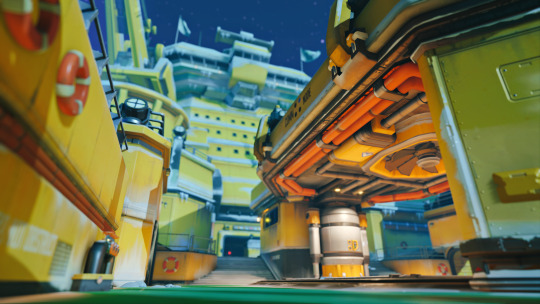
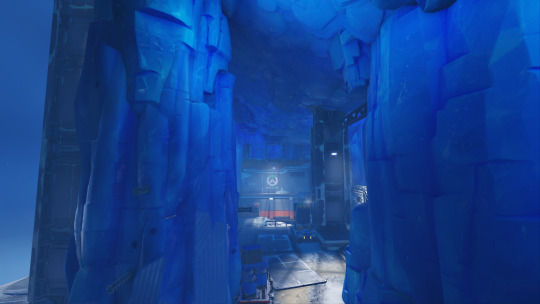
Antarctic Peninsula | Overwatch
#overwatch#overwatch map#antarctic peninsula#video game#video game scenery#buildings#antarctica#my screencaps#my edits#game screencaps#game screenshots
2 notes
·
View notes
Text
Climate of ASOIAF and its interaction with geography
It is notable that despite the multiyear seasons that per Martin aren't due to physical phenomena, Planetos has an otherwise very Earth-like atmospheric circulation pattern - colder towards the poles, warmer to the equator, with a girdle of storms around the poles that move eastward, and tropical storms that hit Westeros from the southeast during autumn.
Hereby I'll hypothesize that a) the Lands of Always Winter have a size between Greenland and Antarctica, probably closer to the latter, b) the Narrow Sea has a warm northward ocean current, b) the Doom of Valyria didn't cause a volcanic winter, but changes in geography might have, c) the Planetosi equator runs from the Summer Isles westward through the Sunset Sea, the Saffron Straits and Jade Sea all the way to Sothoryos, w/o an "Americos" or Ulthos in the way and d) a continent between Essos and Westeros is almost certainly much smaller than Westeros if it exists at all.
:readmore:
For the record, I am assuming a continental configuration similar to, but with differences explained below, Werthead's in the Atlas of Ice and Fire blog, notwithstanding that as a Mercator projection it makes the Lands of Always Winter too large - and as I argue below, too small and with Ulthos incorrectly intersecting the equator:
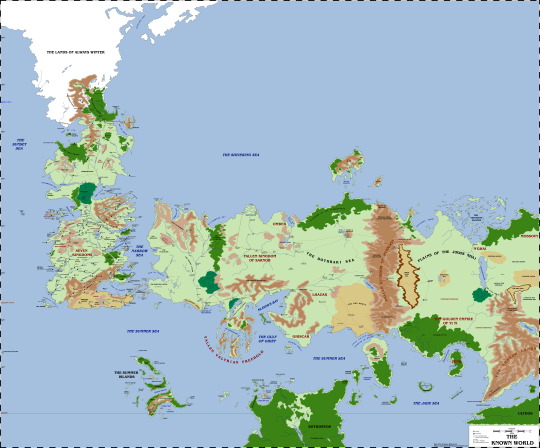
The first thing to note is that per GRRM the Lands of Always Winter are probably larger than Greenland. In fact, given that the northernmost ice-free areas mentioned seem to correspond to the 70th meridian, it's possible that it has an area comparable to Antarctica. So that map might undersell their extent. The fact that the soggy Neck and the stormy Bite are located at around 50 degrees north might support this evaluation, since in the real world the Antarctic storm belt is centered at about that latitude. If we assume that Bran III AGOT was describing the Frozen Shore when he speaks of a "frozen shore", this might imply that permanent ice extends to 60 degrees north. The Thenn and Milkwater valleys might be equivalent to the McMurdo Dry Valleys, then. Granted, a somewhat smaller extent is also possible, depending on how far south sea ice extends in Westeros. Martin has also said that Essos does not extend to the far North; that is, the Shivering Sea surrounds the Lands of Always Winter like the Southern Ocean surrounds Antarctica, except that the North interrupts the ocean at Westeros.
Now there is a thing in Antarctica that doesn't seem to exist in Planetos: The Amundsen Sea Low. This is a semipermanent storm system that forms where storms running around Antarctica pile up against the Antarctic peninsula, and is one of the reasons why sailing conditions at Cape Horn are so treacherous. Given that the North is almost certainly a more effective block than the Drake Passage/Antarctic Peninsula, one might expect the "Sunset Sea Low" to be even more potent.
On the contrary, it seems like weather conditions west of the North are much calmer, with only sparse references to storms. That means that the "Sunset Sea Low" is weaker than the Amundsen storm system. This tells us a few things about Planetos:
There is probably no large continent west of Westeros. A smaller and/or mountainous continent in the middle of the storm track would weaken storms passing through. A large one conversely would spill cold air during winter and deflect warm sea currents (think the Gulf Stream), strengthening downstream storms. So we can assume that any "Americos" is no larger than Australia.
Warm oceans are distributed in a certain way. In the real world, the Amundsen Sea Low strengthens when water temperatures in the Atlantic are warm, and weakens when they are warm in the Indian and East Pacific. With the caveat that this assumes an Earth-like high altitude wind pattern in Planetos, this might tell us that water temperatures southwest of Westeros and in the Jade Sea are warmer than elsewhere along the equator - and warmer than the seas east of the Saffron Straits.
However, Corlys Velaryon's claim to have seen Elissa Farman's ship in Asshai - Elissa Farman travelled west of Westeros - suggests that there is an open oceanic connection from the Summer Isles westward to the Saffron Straits and thence into the Jade Sea. In fact, I think it's likely that the Saffron Straits extend along the equator and let warm water from the Sunset Sea drain into the Jade Sea. This would also explain the clockwise winds in the northern Jade Sea mentioned by sailors, since the trade winds from the Sunset Sea would be funnelled along the equator through the Jade Sea and turn clockwise like the monsoon into Yi Ti. Some of the warm water would spill through the Cinnamon Straits and Jade Gates into the eastern Summer Sea, forming a second "warm water pool".
Now onto the Narrow Sea. Given that westerly winds blow along the Shivering Sea, they would tend to push water eastward, lowering water levels around Braavos and driving a northward ocean current in the Narrow Sea. The warm water cooling and evaporating as it heads north would cause it to sink, forming a thermohaline circulation akin to that of the Atlantic Ocean. This would make the Narrow Sea much warmer than the Sunset Sea, and would amplify hurricane activity around the Stepstones.
In this context, it's interesting to discuss the effects the Doom of Valyria had on climate. Given that Valyria is never described as an archipelago pre-Doom and that the Doom caused an intense tsunami to its east, it's reasonable to assume that the entire archipelago is a volcanic caldera. One much larger than any volcano of Earth, probably more akin to the largest volcanoes of Mars. Its formation probably wouldn't lead to a "volcanic winter", however; volcanic winters don't scale up with the size of eruption and the involvement of all that water would weaken the cooling effect. It's reasonable to discuss the effects that the formation of the Smoking Sea and the other straits had on Planetos' climate, though: The boiling water and additional pathways for Jade Sea water to reach west would cause the Narrow and eastern Summer Sea to become warmer. This would increase precipitation over Westeros, Essos and Sothoryos (possibly explaining the rise of the Hoare-era Ironborn conquerors, Dothraki and decline of Gogossos) and storminess in the Stormlands (possibly explaining their decline during Arrec's rule).
13 notes
·
View notes
Text
Ok taking a break from TADC and going back to Overwatch lore, here's something I've wanted to talk about for a while.
Antarctic Peninsula Labs map, yeah?

This is the symbol on the blue side, aka the cryonics side.
It's also Mei's ultimate symbol.
Now look at this:

This is the symbol on the green side. Which is hydroponics lab.
I can't find this symbol anywhere else- though, it looks like something of Null Sector, which considering my favorite theory that Null Sector was involved in the deaths of the E:A team, is a DARKKK hint. Also, here's everyone's specialty in E:A:
Mei: Climatology
Oparah: Cryonics
Torres: Cryonics
Arrhenius: Climatology
MacReady: Engineering
Adams: Researcher
Notice that NONE of them specialize in hydroponics. However, that may go hand in hand with, say Climatology, but still. They might all work on it, but they don't specialize in it.
I keep wondering if it could be a hint at a hero in the future, based solely on the fact the other symbol is Mei's ult. It just absolutely baffles me- and I hope to GOD Blizzard isn't just being lazy but, knowing them they probably aren't and there's some significance behind this.
And before I go, Another thing I noticed:

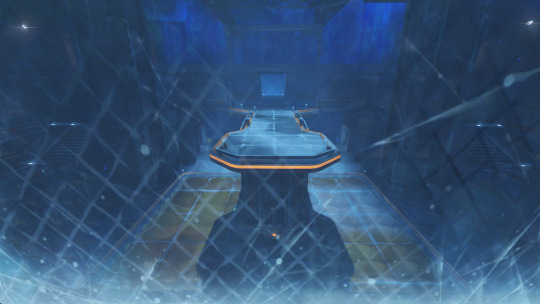
This is a symbol on the blue team spawn, aka the cryonics research lab.
I can't find either of these symbols or any discussion about them anywhere. Anyone have some ideas abt them? (i wrote this when sleepy so I may have more to add onto it later)
#overwatch#overwatch 2#overwatch lore#mei ling zhou#overwatch mei#mei overwatch#lore analysis#overwatch antarctica#antarctic peninsula
19 notes
·
View notes
Text
Antarctic Iceberg Spins Out
When icebergs break from an ice shelf or large glacier front, they ride the ocean’s currents, spin in its eddies, shift with the tides, and are blown by the wind. Occasionally the icy drifters become stuck, grounded on a shallow part of the seafloor or trapped in a rotating mass of ocean water. Iceberg A-23A did both.
After breaking from the Filchner-Ronne Ice Shelf in 1986, Iceberg A-23A spent decades stuck to the floor of the southern Weddell Sea. It began to wiggle loose in the early 2020s, and by March 2023 the Rhode Island-sized iceberg floated unencumbered. But such freedom lasted only a year. As it drifted northward in March 2024, the berg became ensnared by a rotating vortex of water, or Taylor column, caused by currents encountering a bump on the seafloor.
While every iceberg’s journey is unique, most follow the same general path. More than 90 percent of bergs around Antarctica enter the clockwise-flowing current of the Weddell Gyre off East Antarctica and eventually escape, shooting north along the Antarctic Peninsula and finally out across the Drake Passage into warmer South Atlantic waters—an ocean route known as “iceberg alley.”

But it’s not always a straight path to the Atlantic, even for giant bergs carrying a huge amount of momentum. For example, Iceberg A-68A, a similar mammoth-sized berg that broke from the Larsen C Ice Shelf in 2017, made some loops in the Drake Passage before continuing north and disintegrating in the Northern Scotia Sea near South Georgia island.
The motion of A-23A, however, appears quite out of the norm. For about eight months, the berg rotated tightly within the Taylor column about 200 kilometers (120 miles) north of the South Orkney Islands. According to Jan Lieser, an ice specialist with the Antarctic Meteorological Service who has been tracking the berg, A-23A made 15 revolutions between March and November 2024. “I am not aware of an iceberg that has been trapped in such a persistent manner in such a small area,” Lieser said.
The animation at the top of this page shows the iceberg between November 5 and December 16, 2024. Notice that by about mid-November, the berg appears to “spin out,” escaping the vortex and resuming its northeastward journey. Images for the animation were acquired by the MODIS (Moderate Resolution Imaging Spectroradiometer) and VIIRS (Visible Infrared Imaging Radiometer Suite) instruments on several NASA and NOAA satellites.
Christopher Shuman, a University of Maryland, Baltimore County, scientist based at NASA’s Goddard Space Flight Center, estimated that the berg drifted about 240 kilometers in one month since exiting the vortex. In other words, it traveled about 8 kilometers per day as it continued to rotate on its way to the northeast.
It is still unclear what might have nudged the berg from the vortex. “My hypothesis is that a random perturbation in the system might have triggered a slight variation of the ‘usual’ spin, such that the iceberg found an exit path,” Lieser said.
“This serves to remind us both of the mysteries of our oceans and the value of remote sensing data,” Shuman said. Cryospheric scientists will continue using satellites to observe changes to the ice in this remote part of the planet—including but not limited to icebergs.
NASA Earth Observatory images by Lauren Dauphin, using MODIS data from NASA EOSDIS LANCE and GIBS/Worldview, VIIRS data from NASA EOSDIS LANCE, GIBS/Worldview, and the Suomi National Polar-orbiting Partnership, and the Joint Polar Satellite System (JPSS). Map made using data from the Antarctic Iceberg Tracking Database and the U.S. National Ice Center(USNIC). Story by Kathryn Hansen.
2 notes
·
View notes
Note
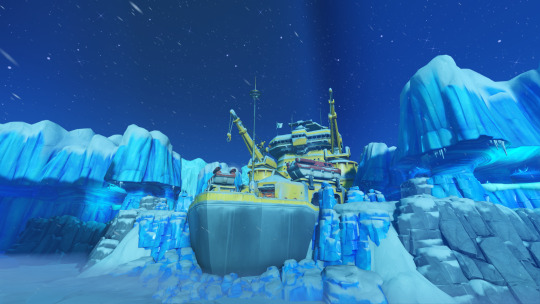
I think it's also worth pointing out with the Antarctic Ecopoint is that in the new-ish map Antarctic Peninsula, one of the three points the that map is a stranded ship. iirc according to some official source, that boat was an attempted attempt to rescue the Ecopoint team, but failed due to those same weather conditions.
Yeah that's probably what it is, as they do mention there were attempts to save the team. The storm in the book is classified as a megastorm, which considering the state of the OW Universes climate, would probably be worse then what we classify as a megastorm.
I honestly really like that they clarified that rescue attempts were made, because for awhile there was a bit of an implication that the Antarctica team was just left there. Mostly due to the lack of information, the writer actually telling us "no there were rescue attempts" is very reliving to me.
10 notes
·
View notes
Photo


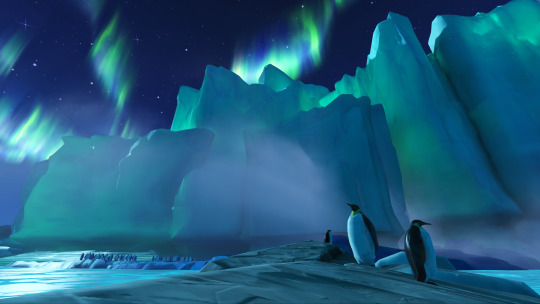
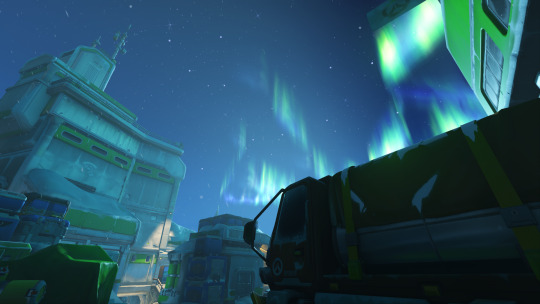
#mei-ling zhou#antarctic peninsula map#aurora australis#overwatch 2#owedit#ow2edit#ow mei#overwatchedit#overwatch season 3#overwatch#gamingedit#videogameedit#womeningaming
76 notes
·
View notes
Photo
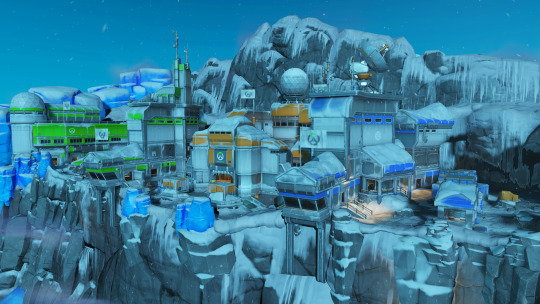
Overwatch 2 Maps: Antarctic Peninsula
5 notes
·
View notes
Text
I'm not kidding when I say worldbuilding is extremely easy and fun, you can make easily all sorts of new fantasy worlds on like half an hour, follow this guide:
take a rectangle, draw a line through the middle, that's your equator, draw another two lines south and north, those are your tropics, draw another two lines further north (you can see a real world map to guide yourself), those are your arctic/antarctic circles
Draw continents, any shape you want, it's better to combine large soft blobs (like Africa or South America) with coastlines full of peninsulas and islands (like Europe or South Asia). Draw some island chains in between where you feel it's appropiate. Some inland seas like the Mediterranean are good too.
Decide where you will place mountain ranges. In real life, they are where oceanic-continental plates (Andes) or continental-continental plates (Himalayas, Alps), collide. These are very important.
Place rivers, just the most important ones. The places where you place big river systems are gonna be big plains.
Now, the fun part. With your first step, you've already decided where arctic, temperate, and tropical climates are there. You can mark it as letters in your map. Mountain ranges, of course, are colder.
Here's the tricky part: vegetation: vegetation mostly follows precipitation, and precipitation is mostly decided by altitude and distance from the ocean. The interior of your continents should be dry with plains and deserts; the coasts should be rainy with forests and plains. But remember, if you have a mountain range, that's a rain shadow! Picture the wind coming from the ocean with rain, and it should get less rainy when it "clashes" with a mountain range, with the other side a desert.
Deserts are tricky to place, but as a quick cheat, you can place them in your tropic lines. They can even border oceans: see Australia and the Kalahari.
WHEN IN DOUBT, LOOK AT SIMILAR AREAS ON A REAL WORLD VEGETATION/CLIMATE MAP. THIS IS WHY DRAWING THE EQUATOR AND THE TROPICS IS SO IMPORTANT AND SHOULD BE YOUR FIRST STEP ALWAYS.
Now you already have a quick and dirty vegetation map, you're halfway there! Don't worry if there are some doubtful areas, real world geography can be weird.
Now for the REAL fun stuff (if you aren't having fun already, I sure am): making civilizations!
You have to decide center of origins for your domesticated crops and animals. Basically, every early civilization had its own "package" of staple crops and animals that are still used today.
With this, you can decide:
the primary civilizations of your world
roughly how different animals and vegetation are distributed, if you want an Earth-like world (for an quicker method, you can apply the biogeographical realms to your own continents as you wish)
A quick cheat sheet of centers of origin, what they have, and where you can place them:
(this is just a quick thing, do read the article it's so much better)
Middle Eastern: wheat, barley, cows, sheep, goats. Place them in a dry area with lots of rivers (the Fertile Crescent!)
East Asia: rice, soybean, oranges, pigs, horses. Place it in a rainy temperate area bordering the tropics.
Mesoamerica: Corn, beans, pumpkin, chilli, tomato. Place it in a dry area near the tropics.
Andes: Potato, quinoa, llamas. Place it in a mountain range.
Tropical South America: manioc, peanuts, pineapple. In the tropics.
Tropical Asia: Rice, banana, sugar cane, beans. In the tropics, again.
or, just straight up use this fucking map, it's so much better:
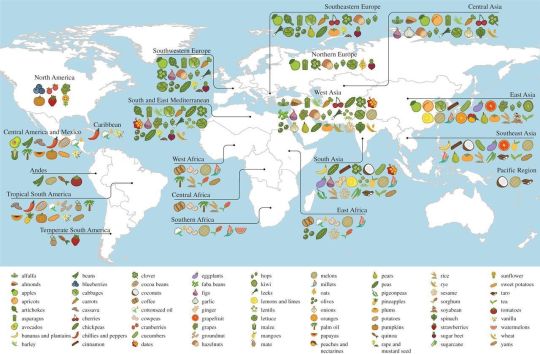
You can mix and match the crops, animals, and such as you wish, and you should definitively read the wiki page on center of origins and see some other less known crops.
If you have non-human civilizations, of course they'll have different packages. Carnivore or subterranean civilizations might be very different. But at this point, your imagination should be flying already and I don't have to hold your hand here.
Now, you have a rough map of your world at the dawn of agriculture! Congratulations! Depending on the historical period you're setting your world, you can start to draw countries and civilizations. This is where it gets complicated again. I might have to make a part two... But just with this, you already have a new world to use as you wish.
I'll make a worked example later to show you how easy it is if you don't believe me.
2K notes
·
View notes
Note
when lifeweaver pulls mei he’ll say “my favourite climatologist” and now i think the pairing is cute. iceweaver? meiflower?
Iceweaver or Meiran could be cute...He also has the voiceline, "Such a tragedy what happened here... poor Doctor Zhou..." on the Antarctic Peninsula map
Also I like the combo of cute and disheveled Mei with "Definitely spent over an hour on his eyebrows" Niran.
#I'm still biased toward BapWeaver though#I just really like Baptiste finally getting some attention and I like their contrast
14 notes
·
View notes
Text

A bald eagle arrives to steal a perch on a tree log that offers a strategic view of the shoreline at the Chilkat Bald Eagle Preserve in Alaska. When other eagles drag freshly caught salmon in from the water, these bystanders swoop in to take a share. "Hours of observing their patterns and behavior helped me capture moments like these,” says photographer Karthik Subramaniam, a software engineer with a passion for wildlife photography. Photograph By Karthik Subramaniam

In May 2021, the Fagradalsfjall volcano erupted in the Reykjanes Peninsula in Iceland for the first time in over six thousand years. The lava flow continued for six months, spreading hard black rock across the landscape. It was, says Riten Dharia, who captured this image, "an exhibition of the raw and awesome power of nature." Photograph By Riten Dharia
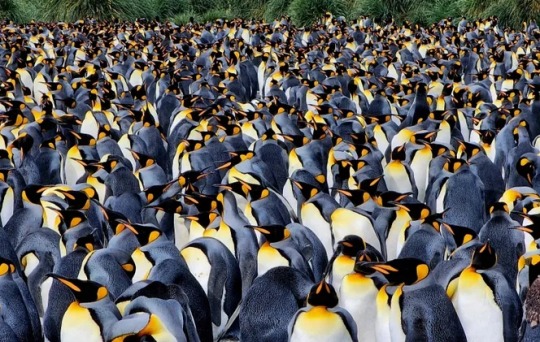
King penguins crowd together in the viewfinder of Rhez Solano on the beaches of Gold Harbour in South Georgia. The island sits in the remote southern Atlantic Ocean, not far from Antarctica, and hosts some 25,000 breeding pairs of king penguins, along with gentoo penguins, and elephant seals. Photograph By Rhez Solano
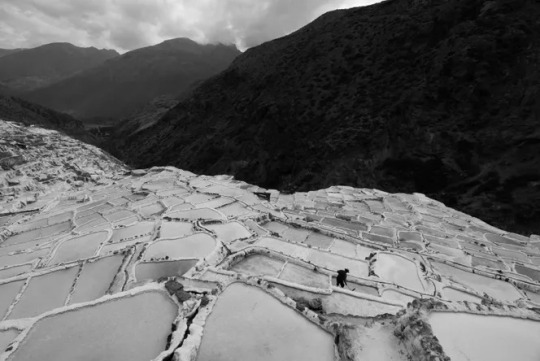
There are around 4,500 salt wells terraced into the hillside at the Salt Mines of Maras in Peru. The archaeological record shows that salt extraction likely began here before the Inca Empire, perhaps as far back as 500 AD. Today that tradition continues with the families who own wells, each of which produces some 400 pounds of salt per month. “The salt wells receive water through channels sourced by a salty underground spring nearby and once the water evaporates, the crystallized salt remains,” says An Li, who captured this picture. “Here, a salt miner is using a wooden rake to extract the salt." Photograph By An Li

Asiilbek, a nomadic Kazakh eagle hunter, preps his golden eagle, Burged, for a horseback hunt in the grasslands outside of Bayan-Ölgii, the westernmost province of Mongolia. The eagle’s training begins when fledglings are captured from their cliff edge nests and taught how to hunt for hare, fox, and even deer. The tradition stretches back 3,000 years. “For this image, I was lying on my stomach in the prone position looking through the electronic viewfinder at the edge of the stream,” says photographer Eric Esterle. “The ground shook as Asiilbek's horse passed less than a few feet away, splashing me with ice cold water. I remember covering my camera with my body and putting my head down.” Photograph By Eric Esterle
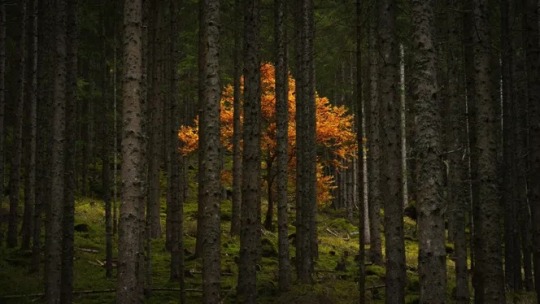
On a road trip through the Austrian Alps, Alex Berger spotted a one-lane road that wound into the mountains and looped back on the map. He followed it alongside a small stream lined with walls of forest when he spotted this golden tree blooming from between the trunks. There’s “a fantasy-ish inspired dimension for me,” says Berger, “which gives me goosebumps.” Photograph By Alex Berger
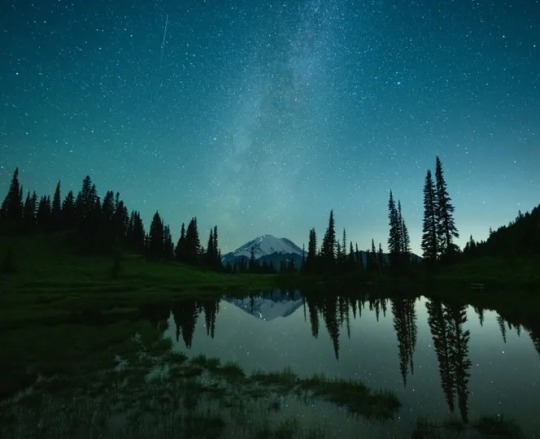
Sometimes a sleepless night is key to great photography. At approximately 3:40 a.m. on a frigid summer morning, photographer W. Kent Williamson snapped this image from Tipsoo Lake in Mount Rainier National Park, Washington. From across the still water, he could see a line of headlights as weary climbers approached the peak’s 14,411-foot summit—the culmination of a multi-day climb. "The night sky was unusually clear, and the Milky Way could be seen just above the mountain,” Williamson says. “I was surprised to see how bright the climbers’ lanterns were.” Photograph By W. Kent Williamson
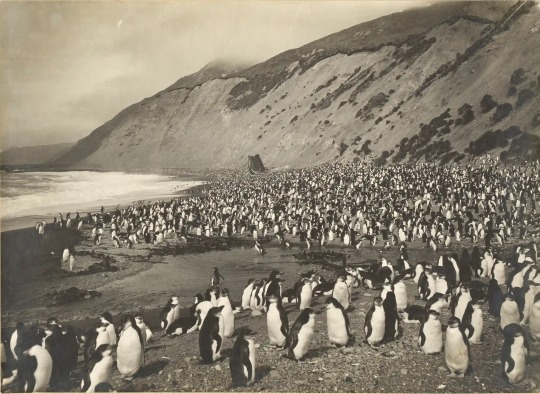
From Frozen Memories: Rare Antarctic Expedition images! A royal penguin rookery at Nuggets Beach on Macquarie Island. Photographer and adventurer Frank Hurley went on multiple voyages but his best-known images were taken when the Endurance was crushed in the ice during explorer Ernest Shackleton’s 1914 expedition. Photograph: Frank Hurley
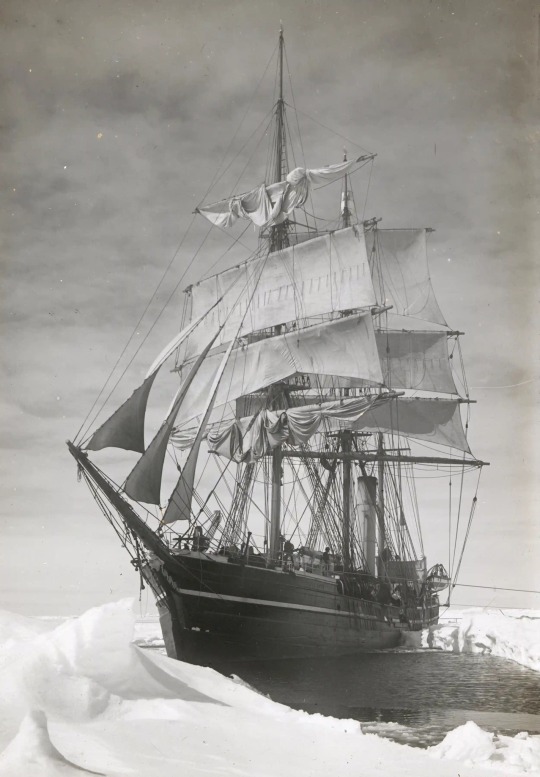
From Frozen Memories: Rare Antarctic Expedition images! The Terra Nova held up in pack ice during Robert Falcon Scott’s expedition to the Ross Sea and South Pole. Photograph: Herbert George Ponting
6 notes
·
View notes
Text

Satellites Reveal a Greener Antarctic Peninsula
The white, monochromatic vistas of Antarctica, a continent practically synonymous with ice, are becoming more verdant—at least around some of its edges. According to an analysis of 35 years of observations from Landsat satellites, the amount of vegetated land on the Antarctic Peninsula has increased more than tenfold since 1986.
As glaciers shrink and temperatures warm, plant life is finding more opportunity to move into this and other cold-climate regions. The expansion of greenery on the Antarctic Peninsula may signal a shift in its ecology, researchers say, raising questions about its future.
Using observations from Landsat 5 through Landsat 8, scientists determined that the area of vegetated land on the Antarctic Peninsula grew from 0.86 to 11.95 square kilometers (0.33 to 4.61 square miles) between 1986 and 2021. Notably, the expansion of green space accelerated starting in 2016. The research, published in Nature Geoscience in October 2024, was led by environmental scientist Tom Roland of the University of Exeter and remote sensing expert Olly Bartlett of the University of Hertfordshire.
Their results are encapsulated in the maps above. The panels show the amount of green on the peninsula’s ice-free land below 300 meters (1,000 feet) elevation at select years in the study period. The shade of each hexagon corresponds to the amount of land area where levels of plant greenness and density, as determined by the satellite-based Normalized Difference Vegetation Index (NDVI), were high enough to indicate the “almost certain” presence of vegetation. The NDVI values were derived from cloud-free Landsat observations from March of each year, which typically encompasses the end of the growing season. The maps show significant expansion in vegetation cover across the South Shetland Islands (at the top-left of each panel) and down the western side of the peninsula to nearly the southern limit for plant growth.
Past field studies on the Antarctic Peninsula have shown that mosses dominate its green areas, forming expansive “carpets,” like on Ardley Island in the photo below, and vertically accumulating “banks.” Both build up layers of new growth each year. In earlier work, Roland and colleagues carbon-dated core samples taken from moss banks along the western side of the peninsula. They discovered that the rates at which moss was accumulating had increased in the past 50 years, indicating an uptick in biological activity amid climatic changes.

These results got scientists wondering if vegetation was not only expanding its territory upward but also outward. So Roland, Bartlett, and their team tapped into the decades-long Landsat record. “Based on the core samples, we expected to see some greening,” Roland said, “but I don’t think we were expecting it on the scale that we reported here.”
The pace of greening was surprising, as well. “When we first ran the numbers, we were in disbelief,” Bartlett said. But the results, based on two different measures of greenness, kept coming out the same. “The rate itself is quite striking, especially in the last few years.”
The Antarctic Peninsula, jutting out into the Southern Ocean from West Antarctica, is one of the fastest warming places on Earth. Most of its glaciers are receding. The uptick in new vegetation in recent years also coincides with a decrease in Antarctic sea-ice extent, an increase in open water, and a strong positive phase in the Southern Annular Mode, which could be producing warmer, wetter conditions, the authors noted.
As plant life finds more favorable conditions for growth on the Antarctic Peninsula, questions about biodiversity in its unique habitats arise. “The narrative in these places has been dominated by glacial retreat,” Roland said. “We’re starting to think about what comes next, after ice recession.” Of particular concern is that where there’s moss, soil formation tends to follow, creating more opportunity for nonnative plants to find a foothold. When that happens, said Bartlett, “you’re looking at potentially an erosion of biodiversity.”
Antarctica hosts hundreds of native species of mosses, liverworts, lichens, and fungi, but only two native species of flowering plants. Human presence on the continent for tourism and research can result in the introduction of nonnative species (although seeds and spores can also arrive on the wind). Several cases of invasions have already been documented in the northern Antarctic Peninsula and nearby islands. “Biosecurity will become increasingly critical as temperature limitations on cold, high-latitude ecosystems decrease,” wrote the researchers.
Now, the scientists are keen to return to the field to understand the changes in finer detail. “We’re at the point that we’ve said the best we can say with the Landsat archives,” Roland said. Many questions remain as to what types of plant communities comprise these new green areas and what shifts in the structure and function of the Antarctic Peninsula’s ecosystems may already be underway. “We need to go to these places where we’re seeing the most distinctive changes and see what’s happening on the ground.”
NASA Earth Observatory maps by Michala Garrison, based on data from Roland, T.P., et al. (2024). Photo courtesy of Dan Charman (University of Exeter). Story by Lindsey Doermann.
2 notes
·
View notes
Text
21 Years of Amazing Earth Imagery
On April 29, 1999, NASA Earth Observatory started delivering science stories and imagery to the public through the Internet. Today, we turn 21! So much has changed in the past two decades...
youtube
One of the most notable changes is the way we view our home planet. Check out some of the beautiful imagery of our planet over the past 21 years.
2000: Pine Island Glacier
Most people will never see Pine Island Glacier in person. Located near the base of the Antarctic Peninsula—the “thumb” of the continent—the glacier lies more than 2,600 kilometers (1,600 miles) from the tip of South America. That’s shorter than a cross-country flight from New York to Los Angeles, but there are no runways on the glacier and no infrastructure. Only a handful of scientists have ever set foot on its ice.
This animation shows a wide view of Pine Island Glacier and the long-term retreat of its ice front. Images were acquired by the Moderate Resolution Imaging Spectroradiometer (MODIS) on our Terra satellite from 2000 to 2019. Notice that there are times when the front appears to stay in the same place or even advance, though the overall trend is toward retreat. Read more.
2002: The Blue Marble
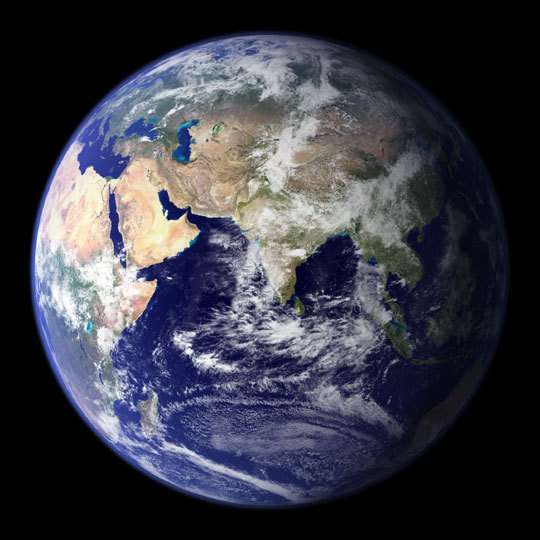
In February 2002, Earth Observatory published this “blue marble” image based on the most detailed collection of true-color imagery of the entire Earth at that time. Using a collection of satellite-based observations, scientists and visualizers stitched together months of observations of the land surface, oceans, sea ice and clouds into a seamless, true-color mosaic of every square kilometer (.386 square mile) of our planet. Most of the information contained in this image came from Moderate Resolution Imaging Spectrometer (MODIS), illustrating the instrument's outstanding capacity to act as an integrated tool for observing a variety of terrestrial, oceanic and atmospheric features of the Earth. Read more.
2009: Tsauchab River Bed
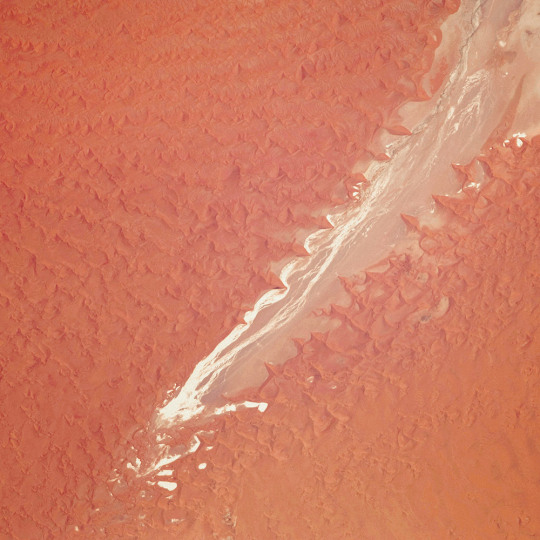
The Tsauchab River is a famous landmark for the people of Namibia and tourists. Yet few people have ever seen the river flowing with water. In December 2009, an astronaut on the International Space Station caught this glimpse of the Tsauchab River bed jutting into the sea of red dunes. It ends in a series of light-colored, silty mud holes on the dry lake floor.
Like several other rivers around the Namib Desert, the Tsauchab brings sediment down from the hinterland toward the coastal lowland. This sediment is then blown from the river beds, and over tens of millions of years it has accumulated as the red dunes of the Namib Sand Sea. Read more.
2012: Manning Island and Foxe Basin, Canada
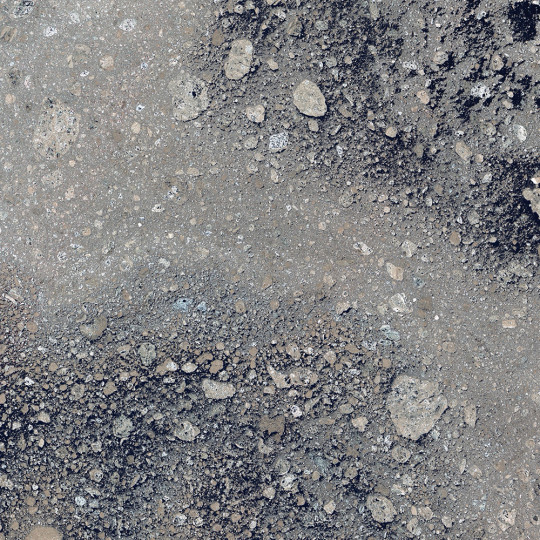
Although it may look like a microscope’s view of a thin slice of mineral-speckled rock, this image was actually acquired in space by the Earth Observing-1 satellite in July 2012. It shows a small set of islands and a rich mixture of ice in Foxe Basin, the shallow northern reaches of Hudson Bay.
The small and diverse sizes of the ice floes indicate that they were melting. The darkest colors in the image are open water. Snow-free ice appears gray, while snow-covered ice appears white. The small, dark features on many of the floes are likely melt ponds. Read more.
2013: A Lava Lamp Look at the Atlantic
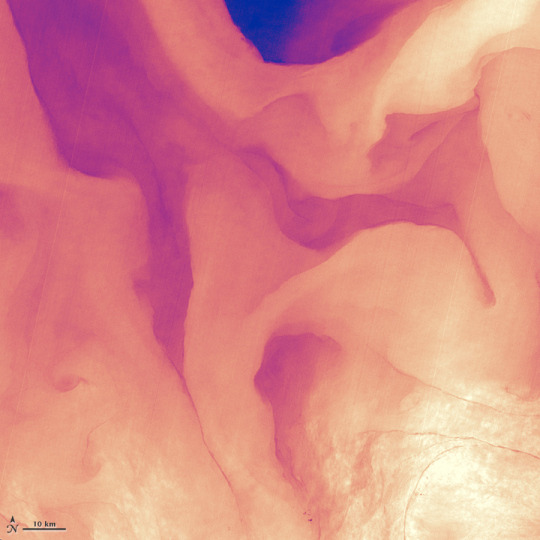
Stretching from tropical Florida to the doorstep of Europe, this river of water carries a lot of heat, salt, and history. The Gulf Stream is an important part of the global ocean conveyor belt that moves water and heat across the North Atlantic from the equator toward the poles. It is one of the strongest currents on Earth, and one of the most studied.
This image shows a small portion of the Gulf Stream as it appears in infrared imagery. Data for this image was acquired on April 9, 2013, by the Thermal Infrared Sensor (TIRS) on the Landsat 8 satellite. TIRS observes in wavelengths of 10.9 micrometers and 12.0 micrometers. The image above is centered at 33.06° North latitude, 73.86° West longitude, about 500 kilometers (300 miles) east of Charleston, South Carolina. Read more.
2016: Curious Ensemble of Wonderful Features
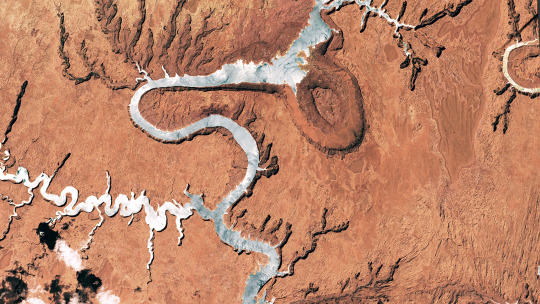
When John Wesley Powell explored the Colorado River in 1869, he made the first thorough survey of one of the last blank spots on the map. The expedition began in May at Green River, Wyoming, and ended three months later at the confluence of the Colorado and Virgin Rivers in present-day Nevada.
About two months into their journey, the nine men of the expedition found themselves in Glen Canyon. As the men traveled along the serpentine river channel, they encountered what Powell later described in Canyons of Colorado as a “curious ensemble of wonderful features.”
From above, the view of Glen Canyon is equally arresting. In 2016, an astronaut aboard the International Space Station took several photographs that were combined to make a long mosaic. The water has an unnatural shade of blue because of sunglint, an optical phenomenon that occurs when sunlight reflects off the surface of water at the same angle that a camera views it. Click here to see the long mosaic.
2019: Lena Delta Shakes Off Water
For most of the year, the Lena River Delta—a vast wetland fanning out from northeast Siberia into the Arctic Ocean—is either frozen over and barren or thawed out and lush. Only briefly will you see it like this.
After seven months encased in snow and ice, the delta emerges for the short Arctic summer. The transition happens fast. The animation above, composed of images from the Moderate Resolution Imaging Spectroradiometer (MODIS) on our Aqua satellite, shows the transformation from June 3-10, 2019. Read more.
2020: Making Waves in the Andaman Sea
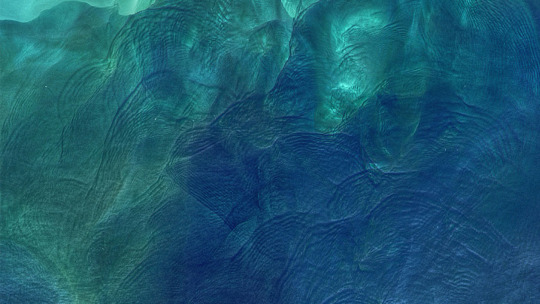
When tides, currents and gravity move water masses over seafloor features, they can create wave actions within the ocean. Oceanographers began studying these internal waves from ships in the 1960s, and the modern era of satellites has made it possible to see them on a grand scale. The Operational Land Imager (OLI) on Landsat 8 captured these images of the Andaman Sea on November 29, 2019. The reflection of the Sun on the ocean—sunglint—helps make the internal waves visible.
Internal waves form because the ocean is layered. Deep water tends to be colder, denser and saltier, while shallower water is often warmer, lighter and fresher. The differences in density and salinity cause layers of the ocean to behave like different fluids. When tides, currents, gravity and Earth’s rotation move these different water masses over seafloor formations (such as ridges or canyons), they create waves within the sea. Read more.
These images were taken from NASA Earth Observatory!
Interested in receiving Earth Observatory's Images of the Day? Subscribe to our newsletters or RSS feeds.
Make sure to follow us on Tumblr for your regular dose of space: http://nasa.tumblr.com.
#NASA#earth#earth science#mother earth#oceans#sea#seafloor#river#landscape#earth observatory#tides#Canada#blue marble#satellite images#celebration#tsauchab river#atlantic
1K notes
·
View notes
Text
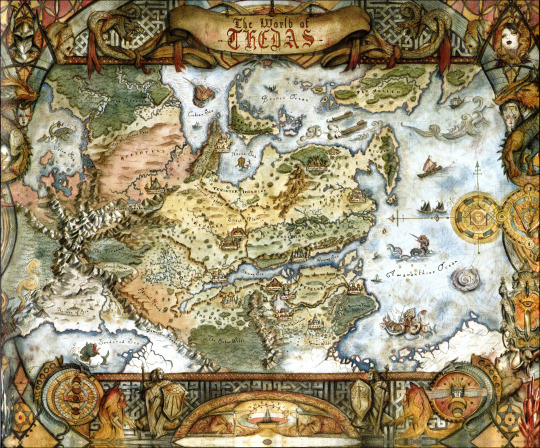
Was anybody going to tell me Thedas has two moons or was I supposed to find that out while trying to research trade routes myself?
Anyway, I have thoughts about that and spent far, far too much of my night on this.
Laying it out:
We know the second moon is named Satina, but since we don’t know the name of the other, I’m going to call them the primary moon (big boy) and second moon (little guy) when I do refer to them directly. They would have different orbital periods (which should affect the calendar more, but whatever) and both have an equatorial orbit (like our moon does!). These are presumptions, but they’re also how things usually work. Especially considering that Thedas is habitable. That’s important to maintain.
Also, whenever I look at maps of Thedas in detail, I’m reminded that this has to be a teeny tiny planet. That’s not really relevant to this post, but it’s weird to think about.
The main thing covered here will be the effect of this on the tides, but first:
Flavor:
There are two moons in the sky! That’s neat and cool to look at! They would both reflect the sun’s light, so that would make nights brighter. This would have evolutionary effects, potentially, but that’s enough of a technicality in the fast and loose world of Thedas that I’ll pass it by right now. There would be more eclipses, which is also neat. Unfortunately, we never see both of them at once in the games, but here’s a mod to have two moons overhead in the Hissing Wastes.
Tidal effect:
This part is really long. Under the cut!
The primary moon, which we see in the sky in the Hissing Wastes, is either very large or very close in comparison to Earth’s moon (proportionally). Since Earth’s moon is improbably large, it’s more likely that it’s very close, which actually has a more significant effect on its tidal pull than size would (proximity > size; we see this IRL with how minimal the Sun’s affect is on Earth’s tides). The second moon is presumably smaller and further away, but its proximity still has a significant effect on tides.
Most of the time they would balance each other out to a relatively normal cycle, but high tides would be higher on average. Not catastrophically, but higher – and dramatically so when the moons enter orbital resonance (same place in orbit at the same time) and both of their gravitational pulls have affect at the same time!
Initially I thought that that would greatly impact coastal settlements and trade hubs, and it would, but not many that we’re super familiar with. Tides are greater with greater bodies of water, and a lot of the trade centers we see are around the Waking and Shining Seas (Kirkwall, Highever, etc.). They’re just little guys. Western Thedas is mostly landlocked as well, and all of Thedas is sub-equatorial; tidal pull with an equatorial moon decreases the further you are from the equator, since you’re further from the moon(s).
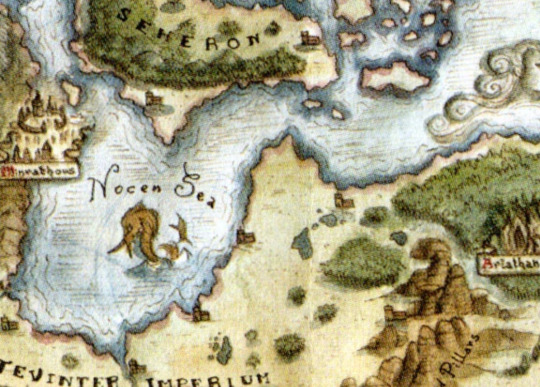
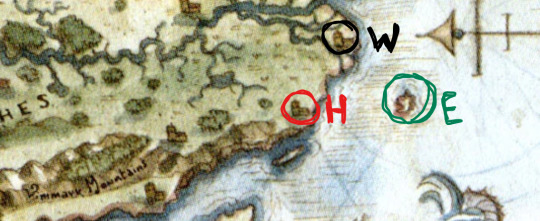
Let's look at some maps! Mostly using the map from Tevinter Nights for reference here:
Cities that aren't named are marked by little symbols that look like houses. I'll give crops of each location for a visual as we go, because everything is small.
Other major coastal regions:
- Tevinter is predominantly coastal at this point in history, but the Nocen Sea isn’t enormous; Seheron is quite close on the other side; and the coast around the Arlathan forest isn’t populated.
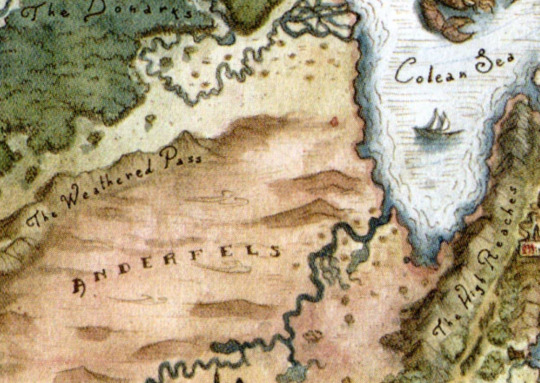
- The eastern Ander coast is paralleled across the Colean Sea by a Tevinter peninsula, if they actually make use of that coast.
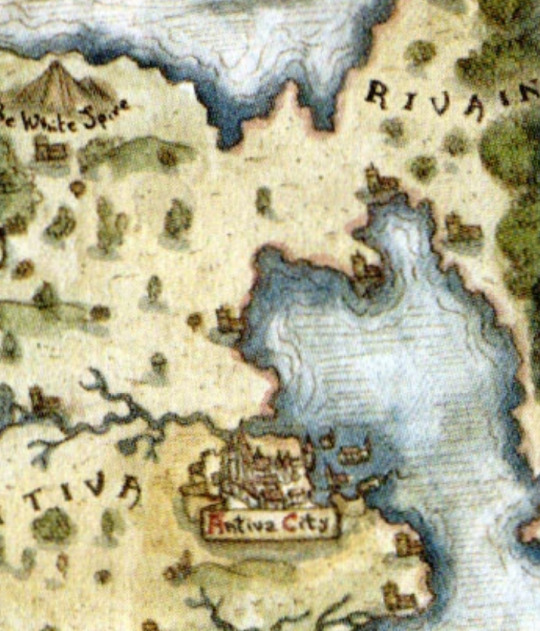
- Antiva isn’t notably populated north of the White Spire (the Antivan mountain, not the Orlesian Circle Tower, which has given me some grief); its coastal population is on the Rialto Bay.
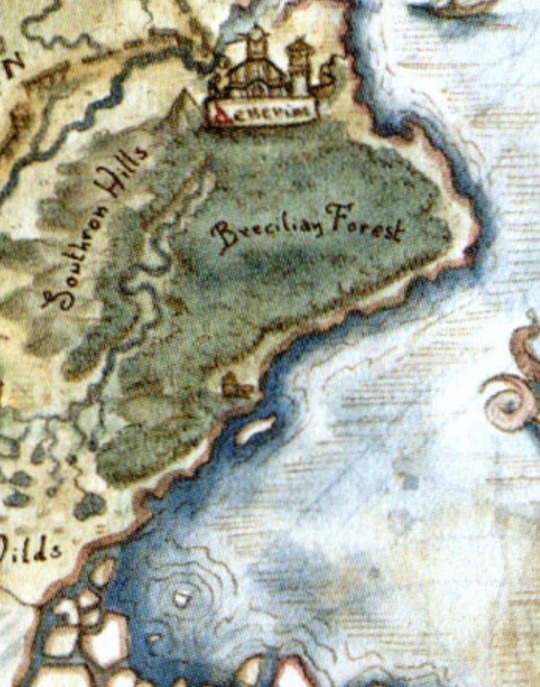
- Eastern Ferelden has a significant amount of coastline, but the Brecilian Forest blocks most of it off, and Gwaren (city south of the Forest) is far south enough that it’s probably bordering the planet’s Antarctic circle.
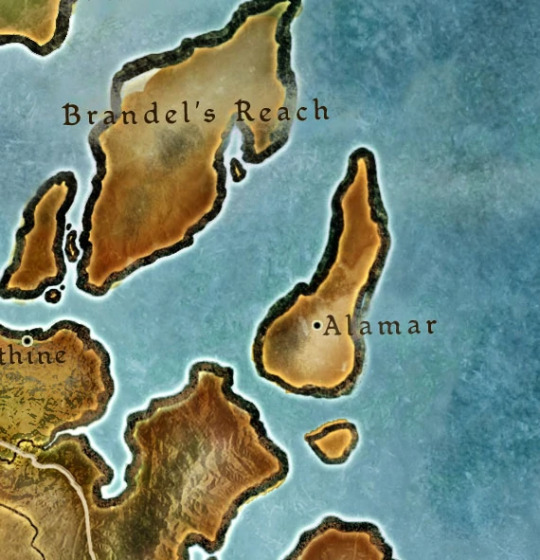
- Those little northwestern Fereldan islands don't have coastal focuses. Image from the wiki used because Alamar's tiny.
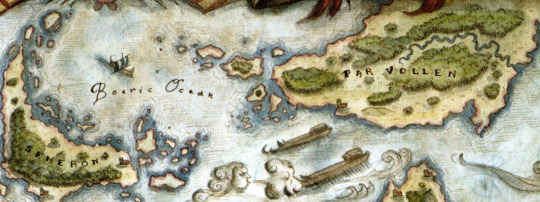
- Northern Seheron would be affected. We don’t know the concentrations of Seheron’s population. Much of Par Vollen would also be affected and the same holds true for them, but their technology (extremely seaworthy vessels, extreme perseverance, etc.) and cultural mindset lends to the idea that they would use the tides to their advantage strategically, as well as take advantage of the major boons spring tide would have on fishing! When the tide is coming in to its highest, it shakes things up and brings in all the fish.
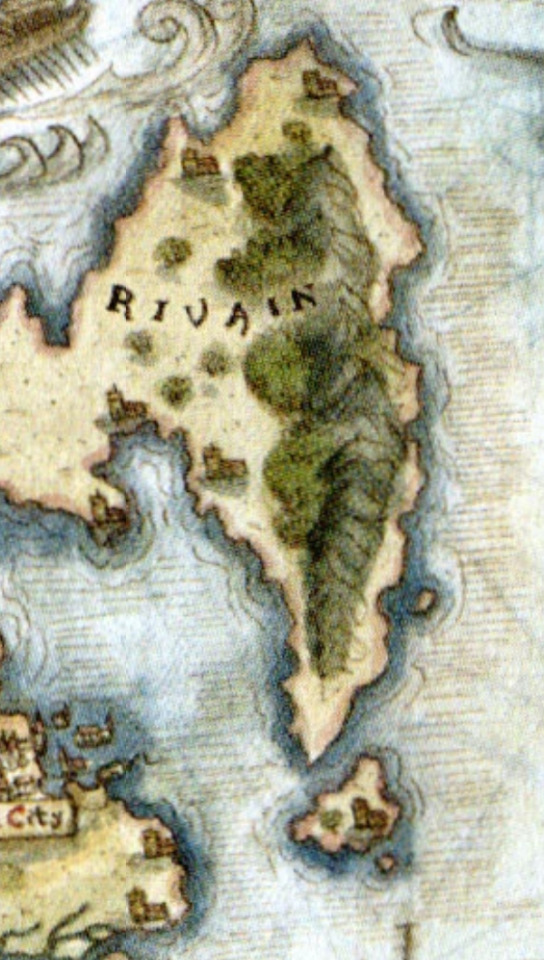
- Rivain isn’t notably populated east of its dominating mountains. Its major population centers are in the Southeast, on the Rialto Bay. Except Llomeryn. Rivain, as descendants of seafaring islanders, would have a long cultural history of being able to deal with this anyway. Why is Llomeryn (little house icon on the east coast of the southern island) on that side? I don’t know. It doesn’t make sense. It’s fine.
- I’m sure that Estwatch is doing just fine. They can handle themselves.
- Wycome is a major fishing hot-spot, taking advantage of the fishy boons the tides provide.
- Hercinia is coping, I guess.
In regards to coastal port cities on the Amaranthine ocean – the largest body of water on the map – a special situation may exist where they have ports designed to accommodate the very high high tides when they come in (how often would depend on the moons’ orbital periods and how often they are in orbital resonance). I’m sure there are examples of docks and ports designed like this from real life, and if anyone has info on that, hit me up.
This concludes the post about the implications of two moons in Thedas that nobody asked for!
Huge thanks to @feastforworms and @unshatters-your-teacup for science and input and humoring me on this.
#today is original content ofriday for me babey#dragon age#da#dragon age meta#dragon age lore#da meta#da lore#thedas#meta#nobody. nobody asked for this#a very productive 5 hours of my life#well certainly enjoyable#this is not counting the time spent formatting this for tumblr#rambles#thedosian meta#da worldbuilding
75 notes
·
View notes
Text
The world map through the eyes of different countries/continents
The world map through the eyes of Europe

The main meridian of the world passes through London. Both Americas and Australia are on the outskirts of the world, and the Pacific Ocean is not perceived as a single integral space. Also the equator is shifted to the lower half of the map, which makes Africa, South America and Australia smaller compared to North America and Eurasia than these continents and countries actually are.
The world map through the eyes of USA

The main vertical axis of the world passes through the United States. America looks like an «island», washed by the Pacific Ocean in the West and by the Atlantic Ocean in the East. As with the European map, the equator is on the lower half of the map, which makes the size of North America and Eurasia much larger compared to the size of South America, Africa and Australia than they are in reality. Besides Russia, India and China is more complicate for Americans to see as they are shown twice, both in the west and in the east.
The world map through the eyes of China

On their map China is located on the West coast of the Pacific Ocean. All the continents except Africa and Eurasia have access to this ocean, which makes them to places on the outskirts of the globe
The world map through the eyes of Australia

According to common model that something which is above dominates and something which is below is in a subordinate position. Australians not only display the vertical axis of the world as running through their mainland, but also place their country on top of all the others, effectively turning the map upside down 180 degrees. Like the United States, they become an island lying between the three oceans: the Pacific, the Indian Ocean, and the Southern Ocean. Another important role is played by the Antarctic, hidden at the bottom on all other maps but seen here at the top.
The world map through the eyes of Chile

This map of the world has been worked out by the scientists for the Military Geographic Institute with the further aim of eventual introduction into Chile’s school textbooks. As with the Australian map, here the ’standard’ map is also turned upside down, helping to give the impression that Chile has a dominant position in the world. At the centre of the map is the Pacific Ocean — this representation of the planet is closely related to the declared policy of modern Chile, which wants to become one of the most important business centres in the Pacific Region. In this regard, Chile is somewhat similar to China — both Africa and Europe are placed at the periphery of the world.
The world map through the eyes of South Africa

Like on Australian map, here South Africa is placed at the top rather than at the bottom, which makes the country to look more dominant than others. South Africa becomes a peninsula, wedged between two oceans: the Indian Ocean and the Atlantic. The Pacific region and Russia are on the outskirts of the world.
#interesting facts#map#world map#lingblr#langblr#lang blog#china#usa#europe#south africa#chile#australia#study blog#studyblr#languages#culture#politics#cultures differences#chinese#spanish#english
159 notes
·
View notes
Text
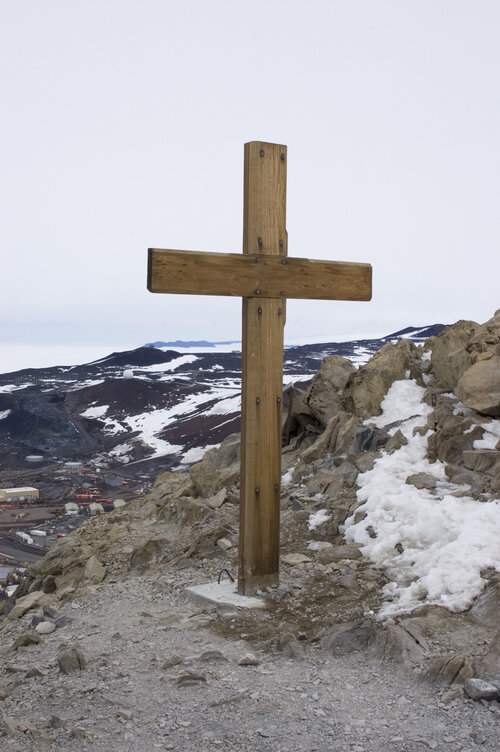
Observation Hill
To see the post in its original format, please visit twirlynoodle.com/blog
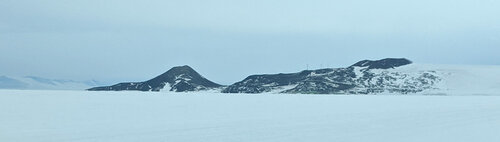
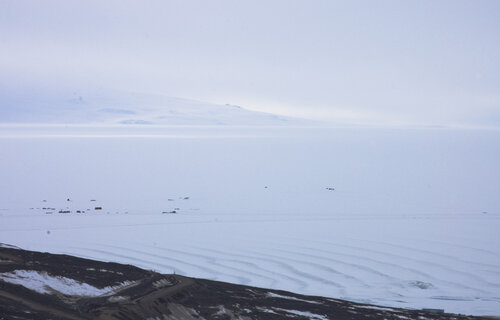
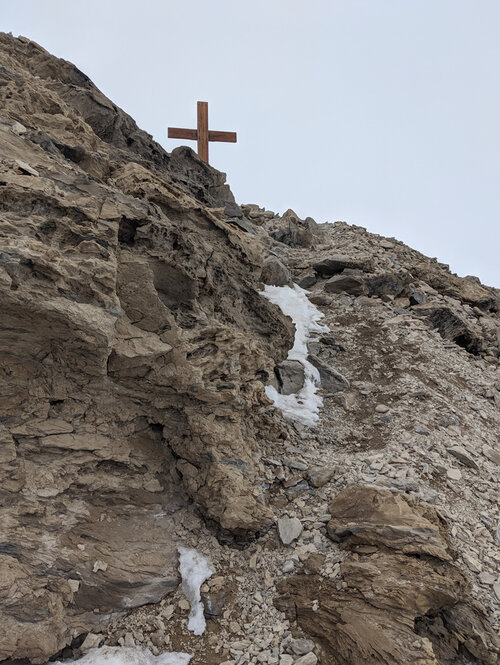
There is no mistaking Observation Hill when you arrive at McMurdo, if you know anything about it. It is a distinct cone, right at the end of the peninsula – even if you've never seen a picture of it, its name alone tells you it's a prime lookout, and sticking out into McMurdo sound as it does, it has clear views in every direction.
I had seen pictures of it, but I was still surprised how it loomed over the station. Unlike the vastly larger Mt Erebus, it is visible from everywhere; whether you're eating in the Galley or crawling back to bed from the Crary lab in the wee hours, it's always looking over your shoulder.
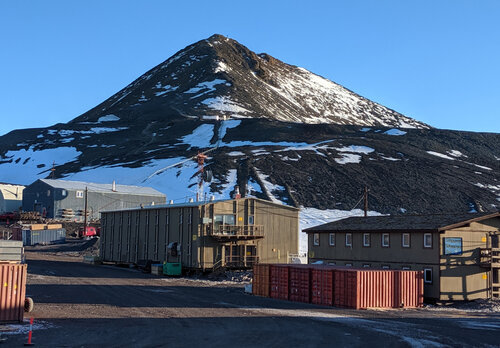
Though not apparent in the above photo, it is clearly visible in person that there is a large cross mounted nearly at the peak of the hill. Visitors especially from the States might assume it is just another expression of religious devotion – Christ died on a cross on a hill, so hilltop crosses are not unusual in a country which puts great stock in expressions of Christianity – but this is not another one of those things, in fact it isn't even American. This cross was erected in January 1913 by the surviving men of the Terra Nova Expedition, as a memorial to Captain Scott and the other members of his party who died out on the Ross Ice Shelf on their way home from the South Pole.
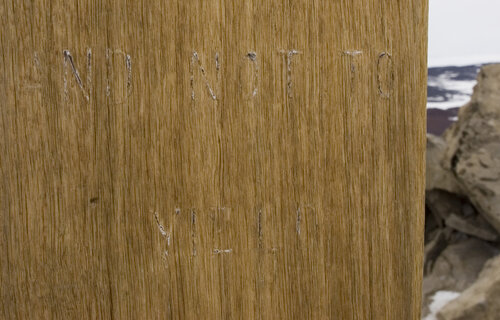
Before the ship arrived it was decided among us to urge the erection of a cross on Observation Hill to the memory of the Polar Party. On the arrival of the ship the carpenter immediately set to work to make a great cross of jarrah wood [an Australian hardwood]. There was some discussion as to the inscription, it being urged that there should be some quotation from the Bible because "the women think a lot of these things." But I was glad to see the concluding line of Tennyson's "Ulysses" adopted: "To strive, to seek, to find, and not to yield."
... Observation Hill was clearly the place for it, it knew them all so well. Three of them were Discovery men who lived three years under its shadow: they had seen it time after time as they came back from hard journeys on the Barrier: Observation Hill and Castle Rock were the two which had always welcomed them in. It commanded McMurdo Sound on one side, where they had lived: and the Barrier on the other, where they had died. No more fitting pedestal, a pedestal which in itself is nearly 1000 feet high, could have been found.
(Apsley Cherry-Garrard, The Worst Journey in the World, pp.565-7)
The establishment of the cross took two days: the first, to hack a hole in the volcanic rock in which to mount it, and the second to carry up the pieces and erect them.
It stands nine feet out of the rocks, and many feet into the ground, and I do not believe it will ever move. When it was up, facing out over the Barrier, we gave three cheers and one more. (ibid., p.567)
106 years later, there is a hiking trail up Observation Hill. I had intended to make a pilgrimage since the moment I arrived, but with everything else going on, and the ongoing challenge to get enough sleep, it wasn't until quite late in my visit that I finally made it.
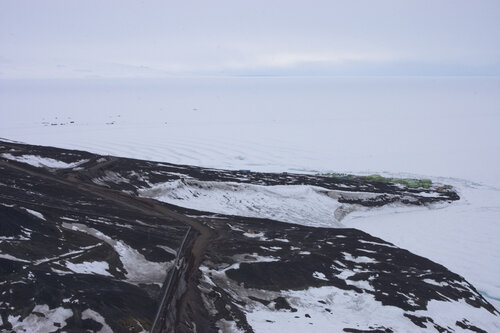
My first attempt was on a relatively fine day, when I thought I could get some good views. The trailhead was clearly marked on the station map, but when I got there I couldn't find a way to reach it without crossing a fuel pipeline, and I had a dim recollection from orientation that this was a big no-no. I wandered about looking for access until I started getting a headache from the fumes, and gave up.
The next opportunity came a few days later, after I'd found out from a veteran that it was OK just to step over the pipeline there. It was a thickly cloudy day, and hazy by Antarctic standards, so I wouldn't get as good a view, but that did mean I could look forward to having the hill to myself. So I stepped over the pipeline and started up.
It looks like a terribly steep climb from the bottom, but once on the slope it's not so bad, and is far less slippery than the gravel slope of Arrival Heights. Partway up I passed a mountain rescue class, but beyond that the trail was entirely mine.
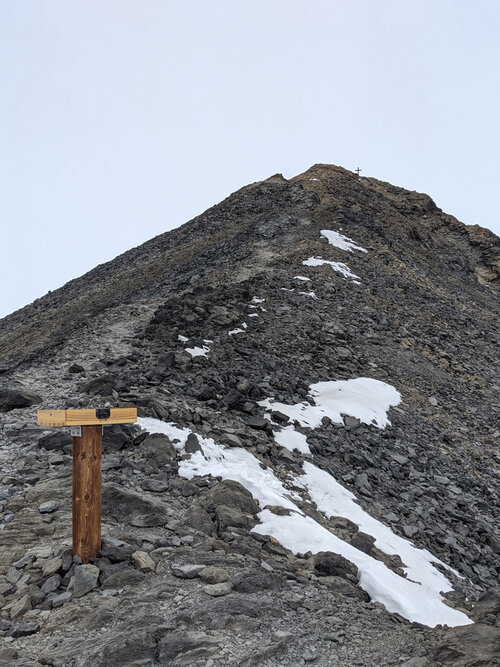
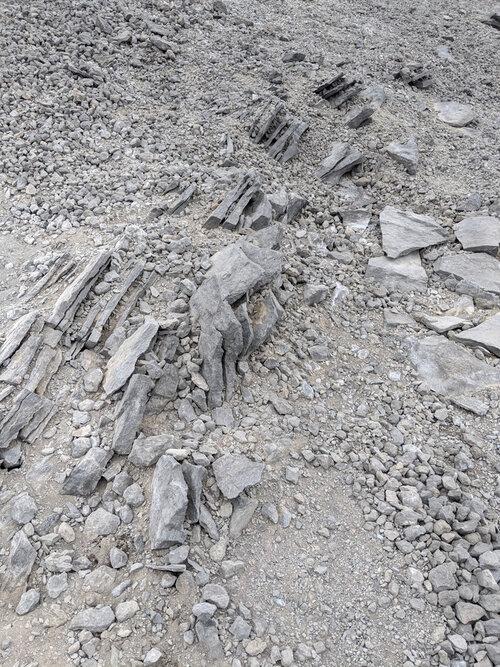
Like the rest of Ross Island, Observation Hill is volcanic in origin – in fact it was once a small volcano of its own. Unlike the subglacial volcano that is now Castle Rock, which grew cylindrically through a hole it melted in the ice, Observation Hill must have been uncovered in its later years at least, because it has the classic cone shape made by molten rock running down the outside. It is a lighter colour than much of the rest of the exposed rock in the area, and in places, it gives a really good impression of being sedimentary rather than igneous.
While the climb was not as physically intense as I had feared, it did still make me very warm, and I had two pauses, not to catch my breath but to cool down. One was to watch the rescue class, the other was when, somewhere near the top, I lost the trail, and examined the terrain for a while to guess which side would be least fall-off-able. I chose the wrong one, it turns out – I didn't fall off, but I did have to pick my way over some bare rock and came out above the cross, which is mounted in a pocket of rubble just off the peak.
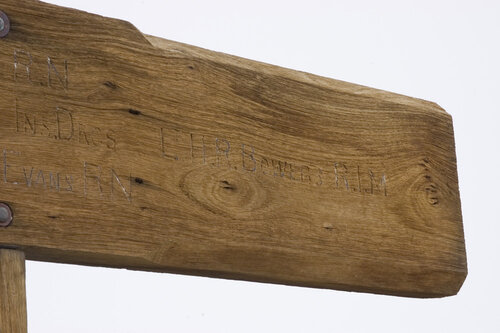
It's hard to tell from the photo but it is in fact quite large – I am an average sized female and I stood well under the crossbar. The inscription is still there, but over a century of blizzards have battered it, and some parts are just barely decipherable.
The names – above of the worst of the blowing grit – are still legible. This gave me one of those moments which always seems to come by surprise. I have lived most of my life, and certainly all of my career, in close proximity with fictional characters, who demand to be believed in, either out of escapist necessity or professional duty. Most of the time I am off in my own little world, and the fact that that little world is now a historical moment in Antarctica does not, necessarily, make it more real, in relation to my literal present reality, than any movie I've worked on. I know these guys were real, I have seen film footage of them, and read their handwriting, and, some of them, even met members of their families! But when I'm up to my elbows in the work, it's easy to give it the part of my brain that suspends disbelief on a production. Suddenly something will come along that jolts me back to their reality: in this case, a name carved on a physical object by someone who knew them personally.
At the same time, this physical object impressed upon me again just how much time separates their reality and mine. Originally the cross was painted white, with the incised letters filled in black. Only a little of the white paint remains in the deepest recesses of what are quite shallow letters, now. In 1960, when Silas Wright returned and was photographed up here, the wood had already been scoured clean. His visit was 47 years after the cross was put in place, and 49 years before mine. The same imagination that conflates historical realities with fictional ones can make those years evaporate, but that is still a lot of years, and erosion, unlike imagination, doesn't lie.
Cherry may have believed that the cross would never move, but it has in fact blown down twice, once in the winter of 1974 and again in 1993. Its restoration in 1994 was a significant effort: a new concrete "boot" was made for it at Scott Base and delivered to the site by helicopter, and the cross itself was relayed up the hill by teams of helpers. (You can see photos of the event here, p.44) I cannot say how moving it is to see such an outlay of resources and enthusiasm by people who never met the Polar Party, to perpetuate their memory.
The cross isn't the only thing to see at the top of Observation Hill, of course – there is everything else. It turned out to be the perfect way to end my tour of Terra Nova landmarks, not only because it was the last bit of home territory the Terra Nova men themselves visited, but because I could see nearly everywhere I'd been from up here.


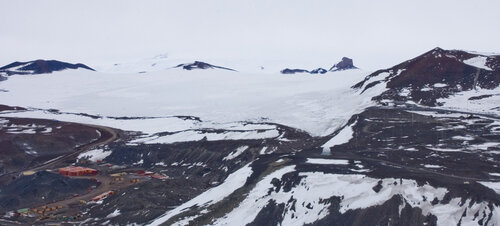
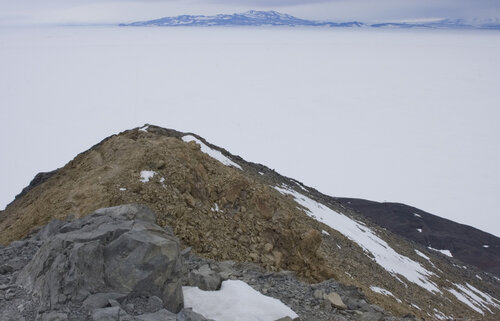
As you can see, it was not the greatest day for landscape photography, what with the matte light and the taller mountains being covered with cloud. But I had not come up here to take pictures. The sombre atmosphere befitted what I had come to do, which was to remember these men and thank The Powers That Be for the blessings that had been showered upon me in the last few weeks.
The cross faces south, towards their last camp, and the Pole. This is, of course, a thoughtful and fitting aspect of the memorial. It also gives the impression of a beacon, a light in a window, a lighthouse on a headland, guiding them home. The men who erected it knew the men were dead. They are still dead. We all know this. But they are still out there somewhere, and it is not impossible to imagine some small irrational part of the human psyche wanting, in some small way, to show them the way back, and call them back by name.
Minna Bluff was covered in cloud, so I couldn't use it as a bellwether, but the wind started to pick up and was colder than before, so I thought I should start heading down again. The correct trail was obvious from this end, and I poked along it for a little way before everything caught up with me and I sat down to have a little cry.
The cross is a historical artefact, and while it is not as plum or as complex as the huts, it still requires conservation. Alarmed by the degree of erosion on the lettering, the Antarctic Heritage Trust has devised a shell to protect it from the worst of the winter winds. That will do something, but it has already lost a lot. When I was up there, I wondered why it hadn't ever been repainted, as the paint would go a long way to protecting it, and when the paint wore off it could just get repainted instead of eating further and further into the wood. The raw timber is more harmonious with the environment, and I like it better aesthetically that way, as do many others I'm sure – the white cross with black letters in Debenham's photo from 1913 is very stark and artificial in such a magnificent landscape. But it would last a lot longer.
On the other hand, generations of Antarcticans now have the cross as a touchstone, not only as their link to the history (not everyone gets to visit Cape Evans) but as a landmark in their own experience of Antarctica. It was personally important to the men who painted it white and put it up, but it is also personally important to hundreds, if not thousands, of people since then, who have never seen it white and don't know that's how it started, and might see the repainting as a travesty. If it were to be conserved, to what extent would that go? Would the letters be re-carved deeper, obliterating what remains of Davies' original work? At what point does conservation end and adulteration begin?
The alternative is to take down the original and keep it somewhere out of the weather – Scott Base perhaps – and replace it with a replica. Jarrah is still available, the letters could be carved afresh, it could be the bare wood everyone has known and loved for the last fifty years at least, and the original could be saved from the effects of weather once and for all. But doesn't this defeat the intent of the original in some way, and make it – dare I say – a Disneyland version? Do we owe more to history to keep it as it is and let the elements wear it down, or to preserve it as long as possible and do whatever might be necessary to extend the experience and historical understanding of a place, if not its authenticity?
These are all questions that curators and conservators have been grappling with for years, so I leave it to them to make the decisions. I am grateful to have seen the original, and to have a moment to myself up there to reflect on these things, and more. I hope, whatever happens with it in the future, Observation Hill is not de-crossed entirely. How else will they find the way home?
#antarctica#mcmurdo station#observation hill#conservation#history#memorial#artefacts#scott expedition#terra nova expedition#scott base
78 notes
·
View notes
Photo


Landing on snow and ice: Airfields and airstrips in Antarctica
Antarctica, while not having any regular population, nonetheless has a number of research stations and other non-regular settlements, some of them permanently inhabited. A number of those are further inland, far away from all coasts. For those, planes are essential to deliver supplies so as not to rely on dog sleds or other, motorized, land-based transport (see first picture from the bottom), at least not exclusively.
As a result, there are more than 50 designated places for airplanes to touch down on the continent at the South Pole, and most are on ice or snow, with only few close to the coast having runways on gravel or graded earth. One of those, and also one of the oldest airports in Antarctica is Marambio Airport (second photo from above), serving the Argentinian Marambio Base, located on a small reliably ice-free island near the end of the Antarctic peninsula.
On the other airfields planes can mostly only land if they have skis installed rather than wheels, and so airstrips in Antarctica are often called skiways. A few exceptions exist, but those apply mostly only to ice runways, which tend to be available just a few months a year, in the case of the US-owned Ice Runway (third photo from above) this is typically from October to December.
While some airfields are closer to being proper airports, in the case of the US-owned Phoenix Airfield (first photo on the top) even supporting the use of various instrument navigation systems, due to the necessary facilities existing on the ground, other ones exist only as a refueling site. Midpoint Skiway or Airstrip (fourth and fifth picture from above) consists only of an ice runway, a vehicle that levels snow, some barrels with fuel and a flexible tank (also called fuel bladder). Being an inland skiway more than 500 km from the nearest research station, it is in an extraordinarily desolate location, even penguins would be a rare sight.
Read more:
Michael Lucibella, Phoenix Rising in Antarctic Sun, November 21 2016
Guillaume Dargaud, Pictures of Antarctic Bases
National Science Foundation, US Antarctic Program Interagency Air Operations Manual
National Science Foundation, Initial Environmental Evaluation, Development of Blue-Ice and Compacted-Snow Runways in Support of the U.S. Antarctic Program (1993)
Ian Petchenik, Troll Research Station, How to operate an airport in Antarctica, in the flightradar24 blog
Fundación Marambio, Base Aérea Vicecomodoro Marambio (in Spanish)
A map of Antarctic airstrips of note (excluding e.g. Midpoint Skiway) can be found on OurAirports.com
Image sources:
(From top to bottom)
Phoenix Airfield: Michael Lucibella, National Science Foundation, Public Domain
Marambio Airport: Casa Rosada (Argentina Presidency of the Nation), CC BY 2.5 AR, via Wikimedia Commons
Master Sgt. Jose Lopez Jr., Public domain
Refueling at Midpoint Skiway: Dargaud, CC BY-SA 4.0, via Wikimedia Commons
Midpoint Skiway seen from the air: Dargaud, CC BY-SA 4.0, via Wikimedia Commons
Motorized land transport in Antarctica: StephenHudson on Wikimedia Commons, Public Domain
1 note
·
View note