#distribution of molecular velocities
Explore tagged Tumblr posts
Visit Tumblr Blog
Explore Tumblr blogs with no restrictions, modern design and the best experience.
Last Seen Tumblr Blogs


Fun Fact
The “We are the 99%” Tumblr blog became the slogan for the Occupy Wall Street movement.
Text

TSRNOSS, p 710.
#pipecolic acid#grain dust explosion#pollen grain#deep sea fish#distribution of molecular velocities#Peruvian mummies#nitrates in the soil#sunburn#ultraviolet absorption by biomolecules#early Earth#cloud cover
0 notes
Text
All about Wolf-Rayet stars
Some facts about Wolf-Rayet Stars
Wolf-Rayet stars are named the ‘most massive and brightest stars known’. This is because their temperatures start at 30,000 degrees celsius. They also have strong stellar winds which blow away their outer atmospheres, revealing the stars’ inner layers. Blowing at over ten million miles per hour, the stars shed about 2 thousand billion billion tons of material every year. That’s equivalent to the mass of three Earths! Since these stars have trouble holding themselves together, they don’t last very long, burning up their fuel quickly and blasting mass into space, eventually tearing themselves apart. They are usually members of binary stars with O or B stars (types of stars classed by temperature) as companions.vd
The discovery
The French astronomers Charles Wolf (1827-1918) and Georges Rayet (1839-1906) co-discovered this type of unusual, hot star, which are now named after them. They discovered Wolf-Rayet stars by using the Paris Observatory’s 40cm Foucault telescope in 1867 to observe three stars whose spectra had strong, broad emission lines, but few absorption lines, which is unusual for stars.
For decades, the reason for these emission bands remained a mystery. Eventually, it was discovered that these lines resulted from the presence of helium, which was discovered in 1868, one year after the original observation. E.C.Pickering also compared Wolf-Rayet spectra with nebula spectra, and noticed similarities between them. This led to his discovery that some or all Wolf-Rayet stars are in the centre of nebulae.
In 1929, doppler broadening (the broadening of spectral lines due to the Doppler effect caused by a distribution of velocities of atoms or molecules) was being used to explain the width of the emission bands. It was concluded that the gas surrounding Wolf-Rayet stars must be moving with velocities of 300-2400 km/s, and therefore they are continually ejecting gas into space. This produces an expanding envelope, or bubble, of nebulous gas. The force that ejects this gas was then discovered to be radiation pressure.
Later, Rayet became Director of the Bordeaux Observatory, and to this day, we have discovered over 500 Wolf-Rayet stars in our galaxy.
About the most massive star, R136a1, which is a Wolf-Rayet star
R136a1 is the most massive star known, which is a Wolf-Rayet star. It is 163,000 light years away from the Sun, and is located in the Large Magellanic Cloud. It is also part of the R136 super star cluster, and has the mass of 315 suns. Despite being the most massive star known and shining 9 million times brighter than the sun, it requires a telescope to see. An interesting fact about R136a1 is that it defies what scientists know about how stars form. A popular hypothesis among scientists is that R136a1 did not form directly from the collapse of a molecular hydrogen cloud, but rather from two massive stars colliding.

About WR 124, a Wolf-Rayet star
WR 124 is 15,000 light years away from the Sun. Its spectral type is WN, meaning it falls into the hottest ‘O’ spectral type of stars, but is referred to as ‘W’ from Wolf-Rayet. The ‘N’ means it shows strong emission lines of nitrogen. WR 124 is the glowing star in the centre of a huge, fiery nebula. WR 124 has a surface temperature of around 50,000 degrees celsius, and is one of the hottest known Wolf-Rayet stars. It is a massive, unstable star which is blowing itself apart. Its material is travelling at up to 150,000kph. The nebula that surrounds the star, M1-67, consists of vast arcs of glowing gas which is violently expanding outwards into space. M1-67 is quite young, only 10,000 years old, and it contains clumps of material within it with masses 30 times the mass of Earth and diameters of 150 billion km.

WR 7, another Wolf-Rayet star
WR 7 is also 15,000 light years away from the Sun. It produced the emission nebula NGC 2359, which is also known as Thor’s Helmet because it looks like a helmet with wings. The nebula has a diameter of around 30 light years, and has WR 7 at its centre. Its surface temperature is between 30,000 degrees celsius and 50,000 degrees celsius, which is 6 to 10 times the temperature of the sun. It is an incredibly unstable star, ejecting stellar material into the interstellar medium at speeds which approach 7.2 million kph! Even though it is a massive star, it loses the mass of the Sun every thousand years. Material ejected from the star is done so in a spherical manner, which produces a bubble of material. This bubble has been shaped further by its interactions with the surrounding interstellar medium. WR 7 lies at the edge of a dense, warm molecular cloud, which is unusual.

6 notes
·
View notes
Text

Back to the past: The death of stars reveals their birth
Following a backward approach in the history of these celestial bodies, researchers at SISSA have achieved a new result that defines the mass of newly formed stars, even in previously unreachable parts of the cosmos
A new article published in “Universe” describes an approach that looks back from the deaths of stars to their births, allowing the so-called initial mass function (IMF), i.e. the way in which star masses are distributed after their formation, to be derived from observations of supernovae and gamma radiation. By applying a common computational method of parameter estimation, scientists have managed to derive the IMF of regions of the cosmos that are too distant for direct observation by telescope. The work was conducted by a team of researchers from the Scuola Internazionale Superiore di Studi Avanzati (SISSA) of Trieste, the National Institute for Nuclear Physics (INFN), the Institute for Fundamental Physics of the Universe (IFPU) and the National Institute for Astrophysics (INAF).
The IMF obtained by the authors of the study was surprisingly similar to that measured in regions of the Universe closest to us. The scientists consider this to be possible evidence of a universal IMF. The result will now be tested by observations made by telescopes such as the JWST and Euclid.
Is the IMF a universal constant? Possibly
“All stellar populations observed in our neighbourhood appear to display a surprisingly similar initial mass function (IMF). This may indicate that the IMF is a universal constant of star formation in any region of the Universe. Unfortunately, instrumental limitations prevent scientists from examining stellar populations beyond the local Universe to test the IMF universality” explains Francesco Gabrielli, researcher and author of the study, along with Andrea Lapi and Mario Spera.
Star formation is one of the most fascinating processes in the Universe, occurring in dense internal regions of galaxies through the collapse and fragmentation of clouds of molecular gas. When a mass of gas becomes sufficiently hot and dense it starts burning hydrogen, and shining: this is when a star is born.
Supernovae and gamma-ray bursts used to calculate the IMF
The new research began with a backward look and, more specifically, from the knowledge that the course of a star's life depends on its mass. Massive stars end their lives in spectacular explosions called supernovae. Some supernovae are believed to eject a high-velocity jet of material that emits gamma-rays in a so-called “gamma-ray burst.” Since the occurrence of a particular type of explosion depends on the mass of the star, the number of such explosions occurring in the Universe will depend on the number of stars that form with the right mass - in other words, on the IMF.
Francesco Gabrielli explains: "My group and I have developed a new method, based on these considerations, to determine the IMF beyond the local Universe. In particular, we have used a computational method that is actually quite common but has now been used for the first time to reproduce the number of supernovae and gamma-ray bursts observed in the Universe. Since these quantities depend strictly on the IMF, this has allowed us to precisely determine the form of the IMF that best represents the observations".
Test by observation
Using this approach for the first time, the researchers succeeded in developing a new methodology for determining IMF. One particularly fascinating discovery was that the IMF calculated for the distant Universe was surprisingly similar to that measured in the local Universe, providing possible evidence of a universal IMF.
Gabrielli concludes: “This is an exciting time for astrophysicists, with many new telescopes such as the JWST and Euclid now beginning to take observations. As a result, exceptional numbers of observations of supernovae and gamma-ray bursts are expected in the coming years. It will be exciting to see what this new wealth of data can tell us about the IMF and its universality. A deeper understanding of the IMF would lead to important advances in various areas of astrophysics, including the formation and evolution of stars, the chemical enrichment of the Universe, and the observation of gravitational waves emitted by colliding black holes”.
0 notes
Text
Summary: Halonen et al. (2023)
In this post I'm going to summarize a part of the article by Halonen, R., Neefjes, I., Reischl, B. (2023). Further cautionary tales on thermostatting in molecular dynamics: Energy equipartitioning and non-equilibrium processes in gas-phase simulations. Journal of Chemical Physics, 158, 19. I am only going to summarize the first part of the article focusing on the comparison of Nosé-Hoover, stochastic velocity rescaling, and Langevin thermostats in equilibration of molecular dynamics simulation systems.
Equilibration of a molecular system aims at distributing the total kinetic energy of the system equally to the translational, rotational, and vibrational parts. This is known as classical equipartition, which is a property of a system in a thermal equilibrium. Maintaining equipartition is crucial in modelling chemical reactions, as the translational and rotational energies of the molecules affect the intermolecular forces and the molecules' trajectories, and the vibrational energy determines the stability of a chemical compound.
One famous example of the violation of equipartition is the so-called "flying ice cube effect". It occurs when the kinetic energy gets transferred to translational energy at the expense of vibrational and rotational degrees of freedom, giving rise to what is effectively a solid object moving aroung at high speeds. The authors note that this is a challenge especially in gas-phase simulations, where the molecular collisions transferring energy from one mode to another are rare. In condensed phase the issue rarely arises owing to the frequent collisions between neighboring molecules. Thus a special attention has to be paid to proper thermostatting in gas-phase simulations in order to avoid such unphysical effects.
The authors compare the commonly used Nosé-Hoover, stochastic velocity rescaling, and Langevin thermostats in equilibration of a system of 30 dimethylammonium ions. The Nosé-Hoover thermostat introduces to the system a virtual particle that exchanges energy with the rest of the system. The mass of the virtual particle can be adjusted, which determines how strongly a given temperature is enforced. However, this approach can cause some unphysical behavior for small systems, which is resolved by adding multiple thermostats, or Nosé-Hoover chains. The authors use a chain of three thermostats.
In stochastic velocity rescaling the approach is to assign the total kinetic energy of the system at random, corresponding to the physical fluctuations in kinetic energy at a given temperature. A relaxation time parameter controls the magnitude of the fluctuations. Both Nosé-Hoover and stochastic velocity rescaling thermostats are examples of global thermostatting methods, meaning that they affect all the particles in the system the same way.
The Langevin thermostat is an example of a local thermostatting method. It replicates the system's interaction with a surrounding solvent, causing the molecules to experience random collisions. This is in contrast to global methods as for each particle the thermal equilibrium is maintained separately by the interactions with the virtual solvent. This, however, creates unphysical disturbances in the trajectories of the particles.
The authors study how fast each of these thermostats are able to equilibrate the system using different control parameters for the thermostats. All the thermostats were found to produce the correct total kinetic energy. However, Nosé-Hoover and stochastic velocity rescaling thermostats only achieved equipartition of the kinetic energy with a significant delay. The authors note that this is a consequence of the global thermostatting procedure: the particles' kinetic energies are merely scaled, not redistributed between different degrees of freedom. The authors further state that the redistribution is only possible in collisions between particles.
As the equilibration requires collisions between particles, the local Langevin thermostat is found to outperform Nosé-Hoover thermostat and stochastic velocity rescaling in that respect. As in gas-phase systems the collisions between molecules are infrequent, the introduction of a virtual solvent significantly reduces the time required for equilibration. However, Nosé-Hoover and stochastic velocity rescaling thermostats are found to be able to preserve equipartition once it is achieved. The authors suggest using Langevin thermostat in the beginning of the simulation for equilibration purposes, and switching to either of the global methods for the actual simulation.
ALMS progress: reading 1 h, text 1 h 45 min, total 2 h 45 min
71 h 20 min
0 notes
Text
What is anionic polyacrylamide for wastewater treatment?
Anionic polyacrylamide (APAM) is a synthetic polymer widely used in wastewater treatment processes. It is specifically designed to aid in the removal of suspended solids, organic matter, and other pollutants from wastewater, enabling cleaner and safer water discharge.
APAM is an important flocculant and coagulant aid in the treatment of industrial and municipal wastewater. Its main function is to promote solid-liquid separation by aggregating fine particles into larger flocs, which can then be easily separated from the water.
The key properties of APAM make it highly effective for wastewater treatment applications:
High molecular weight: APAM has a high molecular weight, which allows it to form large and stable flocs. This enhances the settling velocity and improves the efficiency of solid-liquid separation processes.
Anionic nature: APAM carries negative charges along its polymer chain, enabling it to interact with positively charged particles in the wastewater. This charge interaction neutralizes the surface charges of the particles, leading to their aggregation and subsequent precipitation.
Excellent water solubility: APAM exhibits exceptional water solubility, ensuring easy and uniform distribution throughout the wastewater. This facilitates its interaction with the suspended solids, organic matter, and other contaminants present in the water.
pH stability: APAM maintains its functionality over a wide range of pH values typically encountered in wastewater treatment systems. This enables its application in various treatment processes without compromising its performance.
The application of APAM in wastewater treatment involves several steps:
Dissolution: APAM is typically supplied in a powdered or granular form. It is dissolved in water to form a concentrated solution, which is then added to the wastewater.
Mixing: The APAM solution is mixed vigorously with the wastewater to ensure uniform distribution and maximize contact between the polymer and the contaminants.
Flocculation: As APAM interacts with the suspended solids and other pollutants, it forms larger flocs through charge neutralization and bridging mechanisms. These flocs entrap the contaminants, forming a settleable mass.
Sedimentation or flotation: The formed flocs settle under gravity or are separated by flotation processes, depending on the specific wastewater treatment system. The settled flocs can be easily removed as sludge or subjected to further treatment if necessary.
Filtration or additional treatment: In some cases, the treated water may undergo additional filtration or treatment steps to remove any remaining fine particles or residual contaminants.
The use of anionic polyacrylamide in wastewater treatment offers several benefits, including improved suspended solids removal, enhanced clarification, reduced sludge volume, and increased overall treatment efficiency. It is a versatile and cost-effective solution for various industries and municipalities seeking to meet stringent environmental standards and discharge clean water.
In conclusion, anionic polyacrylamide plays a vital role in wastewater treatment by facilitating the separation of suspended solids and pollutants from water. Its unique properties make it an effective flocculant and coagulant aid, ensuring cleaner and safer wastewater discharge.
0 notes
Text
TAFAKKUR: Part 397
A SUBTLETY OF THE QUR'AN THE SECRETS OF THE ATMOSPHERE: Part 1
Then He applied His design or turned to the sky (or heaven) which was yet but smoke (Arabic: dukhan) and said to it and to the earth, ‘Come, both of you, willingly or unwillingly.’ They both responded, ‘we do come in obedience’ (al-Fussilat, 41.11).
Sura ‘Fussilat, which may be translated as the chapter of ‘Detailed Explanations’, is the second chapter in the Qur’an beginning with the letters ‘Haa’ and ‘Mim’ and was frequently recited by our beloved Prophet.
The eleventh verse quoted above follows a verse explaining the creation or genesis of the world. As with the other verses in the Qur’an, this verse has many profound meanings but I shall try to explain it from the point of view of geophysics.
On reading the verse several times over, we must note with care the subtle meanings which lie beyond the ordinary in the declarations of God Almighty. I would like to draw the attention of the reader to these points in what follows:
a) ‘Then He turned to the heaven which was yet but smoke.’
This expression discloses a special secret. For when God Almighty wishes something, He simply says ‘Be’ and it is. Why does the verse specifically indicate that ‘He turned to the sky’? It is drawing our attention to the fact that an important scientific insight is about to be revealed.
b) He sends out a call for cooperation to the earth and the heaven. He orders them to ‘come (and cooperate with each other) whether you like it or not. Again, in the power of God Almighty and the certainty of His commands, there can be no such thing as the insubordination of the created. The command ‘come, even if unwillingly indicates that there is difficulty in the cooperation of the earth and its heaven. Further, it is indicated that the heaven which harmonizes with the earth is the one closest to the earth.
Let us now investigate the relationship between the earth and its ‘closest heaven’ in terms of the precepts of contemporary geophysics. Until quite recently, it used to be assumed that life would originate on any planet having the proper temperature. In recent years, however, space explorations have revealed that the possession of an atmosphere is one of the most difficult things for a planet to achieve. In other words, there is a baffling opposition between a planet and its atmosphere (which might be called its ‘nearest heaven’). For the atmosphere consists of gaseous atoms in the ‘near sky’. In all large planets these atoms are assimilated to the surface of the planet, while in small planets the gravitational force is insufficient to bind the atoms. These gases then escape, leaving the planet barren.
Now let us reread the sacred verse in the light of this very brief information, and in particular the second sentence:
‘Come, both of you, (come together) willingly or unwillingly.’
The molecules and atoms in the atmosphere try to escape into space, while the earth tries to attract and captivate them. In other words, their partnership is unwilling; it is forced.
The scientific magnificence of this sacred verse consists in the fact that it is telling us this secret fourteen centuries ago. Fifty years ago no one was aware of this fact.
In order to ascertain the inner meaning of the sacred verse, let us expand our knowledge of geophysics a little further. What are the conditions for the formation of an atmosphere on a planet and so, by implication, on earth?
For the formation of an atmosphere, the motions leading to the escape of molecules have to be counterbalanced by the gravitational attraction of the earth. This is an almost impossibly difficult condition to fulfil. For all planets throughout the universe, the odds may be less than a billion to one. This is the fact that the chapter ‘Detailed Explanations’ expresses.
‘And then He turned to the heaven.’
This statement contains the secret of how God Almighty renders all things possible. From the standpoint of geophysics, these extremely difficult conditions require the preservation of three important balances:
1. Atmospheric temperature,
2. Proportionate gravitational attraction on the part of the earth,
3. The non-violation of this balance by various radiant energies arriving from space.
1. ATMOSPHERIC HEAT
The ability of molecules to escape is dependent on heat. Environmental heat should obey the following characteristics:
a) The distance of the earth to the sun. If the earth were closer to the sun, the heat produced in the environment of the atmosphere would cause all the molecules to ‘boil off and escape. On the other hand, if the earth were farther away from the sun, the molecular movements would slow down, the molecules would condense and be assimilated by the earth.
b) The heat the earth receives from the sun must be evenly distributed over the earth’s atmosphere. For this the earth has to rotate on its axis with a definite velocity. If it rotated too slowly, sudden cooling would be absorbed by the surface in that region. If it were to rotate too fast, the various regions would not get the chance to be heated evenly.
The earth, therefore, must rotate at its present speed. However, this balanced rotation is likewise insufficient to dispose of the question of heating. For next the equator of the earth, which receives a larger portion of the sun’s energy, begins to heat up, while the Poles cool even further leading to the condensation and absorption of the atmosphere at the Poles. So the axis of the earth must remain tilted, balancing the heated regions by continually interchanging them. This is why the axis of the earth is slanted 23.5 degrees.
The declaration ‘They both responded, we come willingly’ at the end of the sacred verse gives expression to this inner meaning, God’s order, ‘come, (cooperate, come together)’ points simultaneously to the automatic inclination of the earth and its possession of a moderate rotation. For the earth, too, takes the appropriate physical measures demanded of it by the command.
c) The earth has to retain the heat it gains, to store it for a certain period. In other words, the earth needs a ‘blanket’. This blanket is provided by the gaseous carbon dioxide in the air. But before the atmosphere had formed, where was the carbon dioxide to regulate the heating process? We know from geophysics that the initial atmosphere of the earth was composed primarily of carbon dioxide.
The sacred verse reveals this secret as well. What does ‘which was yet but smoke (dukhan) mean?’ It is known that in its initial period, the earth possessed an atmosphere consisting mostly of smoke (carbon dioxide). It was thanks to this primordial gas that the earth retained its heat and was able to form the atmosphere of today.
#allah#god#prophet#Muhammad#quran#ayah#sunnah#hadith#islam#muslim#muslimah#hijab#help#revert#convert#dua#salah#pray#prayer#reminder#religion#welcome to islam#how to convert to islam#new convert#new revert#new muslim#revert help#convert help#convert to Islam
2 notes
·
View notes
Text
particulate physics
particulate physical energy is analyzed in temperature and pressure form and related characteristics
temperature in physics
measure of particulate motion energies in Kelvin (K, 0ºC = 273.15 K)
two entities that come into contact with one another always exchange energies until they reach the same temperature and are thus in thermal equilibrium (TE)
0th thermodynamic law: two objects both in TE with the same third object are also in TE with one another
state of an element at changing temperatures across a given pressure can be visualized via phase-shift diagram (y=pressure, x=temperature)
triple point – element exists in solid, liquid, and gas phase at once
absolute 0 K temperature indicates that gas form has 0 pressure
laws of temperature and pressure
Boyle’s Law – volume varies indirectly with pressure, V = n/P
Charles’ Law – temperature varies directly with pressure, T = nP
combined, they make up the ideal gas law PV = NkT in physics terms, where N = molecules and k = Boltzmann’s constant at 1.38e-23 J/K
or PV = nRT in physics terms, where n = mols, R = gas constant 8.314 J/(mol K), and n • R = N • k as related by Avogadro’s number 6.022e23/mol
P, V, and T are state variables, i.e., they determine both present and future state of element/entity
for particulate kinetic energy of molecular movement, KE(avg., gas) = 1.5 • kT
or KE = (3 df / 2) • kT, where gas has 3 degrees of freedom
KE for a gas can be related between (3/2) • kT and 1/2 • mv^2, to find the velocity of the gas particles
mean free time and path
mean free time (tau, τ) – average time before particle collides with another
mean free path (lambda, λ) – average distance before particle collides with another
more collisions → shorter τ and λ due to increased probability of colliding in a given amount of time
distance λ can be calculated using the state variables and the equational relation λ = 1 / (4√2 • πr^2 • (N/V)) for r = radius of spherical molecule, N = molecules, V = volume
the above applies only if all molecules in the entity are moving
thermal expansion
change in entity’s dimensions is directly proportional to change in temperature
∆L = L(0) • α • ∆T, where L = length of entity, α = material-specific coefficient of linear expansion, and T = temperature in either ºC or K
for volume, ∆V = V(0) • 3α • ∆T, where 3α = β, the volume material-specific coefficient of linear expansion, and T = temperature in either ºC or K
total ∆L or ∆V is evenly distributed over entire entity, which factors into calculations for expansion distance
heat energy
heat, Q – the energy that flows between entities of different temperatures in order to reach thermal equilibrium
∆T varies directly with Q and indirectly with mass → ∆T = Q • (1/mc), where m = unit mass and c = material-specific specific heat capacity constant
-Q = energy leaving an entity and +Q = entity gaining energy
when heat is applied to an entity, it remains in the same physical state until all the energy needed to transition to the next is gathered from the transferred heat
the period of time in which this occurs is known as the phase transition and the gathered heat is the latent heat
Q(fusion/melting) = m • L(f), where m = mass and L(f) = heat constant of fusion
Q(vaporization/condensation) = m • L(v), where L(v) = heat constant of vaporization
sublimation/deposition = jump two phase transition steps
other forms of particulate energy transfer
radiation – electromagnetic energy transfer, with power = some n • T • Area of radiating region
radiation – Stefan-Boltzmann law is Q/s = σ • T⁴ • A, where σ is the Stefan-Boltzmann constant, A = total area, and Q/s = q = heat/sec
convection – transfer of liquid/gas motion energy, warm entity → cooler areas
conduction – transfer of particulate motion energy, fast entity → slower entities and transfer rate = n • ∆T(entity 1, entity 2)
4 notes
·
View notes
Text
Temperature Field in a Material Containing Asphalt-Resin-Paraffin Substances in a Microwave Electromagnetic Field-Iris Publishers
Authored by Fatykhov MA*

Abstract
The relevance of the study is due to the need to develop technological and technical solutions of protecting from paraffin and gas hydrate plugs within the pipelines formed under particular thermohydrodynamic conditions. In this regard, this article is aimed at disclosing the features of heating and melting of such plugs using a super-high-frequency electromagnetic radiation source moving within the pipeline. A theoretical study of temperature change within the “pipeline – plug – environment” system, which allows us to fully consider its interaction with the electromagnetic radiation, is the leading method for studying this problem. A mathematical model has been presented and a theoretical study of the plug electromagnetic heating process for heat exchange on the pipe outer surface according to Newton’s law on the hypothesis that the EM transmitter of Н11 type moves, and the achievement of a complicated configuration of thermal sources and temperature has been disclosed in the article. The materials of the article are of practical value for establishing the initial indices of the paraffin plugs removal technology in a pipeline and oil well when exposed to electromagnetic radiation.
Keywords: Electromagnetic waves; Pipeline; Paraffin deposits
Introduction
There is a tendency to increase the share of hard-to-recover oil reserves in the oil industry at this time. Among these are, in particular, deposits with the oils characterized by high viscosity and content of asphalt-resin-paraffin substances (ARPS), deposits with low-permeability terrigenous and carbonate reservoirs, etc. [1]. Natural thermobaric conditions of the deposits are changing during oil recovery process leading to deposition of ARPS on the walls of the wells and rising pipes, in the pumping equipment and aboveground pipelines. Treatment by chemical reagents (inhibitors, demulsifiers, etc.), magnetic and acoustic fields are used for prevention of ARPS deposits. Thermal methods of ARPS removal, in particular, via the injection of hot-oil or solvent reactants, when interacting with which the exothermic reactions occur, are extensively used. Development of technology and method of paraffin and hydrate formation suppression has an interesting history. However, all the difficulties associated with the solution of this problem have not been overcome by now. A variety of conditions for field development and characteristics of the extracted products requires innovative approaches [2]. Based on the model of paraffins or crystalline hydrates formation due to changes in the thermobaric conditions and mechanical adhesion of deposits to the well walls, removal of ARPS and crystalline hydrates is performed either via feeding various reagents that dissolve the deposits (or warm up their zone) into the well, either via downhole heaters or mechanically using scrapers. Some technologies allow removing the deposits even in the absence of circulation inside the pumping and compression pipe (tubing) [3]. In particular, methanol is added to gas flow to prevent the formation of crystalline hydrates in the gas pipe-line. There are a number of special methods along with the general ones. So, for ex-ample, dehydration of the gas being pumped, the method of pressure relief at the pipeline ends, the application of laser irradiation for generation of molecular levels, and the like are used for crystal hydrate plugs formation prevention. Despite their differences, all mentioned methods have a high cost, are difficult to implement or organization of chemicals production, such as methanol that are toxic ones very often, is required to provide the abovementioned. This state of things makes it necessary to look for new, cheaper and safer methods of preventing the formation and destruction of crystal hydrate and paraffin plugs. The results of the studies performed both in our country and abroad point to the fact that one of the most effective methods for protection from ARPS, which is fundamentally different from traditional ones, is the use of high-frequency (HF) and super-high-frequency (SHF) electromagnetic fields (EMF) energy. In this case, heating, which occurs as a result of conversion of the electromagnetic radiation (ER) energy into the internal energy of the medium in the processes of its polarization, is the most significant effect. The method of protecting from asphalt-resin-paraffin substances (ARPS) in the oil producing wells via HF and SHF EMF energy differs in the fact that the well serves both as a tube through which the oil is extracted to the surface, and as a waveguide or a coaxial line along which the EMF energy is conveyed. The efficiency of this process depends on the electromagnetic power within the well. The maximum power is transferred into the well in case of an equality of the generator and well output wave resistances. The well resistance values depend on the values of the dielectric parameters of the media filling the well, the nature of these values as a function of temperature, phase transitions, the structure of gas-liquid mixture, etc. Wellbores and pipelines are transmission lines (coaxial lines, cylindrical wave-guides) for electromagnetic waves from the standpoint of HF electrodynamics. The phase and group velocities of the electromagnetic waves, their damping is determined by the type of the waves, the material of the pipeline walls and the dielectric properties of hydrocarbons.
Having directed the HF power from the external generator to the plug, it can be heated to the paraffin melting or crystalline hydrate decomposition temperature, and thus an obstacle can be eliminated [4-9]. The volumetric nature is an essential advantage of the plugs heating HF method, since the electromagnetic waves in the HF bandwidth can deeply penetrate into the plug material. Besides, the heating process can be controlled via changing the HF generator power level and the electromagnetic radiation frequency, since the dielectric permeability and the loss-angle tangent of the plug material depends on the radiation frequency and temperature [10]. The processes of paraffin plugs heating and melting within the bores of the oil wells and oil pipelines via powerful electromagnetic radiation in the mode of electromagnetic waves continuous generation have been studied in the paper [11]. The times of the end-to-end channel penetration within the plug and the times of its complete elimination have been determined for selected capacities and frequencies of the HF source taking into account the heterogeneity of the HF power distribution along the borehole section and the ohmic absorption of HF power in the metal walls of the well pipes. Since the metal walls are in thermal contact with the paraffin plug, an additional warming up factor of the paraffin plug appears. Considering the plug heating via the steel walls significantly reduces the paraffin plug penetration time in a number of instances, in particular in case of equipping the oil well bore. The melting process proceeds gradually from the well bore central region to the periphery so that the paraffin molten region has a conical shape. The conical shape of the molten zone can lead to destruction of the plug until it is totally melted. A paraffin plug of 100m long is being completely eliminated with HF generator power of 10kW and an operating frequency value of 10 MHz in 34 hours in the considered numerical examples [12] within a coaxial bore of the oil well equipment. When the power was increased up to 20 kW, the time of plug elimination was shortened down to 12 hours. The analysis of the paraffin plugs elimination process in the oil well bore via a HF power source operating in the mode of periodic turning the power on and off (periodic duty) has also been made. It has been shown by the authors of [12] that in this mode the total time of the plug elimination depends very heavily on the HF source power and onoff ratio of its operation. The total time of the plug meltdown increases non-linearly with on-off ratio increase at a specified power of the HF source. The full (total) operating time of the HF source itself is also increasing with the HF generator operating cycle onoff ratio increase. These regularities are explained by the increase in the thermal losses with on-off ratio increase (HF source shutdown time). It has been established that the full time of the source operation (or the energy expended at a specified power) slightly depends on its operating time within the limits of a single cycle. There is a threshold value of on-off ratio, at which a full penetration of the paraffin plug is never achieved. The oil well is a coaxial transmission line in the electrodynamic sense. Due to peculiarity of the TEM wave dispersion within a coaxial line, the operational frequency optimum value, which corresponds to the HF power absorption coefficient value in the plug equal to the plug inverse length, can always be chosen. The oil pipeline can be considered as a cylindrical waveguide capable of transmitting electromagnetic waves with a frequency higher than the cut-off frequency.
There is a strong absorption of HF power and heating of only a narrow area of the plug adjacent to the HF generator on these frequencies. It has been proposed in the paper [11] to use a moving electromagnetic emitter in order to eliminate the paraffin plugs under these conditions. The speed of its movement shall be determined by the velocity of the liquid-solid interface during paraffin plug melting under the influence of HF electromagnetic emission.
The moving velocity of the HF power source and the time for complete elimination of the plug has been determined. It has been demonstrated that the efficiency of the moving HF source, i.e. the energy fraction expended for paraffin plug melting reaches 70% for the selected parameters of the HF source and paraffin plug. The process of HF purification of paraffin deposits within the oil pipeline at an early stage of their formation has been investigated, when the deposits do not clog the oil pipeline yet. Cleaning is fulfilled via a moving HF source. It has been shown that the time of HF frequency cleaning essentially depends on the value and position of the maximum of heat generation power density. The maximum of heat generation power density shifts from the center to the pipeline wall, where the paraffin layer is localized with frequency increase. The magnitude of the heat generation density maximum value is also increasing. Cleaning time decreases accordingly. The dependence of the oil pipeline cleaning time on the thickness of paraffin deposits is significant only for low HF power levels. The initial oil temperature has a small effect on the HF cleaning time. The processes of paraffin plugs heating and melting in the oil well were considered in the paper before [8]. In this case, the model of the HF field homogeneous distribution over the bore cross section was being used. Besides, ohmic absorption of HF power in the wells walls was not taken into account, which would lead to an additional damping of the electromagnetic emission during its propagation and thus to heating of the walls. In fact, the HF power distribution in the cross section is highly nonuniform in the well for the considered electromagnetic waves of TEM type (cable waves). Consideration of the HF power nonuniform radial distribution leads to qualitative and quantitative features of the plug heating and melting in the wellbore [9]. Besides, an additional damping of TEM waves in the well due to HF power losses in the wellbore walls will be taken into account hereinafter. The dissipation of HF power in the steel walls of the pipes leads to heating of the walls. An additional channel for the plug heating appears due to the fact that the steel walls are in thermal contact with a paraffin plug.
A laboratory facility has been developed in the paper [13] and the investigations of paraffin heating and melting under the influence of the electromagnetic oscillations energy in a short-circuited coaxial system have been conducted. It has been demonstrated that, depending on filling of the intratubular space with paraffin or air, the paraffin melting can occur both as a result of its heating by means of thermal conductivity and owing to occurrence of distributed heat sources within the system under the action of the electromagnetic field. The rate of paraffin heating and melting within a coaxial system is much greater in the latter case than in the former case. These regularities are significantly influenced by the paraffin dielectric properties and the electromagnetic properties of pipe materials. The process of paraffin heating and melting occurs in the field of a standing electromagnetic wave formed due to its reflection from the inhomogeneities of the coaxial line pipes surfaces if all else being equal. Thus, the results obtained in these studies confirm the perspectivity of the well electromagnetic treatment method with a view to remove deposits and increase their throughput. Conversion of EM energy into thermal energy occurs within the range of high-frequency (HF) waves most intensively. The issue is how EM energy can be transferred to the medium intended for this purpose. Not any transmission line can transfer EM waves of any frequency. For example, EM energy is transferred through the coaxial transmission line by means of TEM waves wherein there are no restrictions to frequency. There are critical frequencies within the waveguides below which the EM waves cannot be transferred [14]. Let us suppose that a coaxial transmission line is a well in which tubing and a casing may serve as an inner and an outer wire unless they do not touch each other. If they touch each other then the EM energy can be transferred along the tubing internal cavity. In this case, the tubing is a circular waveguide in the electrodynamical term. The oil pipeline and the gas pipeline are a circular waveguide as well. The waves of the E or H type can propagate within a circular waveguide only [14]. If the oil pipeline has a small radius, EM waves of a very high frequency can propagate within it only, which rapidly decay due to strong ab-sorption of EM energy via the medium. Therefore, the medium is being heated extremely nonuniformly. There may be a severe overheating and big losses of heat to the environment surrounding an oil pipeline at some points. On the contrary, there is heating not sufficient for melting the medium at other points. As a consequence, the destruction of the plug can proceed to a shallow depth only. Destruction of ARPD by means of a moving source of HF EM waves – “EM Mole” is possible under these circumstances. In this method, the source of the HF EM radiation moves while the medium melts and the possibility of movement emerges. The destruction of a dielectric plug, which is paraffin, is more effective. The features of such a method have been partially investigated in the papers [11, 12].
Propagation of several types of waves is possible within the waveguide, but not all of them can easily be excited [14]. Especially this is the case of EM wave source to be pushed deep into the pipeline into a molten medium. It is necessary to research all possible options. In this case, an option of H11 wave propagation within the waveguide with the lowest critical frequency has been considered [14]. The features of propagation of such a wave within a waveguide with electrical losses and phase transitions of the media filling the waveguide are not presented in the literature. The studies of the electromagnetic fields application intended for solving oil and gas production problems have been evolving in recent years in the trends highlighted in the papers [15-20]. A numerical study of the paraffin plugs heating and melting process in the oil pipelines equipment via microwave electromagnetic radiation generated by a super-high-frequency electromagnetic wave of the H11 type is simulated and conducted in this paper.
Research Methods
Alkane hydrates and gas hydrates are dielectrics that are characterized by an integrated relative dielectric constant:
ε is the electrical permittivity of vacuum; E,H- the intensities of the electric and magnetic fields, respectively; E0,H0-their amplitudes depending on the spatial coordinates and time, c,ρ ,λ - specific-heat capacity, density and medium thermal conductivity coefficient, respectively in formulas (2) - (4). The appearance of internal heat sources in such a dielectric, while it interacts with HF EMF and, as a consequence, the change in temperature and pressure within it, makes us possible to use the energy of powerful electromagnetic emission in order to decompose paraffin and gas-hydrate plugs being formed in various units of equipment.
By virtue of equation (4) and assuming that hard deposits have fully clogged the pipeline, the thermal conductivity equation shall be solved as follows:
where P is the EM wave source strength.
The differentiation formula [15] has been used in the expression (11):
The problem is being solved numerically by the level set method without an explicit phase separation. The density and thermal conductivity of oil are considered to be independent of temperature, and the heat capacity has a δ-shaped singularity at the phase transition temperature ТS
A coefficient that shows how much the actual absorbed power differs from the power being set is determined, and then the expression (11) shall be multiplied by this coefficient. H is the length of the paraffin plug in the integral.
The boundary conditions were being accepted to solve the equation (5). The convective heat transfer was being set according to Newton’s law at the plug end z=0:
where Т0 – ambient temperature and the paraffin plug initial temperature; k1 – heat-exchange coefficient.
There is no heat exchange at the remote end of the plug z=Н:
The moving velocity of the EM wave source v along the coordinate z was being set as constant and selected so that there were no zones with an unmelted paraffin behind the source (the value v=1.5 m/h was being used in the calculations).
Results
The dependence of the longitudinal wave number z k′′ imaginary part on the EM field frequency is shown in Figure 1 for a cylindrical waveguide with a paraffin plug of the following radius (Figure 1).
The distribution of the thermal sources Q (r, φ, z=0) density normalized to the EM wave power source is shown in Figure 2 in the waveguide cross section for the frequency f=1.4•109 Hz (Figure 2).
The cylindrical coordinates have been converted into Cartesian ones x, y, z for the convenience of image in the figure. In this case, the circular waveguide is represented as a circle inscribed into rectangle. The symmetry with respect to the right and left, upper and lower halves of the waveguide cross section may be noted according to Figure 2. This makes us possible to consider the processes within a quarter of a circle only and have an idea of what is going throughout the circle. Thus, it is possible to save computer
resources in the numerical solution of the problem and consider the processes within the first quadrant only. The results of numerical simulation of a paraffin plug heating and melting process via an “EM Mole” are shown in Figures 3–5 for different moments. When conducting design studies, the following parameters of a high-paraffin crude oil were used: ρ=950 kg/m3; c0=3 kJ/(kg•K); λ=0.125 W/(m•K); L=300 kJ/kg; κ=1.613 W/(m2•K); Nu=1 (pipe in a dry soil); κ1=0.2W/(m2•K); T0=200C; TS=500C; H=5 m; P=6.5 kW;
f=1.4•109 Hz; ε 0′ =2.3; tgδ= 0 0 ε ′′ ε ′ =0.012; σ=3.4•106 Ohm-1•m-1. The problem was being solved by an alternating direction implicit method with a uniform rectangular grid [22]. The delta function in terms of thermal conductivity was being approximated by a step with a half-width equal to 0.40C (Figures 3–5).
Discussion
The critical frequency Н11 of the wave for the considered cylindrical waveguide with radius R=0.0775 m – f0≈0.746•109 Hz. According to Fig. 1, the imaginary part of the longitudinal wave number has a minimum kz′′ ≈0.2874 m-1 on a frequency f≈1.06•109 Hz and grows with a further frequency increase. In this case, the length of the electromagnetic wave penetration into the plug depth is 1.74m, which is sufficient to control the movement of the electromagnetic emitter, although this value is not the matter for this method of paraffin plugs removal. As can be seen from Figure 2, the distribution of heat sources in the waveguide cross section looks like an ellipse because of the dependence on the angle φ. The density of thermal sources also strongly depends on the coordinate r and the stronger the higher the EM wave frequency, i.e. the heat sources distribution in the waveguide cross section is very non-uniform. But this type of wave has an advantage in comparison with the others, i.e. it has the lowest critical frequency, i.e. the deepest heating along the plug may be implemented via it. The maximum of thermal sources is obtained on the waveguide axis, and the thermal sources configuration does not generally depend on the frequency. This also gives an advantage, because the EM wave source is to be located most conveniently at the pipe center. The density of thermal sources falls exponentially lengthwise. The rate of decrease in the heat sources density increases based on the dependence with the frequency increase in the longitudinal direction shown in Figure 1. “EM Mole” began to move in 135 minutes after start of the heating process in Figure 3-4. All values along the coordinate r have been multiplied by 100 in Figure 4 & 5 for convenience of image. As can be seen from the figures, the medium heating process depends heavily on the thermal sources density distribution. The location of the plug initial penetration is completely determined by the peak density of the thermal sources. The temperature distribution in the transverse direction due to medium thermal conductivity and the temperature distribution in the longitudinal direction owing to movement of the “EM mole” becomes more uniform as time goes by. The “EM mole” movement has to be started long period after start of heating time for the sake of melting the plug across the whole pipeline section.
Conclusion
The process of a paraffin plug removal via one of the possible types of waves, which can be excited in a circular waveguide H11, has been considered. The surface separating the solid and liquid phases has an ellipse shape with a cross section decreasing along the plug. Such a shape of a molten zone can lead to destruction of the plug until it is fully melted. If we set a goal of making a hole in the plug along its whole length in order to start oil transportation as soon as possible, rather than melting it all along the entire pipeline’s radius then movement of the “EM mole” can be started much earlier and moved faster. The studies conducted in the present paper have shown that the electromagnetic radiation source must be moved along the pipe at a velocity to be self-consistently determined based on the law of motion of the interfacial area between the solid and liquid phases in order to remove the paraffin plugs within a pipeline via it. The issues considered in this paper are also of scientific and practical interest for solving the problems associated with gas hydrates [23-25], high-viscosity oils and bitumen’s [26-29].
Read More...FullText
For More Articles in Current Trends in Civil & Structural Engineering please click on https://www.irispublishers.com/ctcse
Indexing List of Iris Publishers: https://medium.com/@irispublishers/what-is-the-indexing-list-of-iris-publishers-4ace353e4eee
Iris publishers google scholar citation: https://scholar.google.co.in/scholar?hl=en&as_sdt=0%2C5&q=irispublishers&btnG=
#IrisPublishers#iris publishers llc#Current Trends in Civil & Structural Engineering#Electromagnetic waves#Paraffin deposits
1 note
·
View note
Text
An excerpt from the zoological text The Hunter’s Encyclopedia of Animals (First Edition).
Chapter VI: Plesioth
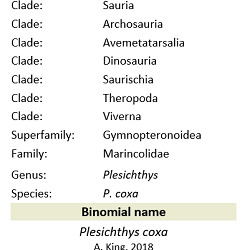
The plesioth (Plesichthys coxa) is a species of pelagic wyvern found off intertropic coasts across the globe. At a weight of 4.7 tons and a length averaging 26 meters, it contends for the title of largest marine predator. The plesioth’s physiology is adapted to a life spent transitioning between land and water — it is capable of diving to depths of 450 meters at speeds of 54 km/h (34 mph), and remaining submerged for 40 minutes at a time. The plesioth’s ability to fly was forfeited early in its evolutionary history, replaced by adaptations that allow it to withstand extreme deep-sea pressure and low concentrations of dissolved O2. Its vestigial wings, meanwhile, underwent exaptation and have been jury-rigged into fin-like appendages that assist in swimming. According to one study, the plesioth’s lifespan is approximately 50 years.
The plesioth has few natural predators as a result of its venomous spines. Laterally-visible, horizontal orange stripes advertise the neurotoxin to any potential predators. Every so often, juveniles are susceptible to predation by sympatric predatory megafauna. In addition to its aposematic coloration, the plesioth can ward off predators by forcefully ejecting a fluid from a pair of glandular sacs inside its mouth. This liquid projectile can be accurately sprayed as far as 5 meters (16 feet). The fluid is miscible in water, and therefore exclusively used on land. Both of the aforementioned adaptations are utilized as antipredator mechanisms and have no function in hunting. Rather, the plesioth is an ambush predator that kills its prey through a combination of stunning (tail-slaps, high-velocity breaches) and drowning. Countershading obliterates its outline in the water, with its dark dorsal scales making it inconspicuous to animals looking down on it from above. The bulk of its diet is comprised of fish, and as the plesioth matures it begins to incorporate larger prey species such as pinnipeds, pseudophids, and ornithischians. Because of the plesioth’s moderate fecundity and wide distribution, its conservation status is classified as least concern.
The plesioth has a recurring presence in the cultures of seafaring people. Although it doesn’t actively hunt humans or wyverians, plesioths have been known to follow ships at a distance. They scavenge on bycatch and waste jettisoned from vessels, and occasionally raid nets and fishing lines for an easy meal. As a consequence of conditioning them to associate boats with food, plesioths are the most likely culprits of attacks on shipwreck victims. Their ghostly white, translucent third eyelids, in conjunction with their habit of congregating near sunken ships, may have influenced the myth of plesioths being psychopomps. A number of equatorial communities honor the plesioth through week-long ceremonies and parties. Such festivals are accompanied by the custom of mounting a plesioth’s skull or severed head on an ornately-carved pole, not unlike a Mari Lwyd. Anthropologists speculate that a misunderstanding led to the belief that the mounted head was actually a hammer. Traditional dishes include a ceviche marinated in citrus, and rotten flesh fermented in lactic acid. In medicine, the plesioth’s venom has potential as an anesthetic and a pharmaceutical drug for treating insomnia.
Other names for the plesioth include the plesio, water wyvern, and shark wyvern. The latter is a title it shares with the cephadrome (Selacharena alata) and anorupatisu (Pristocephale glaciesecans).
The plesioth’s name is an example of semantic drift. The word is originally derived from the clade Plesiosauroidea, a group of long-necked marine reptiles. Plesiosaurus is a compound of the Greek words plēsíon “near” and saûros “lizard,” and refers to the group’s resemblance to limbed squamates. Over time, the prefix plesio- was recontextualized to have the meaning “like or similar to a plesiosaur.” Thus, the plesioth was named for its resemblance to plesiosaurs, and was assigned the suffix -ioth to maintain the naming convention already established in the common names of other animals (like the lavasioth and epioth). Ironically, the genus Plesichthys is a portmanteau of plēsíon and ikhthús “fish,” and was named for the plesioth’s near fish-like appearance.
Taxonomy and evolution
Fossil evidence suggests that the plesioth evolved from a unique lineage of diving wyverns 10 million years ago. Unlike other vivernans of that period, the plesioth’s ancestor Marincola marincola [†] was semiaquatic, roosting in small colonies on seaside bluffs. Its streamlined body reduced drag when plunging from flight, allowing it to hit the water at breakneck speeds exceeding 80 km/h (50 mph). Air sacs in the face and chest cushioned the impact, a feature which was later lost in its descendant (along with skeletal pneumaticity). The ancestral plesioth moved underwater via foot propulsion, with the wings used for steering. Today P. coxa primarily swims using a combination of its webbed feet and an undulatory locomotion reminiscent of BCF (body-caudal fin) swimming. A comparison of the foot morphology between the holotype M. marincola and modern gannets supports the diving → swimming transition theory, and proposes a convergence amongst semiaquatic theropods.
While the plesioth shares a common ancestor with flying wyverns, it has a long history of genetic independence from its closest relatives (raths, khezus, and other vivernans). Molecular systemic DNA research places the plesioth in a basal lineage of gymnopteronoid.
Subspecies
There are only 2 extant representatives of the family Marincolidae. Each subspecies is characterized by scale coloration, distribution, circadian rhythms, and preference for hunting techniques.
The oil-backed plesioth, or informally simplified to oil-back (P. c. coxa), is the nominate subspecies. Its range encompasses the subtropic and tropic coastlines of the West Dragon and East Dragon Oceans, and the interior seas of South Elde: Jyuwadore, Shikuse, and Moga. It inhabits seagrass meadows, kelp forests, coral reefs, and coastal alcoves which have a water temperature between 13°C and 29 °C (56°F and 85°F). Although P. c. coxa is active during the day it is primarily a crepuscular predator, and has greater success at hunting during the hours of dusk and dawn. It gets its name from the appearance of its dark blue scales when seen in clear water with low turbidity; the contrast gives it a resemblance to “an oil spill come to life.”
The green plesioth (P. c. viridis), unlike P. c. coxa, dwells in brackish ecosystems, including wetlands, swamps, and estuaries. They typically avoid venturing out into saltwater, although fishermen have reported seeing them as far as a mile from the nearest coast. It’s generally accepted that the presence of green plesioths in mangrove swamps (near Jumbo Village) and river mouths (like those of the Metape Jungle and Flooded Forest) reduces competition with the oil-back. P. c. viridus takes advantage of its green pigmentation by concealing itself amongst hydrophytic plants such as water lettuce and duckweed. Perhaps because of its greater reliance on camouflage, this diurnal subspecies almost never breaches when hunting.
Characteristics
Physical description
As a member of the clade Viverna, the plesioth’s body plan is largely representative of the wyvern archetype: a bipedal stance and horizontal posture with the tail held parallel to the ground. Where the skeletal structure differs is in the wings. While the thumb in other wyverns is short and supports the leading edge of the wing, all of the plesioth’s metacarpals and phalanges are elongated and involved in supporting the membrane. The pleated patagium can be tucked against the plesioth’s torso while swimming, thereby reducing surface area and contributing to its streamline, hydrodynamic shape. The wings range in color from white to cream, with orange spots on the outer edge of the dactylo- and iliopatagium. The backside of the torso and head are deep blue, while the underbelly features white scales. The ventral and dorsal regions are sharply delineated by lateral orange stripes that run from the conical snout to the tail along the frontal/coronal plane. Imbricate, ovate scales flow down the body in a head-to-tail configuration that allows for a smoother flow of water over the body to reduce drag. Their visual and functional similarity to cycloid scales on teleosts is homoplastic. The feet are totipalmate.
The plesioth partly owes its charismatic appearance to its white red-tipped semifins. The semifins are webbed structures supported by cartilaginous spines, attached to an endoskeletal base with associated muscles for movement. Being cartilaginous makes the semifins flexible and allows them to flare or collapse against the body. They are classified according to location on the body: dorsal, supercaudal, subcaudal, cranial, tarsal, and pseudopercular. The semifins’ spines are the site of venom conduction.
When submerged, the palatal valve at the back of the mouth creates a watertight seal which barricades the esophagus and trachea. This enables the plesioth to seize prey underwater without drowning, although it has to return to land in order to eat. When hunting, its cone-shaped, slightly recurved teeth allow it to tear through small and medium-sized fish. The carinae (edges of the teeth) are finely-serrated with denticles on the front and back, suited for biting prey outside of an exclusively piscivorous diet. The dentary and premaxilla/maxilla hold 36 teeth that are more densely-packed toward the front of the jaw, and that decrease in size toward the back of the mouth. During attacks, the nictitating membrane is drawn across the eye to protect it from abrasions.
The loss of tyrosinase function results in a genetic mutation called amelanism. Colloquially known as seabream plesioths (after fish in the genus Pagellus), individuals with this pigmentation abnormality don’t produce melanin and have white in lieu of their typical aegean coloration. Because the mutation only disrupts melanocytes, the chromatophores responsible for their orange and iridescent properties — erythrophores and iridophores — are still expressed. The continued production of light-reflecting and carotenoid pigments is what gives the seabream plesioth is distinctive white and reddish-orange look.
Venom
In total, the plesioth has 31 spines distributed across its body. They form part of the semifin, which occurs either in symmetric pairs, or along the medial region of the body. Although the semifins are superficially reminiscent of the ray-fins found in actinopterygians, they aren’t homologous. Semifins are classified into 6 categories according to body region, with the following spine distribution: 4 cranial, 8 pesudopercular, 7 dorsal, 4 tarsal, 4 subcaudal, and 4 supercaudal. The largest spines measure at 7’ 4” (2.2 meters) and are more than capable of penetrating the skin of the largest marine animals.
The primary structural element of the spines is cartilage, a supple and elastic tissue comprised of a dense network of collagen fibers embedded in a gelatinous ground substance. Its composition gives the spines tensile strength, enabling them to resist changes in weight and pressure while possessing greater flexibility than bone. Because cartilage is an aneural, avascular tissue, spines cannot be regrown if they’re damaged or removed. A protective integumentary sheath obstructs the opening of the spine. During envenomation, the sheath is pushed back as it enters the attacker. This process compresses the venom gland at the base of the spine, and allows the venom to diffuse into the puncture wound by travelling through shallow grooves in the now-exposed spine.
It’s thought that the semifins originally evolved as accessories for swimming, and that venom acquisition was a supplementary feature. The plesioth’s venom glands produce a subgroup of neurotoxins known as hypnotoxins, a soporific venom that depresses the central nervous system and affects the neurotransmitter gamma-aminobutyric acid (GABA) at the GABAA receptor. Its symptoms are much like the effects of anesthesia, and can be divided into the same 4 stages of the Guedel’s classification: induction, excitement, subconsciousness, and overdose. At Stage 1, the victim progresses from analgesia without amnesia to analgesia with amnesia. It’s entirely possible that the lack of pain — coupled with memory impairment — can lead to the victim’s inability to recall the initial sting and recognize that they are in danger. Stage 2, arguably the most dangerous, is when life-threatening conditions occur, such as delirium, arrhythmia, vomiting, respiratory distress, pupillary dilation, and spastic movements. Species that lack gills can quickly become disoriented after envenomation and drown as a consequence of the respiratory system becoming compromised (through pulmonary aspiration, apnea, et cetera). Stage 3 is the cessation of the previous symptoms and the onset of subconsciousness. Branchial predators become incapable of pursuing the plesioth, while air-breathing predators at this stage are all but 100% guaranteed to drown. Stage 4 is incredibly rare, and usually occurs if the spines puncture the victim for a long enough duration, or if multiple spines are involved in envenomation. Overdose results in brainstem or medullary depression, followed by complete respiratory and cardiovascular arrest. Without medical intervention this stage is always fatal.
Additional health risks posed by envenomation include: pieces of the spine breaking off and embedding themselves in the wound, leading to infection; and anaphylactic reactions to the venom.
Water-spitting
Before the plesioth’s phylogeny was properly understood, a common misconception was that P. coxa had gills and was descended from an unknown clade of branchial tetrapods. Its ability to spit a high-pressure jet of water from its mouth was likened to various species of archerfish. Later studies proved that the plesioth is a theropod, which made the archerfish’s mode of liquid projectile an impossibility as it involves contracting the opercula (gill covers). Dissection and field observations led to the discovery of paired sacs at the back of the mouth. Dubbed the paralingual glands, these poorly-understood organs can expel up to a quart (32 ounces) of liquid at once and possess just enough of the chemical for 10 discharges (2.5 gallons’ worth), before the glands have to produce a new supply over the next fortnight. The expulsion release is controlled by muscles behind the jaws. There is insufficient data as to what the liquid is composed of, but preliminary chemical analysis suggests a high presence of hydrogen and oxygen.
Diving adaptations
Even though the plesioth is most frequently observed inhabiting the photic layer (the uppermost layer of the pelagic zone, 0 m — 200 m), it can also be found within the mesopelagic layer (200 m — 450 m). At these depths, pressure can be greater than 40 times that of the surface. A combination of stressful deep-sea conditions such as high pressure and low oxygen can cause mechanical barotrauma. To eliminate the risks of physical damage like decompression sickness and organ rupture, the plesioth’s bones became depneumatized. The loss of postcranial air-sacs in the skeleton makes the plesioth denser and prevents embolisms (from buildups of dissolved N2) by decreasing the total air volume in the body. Similarly, the presence of air-filled pockets in the skeleton would have increased buoyancy, a trait that would have been disadvantageous to a diving animal.
Enhanced anaerobic capacity and hypoxemic tolerance are essential for facilitating long dives. When submerged at certain depths, the heart rate is reduced to as low as 20 — 30 bpm. Bradycardia occurs when the plesioth exceeds its aerobic dive limit (ADL), at which point tissue perfusion and oxygen uptake are decreased in order to preserve respiratory and blood oxygen stores. Non-essential organs are shut down and muscles are isolated from circulation, which together cut down on oxygen depletion and extend dives for as long as 40 minutes. Hemoglobin in plesioths shows high cooperativity with oxygen, a phenomenon whereby the binding of one molecule of oxygen with hemoglobin facilitates the binding of the next oxygen molecule and so on up to binding four oxygen molecules by one hemoglobin. The degree of cooperativity hemoglobin has is expressed by the Hill coefficient, which is estimated to be well above 4 in P. coxa. High cooperativity increases the efficiency of the oxygen delivery to tissues. Without these traits, the plesioth wouldn’t be able to withstand the extreme demands placed on its respiratory and circulatory systems that would otherwise result in unconsciousness.
To compensate for diminished olfaction and the mesopelagic layer’s low visibility, the plesioth has evolved powerful visual acuity. Its emmetropic eyes possess a flattened cornea that makes the cornea’s refractive power in air and the corneal power loss in water negligible. Roughly 10% of the eyes’ refractive power is contributed by the cornea, unlike in humans, which contribute up to 70%. Instead, the lens performs the majority of the focusing. This feature minimizes the optical effect of submergence. Sharp images above and underwater are formed by plesioths changing the shape of the lens through muscle contractions.
Behavior
Intraspecific interactions
Plesioths do not routinely seek out conspecifics outside of the breeding season. When plesioths do encounter others in the water they tend to ignore each other, though they demonstrate a remarkably high tolerance for each other’s presence. Socialization isn’t unheard of, however; plesioths may engage in cooperative hunting behavior if two or more are pursuing the same target. Juveniles and subadults will sometimes swim in small bands of three as an added precaution against predators.
Hunting and diet
The plesioth is a predominantly piscivorous animal, with 60% of its diet featuring a large diversity of fish species that are obligate shoalers. Despite this, they are not fastidious in their food choice and readily vary their prey selection according to availability, as evidenced by the remains of other animals found in their stomachs and fecal matter. Juveniles are restricted to hunting fish and other small vertebrates, and only begin to diversify their diet around the age of three. Mature adults are slightly more opportunistic, having the required size to take on larger non-fish prey items. A 30-kilo (66 lbs) meal can sustain a plesioth for up to 5 to 9 days before it is required to hunt again. Scavenging on carcasses isn’t overly common, nor is venturing inland to hunt. Plesioths only go after terrestrial prey when it’s near the water’s edge and within striking range. There are three generally-accepted hunting tactics employed by plesioths, with a slight skewing of preference between the subspecies: ambush-drowning, breaching, and tail-slapping.
The preferred method of taking down non-aquatic animals involves the plesioth motionlessly dwelling along the waterfront. The blue (P. c. coxa) and green (P. c. viridis) dorsal coloration is cryptic for each subspecies’ respective habitat. Concealment allows the plesioth to remain undetected long enough for it to ambush prey. Its conical, recurved teeth are suited for preventing prey from escaping once it seizes them in its jaws. The blinding speed with which it strikes gives the plesioth enough time to drag its prey into deeper water, where it then holds it beneath the surface until it succumbs to a combination of exhaustion, blood loss, and oxygen deprivation.
Breaching is a tactic reserved for animals such as epioths, ludroths, and seals, and is almost exclusively seen in P. c. coxa. The oil-back slams into prey from the deeper water below, with the momentum often taking it partially or fully clear of the water (achieving a max height of 10 meters). At speeds of 54 km/h, the g-force behind the impact is sufficient enough to fully stun prey.
The final hunting strategy is a tail-slap deployed either overhead or sideways. A kinematic study of plesioths attacking bait balls found that the tail-slap occurred with such force that it caused dissolved gas to diffuse out of the water column, forming small bubbles. Due to acceleration of waterflow around the leading edge of the tail, turbulent pressure drops below the saturated vapor pressure, causing the aforementioned plume of bubbles. The associated shockwave is powerful enough to immobilize as many as 20 fish in one tail-slap, which cuts down on the energy costs of hunting active prey.
The diet of P. c. coxa includes a wide array of aggregating fish such as pin tuna, speartuna, glutton tuna, Moga tuna (Katsuwonus katsuo), knife mackerels, wanchovies, sardines, and blue cutthroats. Oil-backed plesioths may sometimes take medium-sized sharks (most commonly Centrinis armatus). Epioths (Cetuserpens repandus and Pseudophis nitidus), immature ludroths (Harpaga leo), and island narwhals (Monodon mysticus) are hunted in deeper waters. Qurupecos (Cantio sirenius) that fish along the shore and passing aptonoths (Parasaurolophus cristatus) are known to have been attacked as well.
The diet of P. c. viridis contains a variety of freshwater and euryhaline fish such as gajuas (Palustincola ferox), fen catfish (Palustincola gravis), silverfish, red-finned arowanas (Osteoglossum esculentum), and burst arowanas (Osteoglossum authothysia). The green plesioth’s proximity to biodiverse terrestrial ecosystems allows it to feed on animals such as slagtoths, immature ludroths (Harpaga blattea), otters, bullfangos (Ossispina taurus), epioths (Pseudophis esmeraldus), congas (Flovorator altilis), and assorted frog species.
Enemies and competitors
Very few attacks made on the plesioth are successful, and are only perpetrated by a handful of species. The venom glands are active at birth and even juvenile plesioths are capable of delivering a potent sting to would-be attackers. Nevertheless, there have been a few documented cases of immature plesioths being killed and consumed by sharks and adult ludroths. The remains of adult plesioths found in the digestive systems of lagiacrus (Heres jormungandrii), pliosaurs, and large placoderms suggests that these predators are capable of hunting them. A counterargument often made in response is that these remains are not the result of active predation, but rather scavenging on the carcasses of plesioths either adrift in water or washed up on shore.
Resources such as nesting sites are highly competed for. The caves and abandoned cliff dwellings of Moga in particular are sought after by both P. c. coxa and H. leo. As a conflict-avoidant organism, plesioths go to extreme lengths to ward off predators and rivals through complex agonistic signaling such as wing-flapping and stomping. If these threat displays fail, the plesioth may discharge a warning shot with its paralingual glands. Plesioths will only retreat and abandon a nest if it’s unoccupied by eggs or chicks, or if there are a significant number of intruders. The culprits behind nest raids are immature royal ludroths and jaggis (Magnaraptor ebrius) for P. c. coxa, and immature purple ludroths and wroggis (Magnaraptor paluster) for P. c. viridis.
Attacks on hunters
To date, there is still a lack of consensus over whether or not attacks on humans, wyverians, and lynians are motivated by predatory intent. While there is evidence to suggest a correlation — as testified by shipwreck survivors that watched plesioths bite passengers in the water — it could be possible that the plesioths are drawn by the sounds of struggling, and are merely exploiting an otherwise unusual opportunity to feed. Outside of narrow circumstances like capsizes and founderings, plesioths don’t actively engage people. Most hostile encounters appear to be the result of provocation by people, whether intentional or accidental. Divers that were unaware of their surroundings ,or that deliberately approached the animal, either spooked it or provoked it into envenoming them with its flared semifins. Spear-fishers have reported accounts of theft, where an emboldened plesioth (typically a juvenile or subadult) stole fish off the end of the spear tip but didn’t try to attack the person holding the equipment. On average, there are 10 deaths associated with plesioths every year, with 8 being attributed to envenomation and 2 to bites. This number excludes fatalities of hunters under the employment of the Guild, whose careers necessitate engaging these animals for the sole intent of combat.
Immunologists studying the venom of P. coxa have dispelled the myth that injections in successively larger doses can achieve mithridatism.
Reproduction and life cycle
Each spring, male plesioths return to the area where they hatched as chicks to participate in a lek. These yearly aggregations commence the start of the breeding season, in which males vie for mates through courtship displays. As many as 25 to 30 individuals — each guarding a territory a few meters in size — occupy the lek mating arena, which consists of shallow cliffs and the adjacent water. Competition manifests in the form of elaborate diving and breaching rituals, meant to demonstrate fitness and overall health to the observing females. Preferential selection by the female results in the formation of monogamous pair-bonds that only last for the duration of the spring and summer. After copulation, the pair retreats to land where they scrape out a saucer-shaped depression in the ground. If the materials are available, plesioths may line the perimeter of the nest with debris, vegetation, stones, shells, or driftwood. A clutch can contain up to 4 eggs, which are monitored and incubated in shifts by both parents until they hatch around 26 days. The eggs are buff, cream, or brown, marked with streaks or blotches of brown or gray to camouflage them. Plesioths that are unable to secure a nest site beneath an overhang or within a cleft must contend with the heat. On hot days, the brooding parent may dive into the water to wet its body before returning to its eggs, thus regulating the temperature. The nest site is defended by the mate that isn’t preoccupied with tending to the eggs or hatchlings. Intruding conspecifics are usually chased off from individual nest sites, while wandering chicks are tolerated. All of the adults in the colony will collectively repel potential predators.
Hatchlings are altirical, and have minimal motor coordination and thermoregulatory capacity. Over the next 12 weeks they undergo rapid development while under the care of their parents. They are fed a protein-rich diet of fish and are presented with suitably-proportioned stones to swallow. These stones become the young plesioths’ first gastroliths, which serve as ballast. By the twelfth week, the chicks are developed enough to now accompany their parents on hunting expeditions. At the onset of autumn and the end of the breeding season, the mated pair departs, as do the now-independent offspring.
Health
Diseases and parasites
The plesioth is a host for epibionts and ectoparasites across multiple taxonomic divisions. Some organisms — like algae and barnacles — have a minimal impact on the wellbeing of the plesioth, and only inconvenience it by increasing hydrodynamic drag. Other organisms that anchor themselves to the plesioth’s body have measurably more harmful effects. Isopod larvae of the family Gnathiidae have serrated, piercing mouthparts, including a pair of toothed mandibles and maxillules, grooved paragnaths, and strong maxillipeds. They feed on blood and tissue fluids at the site of attachment, and are transmission vectors for protists of the phylum Apicomplexa (haemogregarines) which parasitize red blood cells. Sea lice cause abrasion-like lesions on the skin as a result of physical and enzymatic damage. Feeding on epidermal tissue and blood creates a generalized chronic stress response in the plesioth. Monogenean flatworms use attachment organs called haptors, which are specialized structures in the shape of hooks and clamps that adhere them to the host. Infestations on the skin can cause lethargy, infection, scale loss, and respiratory distress.
To rid itself of hitchhikers, the plesioth solicits help from fish at cleaning stations. In a cleaning symbiosis, cleaner fish gather in conspicuous areas and advertise their services through bright hues and stripes. Convergent patterns/colorations amongst different cleaner species reinforce their recognizability to clients, a phenomenon known as Müllerian mimicry. When the plesioth approaches one of these stations it opens its mouth and flares its semifins to signal that it needs cleaning. Wrasses, tangs, and neon gobies maintain the health of the plesioth by removing dead flesh and parasites from its skin, nostrils, and mouth. The relationship is a mutualistic service in that the cleaners are provided a free meal without the threat of predation from the client, and the client is ridden of ectoparasites.
Outside of these accepted congregation sites plesioths have to rely on other means for treating their parasites. Remoras and pilot fish can usually be found in the company of P. coxa. In the case of the former, they are suctioned onto its body by a modified dorsal fin comprised of slat-like flexible membranes. Both groups of fish associate themselves with plesioths for not only protection from other predators, but for the particulate matter left over from the plesioth’s meals, and its nutrient-rich feces. In exchange for tolerating the presence of both species, the plesioth benefits from the removal of ectoparasite and loose flakes of skin.
Distribution and habitat
Plesioths are a common sight in the waters of the Moga Archipelago. The abandoned ruins that sculpt the cliffs are prime nesting grounds for them. The leeward side of the Deserted Island (the largest isle in the chain) is sheltered from the prevailing wind by the area’s elevation, making the ruins above the alcoves and beaches comfortably dry. The islands’ coral reefs and sunken ships teem with prey capable of supporting large numbers of plesioths. The nearby island of Tanzia is similarly rife with the habitats and resources needed to support them, but strangely, plesioths avoid the waters outside of the harbor. It’s thought that the hydrothermal vents and geothermal activity in the Tainted Sea exceed P. coxa’s temperature threshold. Other well-known plesioth congregation sites include Cheeko Sands and Sunsnug Isle.
A popular rumor that continues to circulate (much to the chagrin of the International Hunters’ Guild) is that there exists a colony of oil-backed plesioths in the Dede Desert. Allegedly cut off from the ocean by an isolated river system, these plesioths are believed to have acclimated to the biological, geological, and meteorological properties of their new environment. To date, no evidence exists of plesioths managing to venture upriver and permanently establish a colony there. More than likely the idea was proposed by travelers that were hallucinating as a result of heat exhaustion and dehydration. It’s possible that what looked like a plesioth lifting its head above the water was actually a piece of debris or a branch, making its origins a case of mistaken identity. Another more credible theory is that a cephadrome was somehow mistaken for a plesioth. Despite assurances from the scientific community that a plesioth couldn’t travel hundreds of miles from the sea and survive in a desert climate, dozens of undeterred hunters and explorers make the dangerous expedition each year in search of proof.
#monster hunter#monster hunter thought dump#plesioth#zoology#the hunter's encyclopedia of animals#speculative biology#my posts#i speak#mh dossier
146 notes
·
View notes
Text

The Science Research Manuscripts of S. Sunkavally, p 813.
#free fatty acids#toxicity#mitochindria#Red Sea algae#distribution of molecular velocities#lions#bipedalism#ichthyosaurs#bubble formation#France#feasts#hypothermia#indigestion#specific dynamic action#air#lubrication#satyendra sunkavally#theoretical biology#manuscript#cursive handwriting#notebooks#diaries
0 notes
Text
What Are Teaching Models In Mathematics?
Mathematics is not only a subject but it is the language with some different symbols and relations. Mathematics simplifies all the things easily but in different manner. Math teaching models are just like a bridge which associates mathematics with real life event or a problem. The basic purpose of those models is how to make mathematics education interesting and students enjoy doing mathematics, not only for their academic progress but discovers new tricks, methods and mainly they can be able to relate all the math problems or content of text book to real life problems.
Education defines mathematical modeling as a way of solving problems in the maths and science, if modeling is carried out taking into account the real characteristics of the processes or systems that are being modeled.

The difference is that mathematical modeling can be part of Realistic Mathematics Education (RME) is a domain-specific instruction theory for mathematics. In other words, it is hardly possible to educate mathematical modeling by itself, since it is most often associated with an understanding of processes and systems studied in other sciences (physics & etc.).
Therefore, RME is an innovative learning approach that emphasises mathematics as a human activity that must be associated with real life using real world context as the starting point of learning.
Maths teaching models or mathematical modellings are used in the natural sciences (such as physics, biology, earth science, chemistry) and engineering disciplines (such as computer science, electrical engineering), as well as in non-physical systems such as the social sciences (such as economics, psychology, sociology, political science).
Mathematical models can take many forms, including dynamical systems, statistical models, differential equations, or game theoretic models etc. Mathematical models are of different types:
Linear vs. nonlinear:- If all the operators in a mathematical model exhibit linearity, the resulting mathematical model is defined as linear. A model is considered to be nonlinear otherwise. The definition of linearity and nonlinearity is dependent on context, and linear models may have nonlinear expressions in them.
Static vs. dynamic:- A dynamic model accounts for time-dependent changes in the state of the system, while a static model calculates the system in equilibrium, and thus is time-invariant. Dynamic models typically are represented by differential equations or difference equations.
Explicit vs. implicit:- If all of the input parameters of the overall model are known, and the output parameters can be calculated by a finite series of computations, the model is said to be explicit. But sometimes it is the output parameters which are known, and the corresponding inputs must be solved for by an iterative procedure, such as Newton's method or Broyden's method. In such a case the model is said to be implicit.
Discrete vs. continuous:- A discrete model treats objects as discrete, such as the particles in a molecular model or the states in a statistical model; while a continuous model represents the objects in a continuous manner, such as the velocity field of fluid in pipe flows, temperatures and stresses in a solid, and electric field that applies continuously over the entire model due to a point charge.
Deterministic vs. probabilistic:- A deterministic mathematical model is meant to yield a single solution describing the outcome of some ""experiment"" given appropriate inputs. A probabilistic model is, instead, meant to give a distribution of possible outcomes.
Deductive, inductive, or floating:- A deductive model is a logical structure based on a theory. An inductive model arises from empirical findings and generalization from them. The floating model rests on neither theory nor observation, but is merely the invocation of expected structure.
The creation and use of maths teaching models can help students develop new concepts or relationships and make connections between symbols and concepts. Because different models show different aspects of the maths and science concept. Through model, students can express how they understand the mathematical concept or relationship.
Syndication URL on What Are Teaching Models In Mathematics?
1 note
·
View note
Text
Molecular and Atomic Clouds Associated with the Gamma-Ray Supernova Remnant Puppis A. (arXiv:2206.00211v1 [astro-ph.HE])
We have carried out a study of the interstellar medium (ISM) toward a shell-like supernova remnant SNR Puppis A by using the NANTEN CO and ATCA HI data. We synthesized a comprehensive picture of the SNR radiation by combining the ISM data with the gamma ray and X-ray distributions. The ISM, both atomic and molecular gas, is dense and highly clumpy, and is distributed along the northeastern edge of the SNR shell. The CO distribution revealed an enhanced line intensity ratio of CO($J$ = 2-1)/($J$ = 1-0) transitions as well as CO line broadening, which indicate shock heating/acceleration. Further, the velocity distribution of CO and HI shows signs of expansion at $\sim$10 km s$^{-1}$ in the receding part of the shell. The ISM interacting with the SNR has large mass of $\sim$10$^{4}$ $M_{\odot}$ which is dominated by HI, showing good spatial correspondence with the Fermi-LAT gamma ray image. This favors the hadronic origin of the gamma rays, while additional contribution of the leptonic component is not excluded. The distribution of the X-ray ionization timescales within the shell suggests that the shock front ionized various parts of the ISM at epochs ranging over a few to ten 1000 yr. We therefore suggest that the age of the SNR is around 10$^{4}$ yr as given by the largest ionization timescale. We estimate the total cosmic ray energy $W_{\rm p}$ to be 10$^{47}$ erg, which is well placed in the cosmic ray escaping phase of an age-$W_{\rm p}$ plot including more than ten SNRs.
from astro-ph.HE updates on arXiv.org https://ift.tt/Yg46cjA
0 notes
Text
Summary: Bussi et al. (2007)
In this post I am going to summarize the article Bussi, G., Donadio, D., Parrinello, M. (2007). Canonical sampling through velocity rescaling. The Journal of Chemical Physics, 126. In this article the authors propose a novel temperature control system, or thermostat, for molecular dynamics simulations, which has later become known as stochastic velocity rescaling.
The authors begin by summarizing the earlier work on different types of thermostats. Their work seeks to remove some of the shortcomings of the earlier thermostats. In particular, it is presented as an alternative to the popular Nosé-Hoover thermostat, which, while being powerful, is not the most elegant one and requires some care in its implementation. The proposed method extends the so-called Berendsen thermostat, which is a rather simple and also widely used method, but does not produce quite correct physical properties.
The basic idea behind velocity rescaling methods is straightforward. All the velocities of the particles in the simulation system are scaled by a factor that keeps the total kinetic energy of the system close to the value corresponding to some fixed temperature. Even this simple algorithm is useful for large systems, where small fluctuations of energy become insignificant. However, for small systems of few particles, where energy fluctuations are large, such method does not reproduce correct physical properties. The authors propose an alternative approach, in which the velocities are not scaled to exactly match the wanted temperature, but rather a random value around it, corresponding to the actual energy fluctuations of the system. The word "stochastic" refers to this random choice of scaling factor.
Such procedure is sufficient to produce correct distribution of velocities, but the random assignment of velocities disturbs the individual particles' trajectories considerably. Therefore the authors seek to further develop the method to produce more realistic trajectories by basing the selection of the next value of the scaling factor on the current one. In this approach, a control parameter is introduced that determines the time scale of the velocity variations. This way the scaling of the velocities can be made smoother.
An important factor in molecular dynamics simulations is the choice of simulation time step. To quantify the suitability of a time step ways are needed to monitor the time development of the system. These are dependent on the thermostatting procedure used. To achieve this the authors propose a quantity they call effective energy, which has no direct physical meaning, but is a conserved quantity when the time step is short enough. By monitoring its value, a proper choice for a simulation time step can be obtained.
The authors then compare the performance of their thermostat against Nosé-Hoover and traditional Berendsen thermostats by simulating argon and water in liquid and solid phases. It is noted that the energy fluctuations of the systems under the proposed thermostat is fairly independent of the choice of the control parameter, whereas Nosé-Hoover thermostat is sensitive to choice of parameters. The thermostat is also shown to produce vibrational modes of a hydrogen atom and the diffusion coefficient of water in good accordance with literature values.
ALMS progress: reading 50 min, text 1 h 40 min, total 2 h 30 min
68 h 35 min
0 notes
Text
Astronomy Notes 4/17/19
For context
When I was at a community college, I was a volunteer note taker for a student in my class thru the accessibility center. I didn’t know who the student was or why they needed someone to take notes for them to respect their privacy, but it was a really cool experience knowing that my notes might help another student learn. While I don’t think someone would try to plagiarize my notes, I figured I’d go ahead and upload them all here anyways. Maybe someone will benefit from them.
Astronomy notes 4/17/19 – chap. 23 cont.
Dark matter in the Milky Way galaxy
· In the solar system, the further away a planet is from the sun, the slower the velocity
· You would expect it to be the same for the galaxy, as gravity works the same.
· However, velocities are not slower further out in the galaxy
· Measuring the mass of the galaxy, we get higher numbers than what is actually visible, this mass we cannot see on any wavelength is called dark matter
· We do not think it is black holes, faint objects (faint white dwarfs, red dwarfs, brown dwarfs, etc.) because their does not seem to be enough of those to make up for the amount of mass dark matter takes up
· Current theories are that it could be weird subatomic particles or modified gravity, but nothing concrete has come up yet
The galactic center:
· The center of our galaxy is very hard to see, as it is entirely obscured by dust
· Images in infrared, radio, and x-ray offer a different view of our galactic center
· It is estimated to be about a million times the density of our solar neighborhood
· Radio image shows a region about 100 pc across surrounding the galactic center
· Chandra image shows several very strong x-ray surrounding Sgr A*, the suspected black hole at the very center of our galaxy
The galactic center appears to have:
· A stellar density a million times higher than near earth
· A ring of molecular gas 400 pc across containing 100s of solar masses of material
· Strong magnetic fields
· A rotating ring or disk of matter only a few parsecs across
· White hot whirlpool of gasses near the center
· A strong x-ray source at the center, orbited by stars
The central black hole:
· Given the very large mass, clues listed above, and small size all indicate a supermassive black hole at the center of our galaxy (Sgr A*)
· An accretion disk surrounding the black hole emits enormous amounts of radiation
· Strong magnetic fields thought to be generated within the accretion disk acts as a particle accelerator, creating extremely high energy particles that can be detected on earth
Chapter 24
Hubble’s classification:
· Galaxies do not look the same, Hubble classified them in four main categories
- Spiral
- Barred spirals
- Elliptical
- Irregulars
Spirals:
· A flattened galactic disk, central galactic bulge with a dense nucleus and extended halo of faint old stars
· Sa, Sb, Sc classifications depending on the bulge size and tightness of spiral arms
· Spiral arms originate from bulge
· Tightness of arms correlated to bulge size (usually)
· Bulges and halos contain large numbers of reddish old stars and globular clusters, most of the light comes from A-G stars, giving a whitish glow
· Arms appear bluish because of many O and B type stars
Barred Spiral:
· Elongated “bar” of interstellar matter passing through the center and extending beyond the bulge into the disk
· Classifications are SBa, SBb, SBc similar to spiral classifications
Elliptical:
· No spiral arms and no galactic disk, just a dense central nucleus
· Stars smoothly distributed through an ellipsoidal volume
· Classification depends on how circular, E0 through E7
Irregular:
· Don’t belong to any category
· Example: Magellanic Clouds
· Irr I and Irr II classifications
Hubble sequence:
· Hubble originally suspected an evolutionary sequence, but we don’t have evidence that one type of galaxy evolves into another (in isolation)
Distribution of galaxies in space:
· Cepheid variable technique (from previous chapter) works only in the case of galaxies which are close enough for us to clearly see Cepheid stars (or which have Cepheid’s)
· Cepheid’s have been detected and measured in galaxies as far as 25 mpc
· Most galaxies lie far beyond that!
· We need a method to allow us to extend our distance ladder
Standard candles:
· Easily recognizable astronomical objects whose luminosities are well known – can determine distances by comparing with apparent brightness
· Must have a well-defined luminosity and must be bright enough to see at large distances
· Example: carbon detonation (Type I) supernova, always know the absolute brightness(luminosity), distance can be determined with apparent brightness
Tully-Fisher relationship:
· Rotational velocity of a galaxy is proportional to luminosity
· Standard candles and the Tully-Fisher relationship are the next two steps on the cosmic distance ladder
Galaxy clusters:
· Cluster: any collection of galaxies held together by gravity
· Examples:
- Local group: around 50 (55 according to our textbook) galaxies are known to reside within 1 mpc of the Milky Way galaxy
- Virgo Cluster: 17 mpc away from the Milky Way, 2500 galaxies, 3 mpc across
Hubble’s Law:
· All distant galaxies appear to be redshifted – greater the distance, greater the redshift
· Farther away a galaxy is, the faster it is moving away from us
· Implies that the universe is expanding!
· A plot of recession velocity vs distance is called a Hubble Plot
· Appears to be a linear relationship between recessional velocity and distance
· Knowing the recessional velocity (from the redshift) one can calculate the distance to an astronomical object
· Hubble’s constant is 70km/s/mpc (denoted as H0)
· v=H0d <--- Hubble’s law formula
0 notes
Text
Juniper Publishers- Open Access Journal of Case Studies

Capacity of Shear Wave Elastography in Diffuse Liver Diseases in Children
Authored by N E Kuzmina
Abstract
Two hundred and thirty children aged 3 to 18 years were included in the study, among them 200 were practically healthy (control group) and 30 patients aged 2 to 17 years had chronic liver diseases (study group). All patients underwent standard liver tests and two-dimensional shear wave elastography (Aixplorer device (Supersonic Imagine, France, convex sensor acting within the medium-frequency range of 1-6MHz). Ten measurements of Young modulus (Emean) were made in different segments of the right and left liver lobes with subsequent data averaging. In patients with chronic liver disease Young modulus values were significantly higher than in patients of the control group (Emean median was 7.05kPa and 5.00 kPa, interquartile range was 6.40-9-18 and 4.70-5.38kPa correspondingly) (p<0.001).
Ultrasound elastometry can be successfully used in complex assessment of liver diseases in children for dynamic monitoring in the group of patients with chronic liver diseases. Young modulus value of 6.35kPa will enable to reveal children who need additional examination when healthy children undergo screening evaluation by means of 80% sensitivity and 100% specificity tests.
Keywords: Ultrasound elastography; Shear wave elastography; Stiffness; Young modulus; Chronic liver disease; Fibrosis; Liver; Children
Introduction
Chronic diffuse liver diseases are an urgent issue in present children gastroenterology. The interest to this group of liver diseases is due to their increasing incidence, frequent severe course, tendency to progression and unfavorable outcomes. This problem requires great attention as the course of the diseases is often insufficiently symptomatic because of the great compensatory capacities of the organ. Clinical manifestations and patient presentation often take place when severe morphological changes have occurred, and adaptation and compensatory mechanisms have already been wasted [1]. Regardless of the etiology, cirrhosis is the cause of fatal outcome in patients due to the development of complications, i.e. hemorrhage from the esophageal varices, ascites, encephalopathy, hemorrhagic syndrome, transformation to hepatocellular carcinoma.
Various infectious agents such as hepatitis B, C, D, G viruses, cytomegalovirus, Epstein-Barr virus as well as autoimmune liver diseases, cystic fibrosis, metabolism diseases, etc. may act as etiologic factors causing liver fibrosis and cirrhosis in children. There is a direct correlation between the intensity of cirrhotic changes in the liver and the degree of cytolytic enzymes activity in viral hepatitis in children. In children with liver cirrhosis developing due to the conditions not related to the viral hepatitis pathologic process activity may be contemplated as a factor contributing to the progression of liver affection to cirrhosis. Thus, cirrhotic changes which are observed in diseases with high activity (autoimmune hepatitis, biliary atresia) develop within a short period. While diseases occurring with normal activity (congenital hepatic fibrosis) and insignificantly increased activity (cystic fibrosis) progression to liver cirrhosis occurs much slower. Long term catamnesis observations of liver cirrhosis and chronic viral hepatitis course have shown that cirrhosis occurs sufficiently early from the moment of its identification and is not the outcome of chronic viral hepatitis [2]. In spite of the increased experience in the study of viral liver diseases, characteristics of clinical manifestations, diagnosis, treatment and prevention of viral hepatitis A, B, C, D, E as well as metabolic, hereditary liver diseases i.e., galactosemia, α-1-antitripcin, Wilson-Konovalov disease, Alagil syndrome, Goshe disease, etc. still present some difficulties. They require technically and methodically complex approaches and committed pathogenetic therapy. Late diagnosis of many diseases results in unfavorable outcome so that there remains the only option i.e. orthotopic hepatic transplantation. It is practically impossible to extrapolate the study results obtained from adult patients because of the anatomico-physiological characteristics of a child because of his development rates, formation of all organs and systems [3].
Liver biopsy is still the basic diagnostic and predictive procedure in evaluation of liver diseases in children. Specific histological characteristics are important to diagnose hepatitis, cholestatic liver affections, steatosis, vascular conditions, storage diseases [4,5].
Biopsy is of utmost importance in case of crossed syndromes or non-typical clinical manifestation when only histologic sample can help solving diagnostic dilemma and give a chance of timely adequate therapy. Indications to perform liver biopsy are numerous and they increase in number when the current knowledge of etiology, molecular basis and therapy options of liver diseases in children increase. Development of alternative diagnostic methods and improvement of liver visualization techniques change the role of biopsy. The biopsy procedure is often complicated by technical difficulties connected with anesthesia, availability of trained staff and equipment, smaller sizes of the organ and a smaller sample. It may cause such complications as pain syndrome, profuse hemorrhage, formation of subcapsular liver hematomas, development of biliary peritonitis, etc. [6]. Standard liver biopsy averages 1/50.000 of the whole liver that is why the sampling error of 20- 30% is significant. It is necessary for the clinicians to cooperate with pathology doctors who have a clear picture of hepatobiliary problems in children. Diagnostic errors made by unexperienced specialists were registered in more than 25% of patients. Biliary atresia is a challenge for clinicians and pathology doctors because a missed opportunity of early diagnosis results in a missed opportunity of surgical correction. The feasibility of intra- and inter-observational study of biopsy samples is well known and can be the main factor limiting liver biopsy capacity [7].
That is why considering all difficulties of histologic verification specialists are motivated to search for noninvasive techniques which will enable not only to reveal changes in the liver but also to carry on dynamic observation of fibrosis process.
That is why considering all difficulties of histologic verification specialists are motivated to search for noninvasive techniques which will enable not only to reveal changes in the liver but also to carry on dynamic observation of fibrosis process. information in the form of digital data of the shear wave velocity (or Young modulus) in the area of interest (light window) is obtained. Areas with different velocity values of shear wave (or various values of Young modulus) are mapped by different colors. It is the digital values of these parameters that determine the color in the area of interest [8].
Shear wave elastography can be successfully used in the complex evaluation of liver parenchyma when it is affected and differentiation of diffuse pathology in B-mode is problematic. This ultrasound approach is intensively studied, but not in pediatrics [9-12]. Diagnostic efficiency of two-dimensional shear wave elastography was proved by the studies performed in the adult population. As a result, the threshold elastometry values for each stage of fibrosis were established [13-15].
The purpose of our investigation has been to study the values of liver stiffness in children with liver chronic diseases and performing a routine ultrasound exam to establish the values of Young modulus which will enable to reveal patients with uncertain chronic liver conditions requiring additional complex examination.
Material and Methods
Two hundred and thirty children aged 3 to 17 years were included in the study. Among them there were 200 practically healthy children aged 3 to 18 years (control group) and 30 patients aged 2 to 17 years with chronic liver diseases (study group).
In the group of children with hepatitis the patients were distributed in the following way: cryptogenic hepatitis – 10, autoimmune hepatitis – 4, hepatitis of unspecified genesis - 3, liver cirrhosis - 3, hepatitis of cytomegaloviral etiology – 2, storage disease – 2, unspecified liver fibrosis, primary sclerosing cholangitis – 2, virus C hepatitis – 1, herpes-viral hepatitis – 1 (Figure 1).
All children underwent standard ultrasound study of abdominal organs in the grey scale mode supplemented by two-dimensional shear wave elastography on Aixplorer device (Supersonic Imagine, France) by broadband convex sensor acting within frequency range of 1-6MHz. Elastometry was made when a patient was fasting, breathing normally, in elder children during breath-holding for not more than 10sec, patients were in a supine position. There were subcostal, intercostal and epigastric accesses. The sensor was placed perpendicularly to the body surface with minimal pressure. Measurements were taken in the areas free from the vascular structures, fixing the zone of scanning at the depth of 3-5cm from the capsule, in different segments of the right and left hepatic lobes, taking into account literature data testifying absence of significant differences between stiffness in the right and left lobe. The investigation was completed after getting 10 informative measurements with average values of Young modulus (kPa) – Emean, at stabilization of the image to get a homogeneous coloring of the light window and color filling for more than 90%. By the results of the measurements arithmetic mean value of Young modulus characterizing liver stiffness was calculated.
Informed consent was obtained from the legal representatives of all patients. The study was approved by the Ethics committee FGBOU DPO “Russian Medical Academy of Postgraduate Professional Education” of Health Ministry of the Russian Federation and local Ethics committee of GBUZ “Chelyabinsk Regional Children Clinical Hospital”.
Statistical analysis of data was performed by IBM SPSS Statistics 19 pack. Most of the quantitative values did not follow normal distribution, that is why methods of nonparametric statistics were used. All quantitative values were presented as M (mean value), σ (standard deviation), median (50th percentile), 25th-75th percentiles of both minimal and maximal values. Comparison of quantitative parameters was performed using Mann-Whitney test, qualitative ones were compared by Fisher criterion of accuracy. Differences (p>0.0)5 were considered significant.
Results
During the investigation of the study group of children hepatomegaly was revealed in 28 patients (93,3%), splenomegaly in 17 (56.7%), signs of portal hypertension were found in 7 children (23.3%). Twenty-three children (76.7%) were ill not more than 3 years, one child was ill up to 5 years (3.3%), in the rest of the children (6 patients) the duration of the disease was more than 5 years (20%). All the patients of the study group underwent examination in Chelyabinsk Regional Clinical Hospital. They were admitted to the hospital during the development of symptoms (abdominal, dyspeptic, asthenia -vegetative syndrome, complaints of malaise and fatigue, abdominal pain, vomiting, skin and sclera icterus combined with increased transaminase in the biochemical blood analysis), they were also examined for isolated increase of liver enzymes resulting in cholestasis and cytolysis syndrome. Histological verification was done in 18 patients of the study group. During this verification we faced the absence of unanimous consent on the pathomorphological evaluation of biopsy samples: evaluation of fibrosis stage according to different scales Knodell, Metavir, Desmet included just descriptive picture of the sample without any conclusion of fibrosis stage. Autoimmune hepatitis was found in 4 children based on presence of ANA- and SMAantibodies. Nine patients underwent CT and MRI, 3 patients had radioisotope imaging.
Elastography characteristics of changes in the liver in all patients with hepatitis showed the presence of heterogeneous elastometry picture: from homogenous coloring in dark blue and light blue tones and absence of areas of increased stiffness (i.e. qualitative characteristics (range of colors) were not practically different from the control group to yellow-orange and red coloring in the area of interest (Figure 2 & 3).
Earlier we studied liver stiffness in 200 practically healthy children aged 3 to 18 years. Young modulus values were considered as standard [9]. Young modulus values in the study and control groups are presented Table 1. Comparing groups of patients with chronic liver diseases and those from the group of practically healthy children significant differences of Young modulus values were obtained (Emean) (p<0.000).
Considering insufficient number of patients in the age subgroups it is impossible to perform statistical analysis of gender – age characteristics of liver stiffness in children with hepatitis. Then sensitivity and specificity of diagnostic tests and threshold value of stiffness in patients with hepatitis were determined.
ROC-analysis of Young modulus value was done. This analysis enabled to determine the threshold value of interval variable of a predictor. The more convex is the ROC curve, the more accurate are the prognostic test results. The indicator of this feature is the area under the ROC curve (AUC) which equals 0.5 for zero degree of prognosis and for maximal prognosis it equals 1.
ROC analysis results are presented in Figure 4 and Table 2. In our study while building the ROC curve of Young modulus the area was 0.934 (corresponding to a good model of classifier), the confidence interval was 0.874-0.994;
a) Sensitivity.
b) Specificity.
c) Diagonal segments are formed by coincidences.
Table 3 shows data of sensitivity and specificity of threshold values of Young modulus values in patients with hepatitis in optimal combination of sensitivity and specificity predicative significance of threshold value of 5.9-6.35kPa seems optimal.
Discussion
According to literature data several research teams studied liver stiffness values in patients with hepatitis. Young modulus values in adult patients with hepatitis C were studied by G Ferraioli et al. [13]. The study group included 121 patients, accuracy of two-dimensional shear wave elastography (SWE) compared to transient elastography (TE) was evaluated, liver biopsy served as a reference standard. The study was done by two doctors by convex sensor SC6-1 and probe M3 in the right liver lobe through the intercostal space with a patient in the supine position. Evaluation of reproducibility was studied simultaneously. It was established that liver stiffness values increased simultaneously with fibrosis degree when assessed on different devices. Median of Young modulus for F1 fibrosis was 6.2kPa (interquartile range 5.1 - 6.8), for F2 - 7.6kPa (7.2-8.3), for F3 - 10.0kPa (9.2-10.1), for F4 - 15.6kPa (12.8-18.8). Taking into consideration histologic verification fibrosis evaluation accuracy by SWE technique was 83.1%, while by TE technique – 66.7%. Diagnostic accuracy for fibrosis differentiation of F0-F1 from F2-F4 with AUC was 0.92 (CI 95%, 0.85-0.96) for SWE and 0.84 (CI95% 0.76-0.90) for TE (p=0.002); for differentiation of F0-F2 from F3-F4 – 0.98 (CI 95% 0.94-1.00) for SWE and 0.96 (CI 95% 0.90-0.99) for TE (p=0.14) for differentiation F0-F3 from F4 – 0.98 (CI 95% 0.93-1.00) for SWE and 0.96 (CI 95% 0.91- 0.99) for TE (p=048). The study results showed that SWE in the real-time mode is more accurate than TE to evaluate significant fibrosis (> F2). Evaluating the results consistency obtained by the first and second research teams the value range of correlation coefficient was 0.95 (CI 0.93-0.98) and 0.93 (CI 0.90-0.96) for the first operator and the second operator correspondingly. Inter – observational consistency was 0.88 (CI 95% 0.82-0.94) which proved the technique to have good reproducibility when it is used both by one and different operators [13].
Similar study design was carried out by a research team in hepatology of A Guibal et al [14]. Diagnostic capacity of twodimensional shear wave elastography was compared to transient elastography, histomorphology analysis served as a reference standard. The study showed high accuracy of two-dimensional shear wave elastography in evaluating liver fibrosis in 149 adult patients with chronic liver disease. Five measurements in liver segment V with patient in a supine position, holding breath for 5sec and using convex sensor SC6-1 were made. Median of five successful measurements was recorded, when the light box was filled by 2/3 and stiffness values were higher than 0.2kPa. In the subgroup of random patients five additional measurements of stiffness were also made by the third physician to study the inter – observational reproducibility. All patients had liver biopsy in segment V under ultrasound control, the results were evaluated in accordance with METAVIR system. In the subgroup of 55 patient’s stiffness correlation measured by SWE and TE and fibrosis degree were compared by means of Spirmen ranging coefficient.
The average liver stiffness in the study group was 7.0kPa (IQR: 6.0; 8.3) for F0-F1; 9.5kPa (IQR: 7.8; 11.4) for F2; 13.0kPa (IQR: 10.4; 16.7 for F3 and 25.8kPa (IQR: 21.7; 34.5) for F4. Twenty-five patients were included in a subgroup to study reproducibility. ICC composed 0.92 (CI 95% 0.81-0.96). Young modulus threshold value for fibrosis F> 2 was established as 8.8 kPa for SWE and 7.7kPa for TE with sensitivity 90.5 (69.9- 98.8) and 85.7 (63.7-97.0) and specificity 79.4 (62.1-91.3) and 88.2 (72.5-96.7) correspondingly. For F >3 it was established as 11.5kPa for SWE and 8.6 kPa for TE with sensitivity 78.6 (49.2- 95.3) and 85.7 (57.2-98.2), specificity 97.6 (87.1-99.9) and 90.2 (76.9-97.3) correspondingly. For fibrosis F=4 it was established as 15.8kPa for SWE and 11.8kPa for TE with sensitivity 100 (54.1-100) and 100 (54.1-100), specificity 98.0 (89.1-99.9) and 87.8 (75.2-95.4) correspondingly. Two-dimensional shear wave elastography showed high diagnostic accuracy for fibrosis F >2 with AUC 0.904 (CI 95% 0.845-0.946); 0.958 (CI 95% 0.912-0.984) for fibrosis F > 3 and 0.988 (CI 95% 0.955-0.999 for fibrosis = F4. There was established significant correlation between fibrosis stage and stiffness by SWE (r = 0.77; CI 95% 0.63-0.86; p<0.0001) and TE (r = 0.65; CI 95% 0.47-0.78; p<0.01) in this subgroup [14].
Two hundred and twenty-six adult patients with hepatitis B included in V Y Leung et al. [15] underwent liver biopsy. The stiffness values were compared to those in 171 healthy volunteers from the control group. Measurements were made by a convex sensor in segment VIII of the right liver lobe by three operators with different work experience, patients holding breath for a short time. Reproducibility and degree of values consistency were evaluated. Inconsistency of elastometry results and histologic evaluation was 10.2% (23 of 226 patients). Threshold value for fibrosis > F1 was determined as 6.5kPa with AUC 0.86; for > F2 as 7.1kPa with AUC 0.88; for > F3 as 7.9kPa with AUC 0.93; for F4 as 10.1kPa with AUC 0.98. The range of values of correlation coefficient for three operators measuring stiffness in three different hepatic areas was from 0.86 to 0.98, CI 95% 0.71 to 0.99. Good reproducibility was noted among the three operators (ICC 0.85; confidence interval 95% 0.70, 0.94 [15]. Comparison of results of shear wave elastography and transient elastography in the diagnosis of diffuse liver diseases was carried out in the group of 128 patients in the study performed by Diomidova VN & Petrova OV [16]. Liver stiffness was studied in 60 practically healthy people and 68 patients with chronic liver diseases. Stiffness values (Emean) in segment VIII projection were significantly higher (p < 0.05) when comparing with other segments. In transient elastography stiffness values in patients with chronic viral hepatitis B and C were 7.2kPa, liver cirrhosis – 43.8kPa; in shear wave elastometry (Emean) – 8.3 and 55.3kPa correspondingly (p< 0.05 comparing to the control group). Efficiency rate of measurements by transient elastography was 84.4% of cases, shear wave elastometry – 100.0% [16].
It is known from the literature data that O Belei et al. research team [11] carried out the study of the feasibility of liver stiffness measurement in children with CLD by means of point shear wave elastography (ARFI) and two-dimensional elastography (SWE) compared to transient elastography (TE) as a reference standard. Liver biopsy in children was not performed. The group of children with liver diseases (n 54) included: children with chronic hepatitis B, unspecified chronic hepatitis, autoimmune hepatitis, nonalcoholic steatohepatitis, Wilson disease and hemochromatosis. Ten liver stiffness measurements were made. SWE was made by Aixplorer device (Supersonic Imagine, Aixen- Provence, France) using a convex sensor, a mean value of 5 measurements was determined. The mean value of Young modulus in the children studied by two- dimensional shear wave elastography SWE was (7.76±2.46) kPa (CI 95% 7.07-8.46), which is sufficiently close to our study.
Using the technique of two-dimensional shear wave elastography (Aixplorer, Supersonic Imagine, France) in patients with chronic liver diseases (76 children) O Tutar et al. [12] also established that the mean value of liver stiffness in children with fibrosis changes of F1, F2, F3 and F4 degrees according to Brunt was significantly higher than in the control group (p<0.001 for all comparisons) [12].
The analysis of the data obtained in our study as well as that of other research teams has revealed that values of hepatic tissue stiffness in patients with chronic liver diseases are significantly higher than those in healthy volunteers. Young modulus values in the study group are significantly higher than those of the children in the control group (Emean median – 7.05 and 5.00kPa, interquartile range – 6.40-9.18 and 4.70- 5.38kPa correspondingly) (p < 0.001). In children with chronic liver diseases the mean value of Young modulus of 7.89 ± 0.43kPa coincides with the data of O Belei et al. [11] research team – 7.76±2.46kPa and close to the results of A Guibal et al. [14] - 7.0kPa. Young modulus value of 5.9-6.35kPa used as a test (close to the results of V Y Leung et al. [15] study) will enable to reveal children who need additional 80% sensitivity and 95% specificity examination. Taking into consideration the noninvasive feature of this technique ultrasound elastometry can be used both in complex evaluation of liver lesions and for dynamic monitoring purposes.
To know more about Juniper Publishers please click on: https://juniperpublishers.com/manuscript-guidelines.php
For more articles in Open Access Journal of Case Studies please click on: https://juniperpublishers.com/jojcs/index.php
#JuniperPublishers#juniper publishers journals#Cardio-Thoracic Surgery#Gastroenterology#Hospice and Palliative Medicine#Internal Medicine
0 notes
Text
Boson particles discovery provides insights for quantum computing
Researchers working on a U.S. Army project discovered a key insight for the development of quantum devices and quantum computers.
Scientists found that a class of particles known as bosons can behave as an opposite class of particles called fermions, when forced into a line.
The research, conducted at Penn State University and funded in part by the Army Research Office, an element of U.S. Army Combat Capabilities Development Command's Army Research Laboratory, found that when the internal interactions among bosons in a one-dimensional gas are very strong, their velocity distribution transforms into that of a gas of non-interacting fermions when they expand in one dimension. The research is published in the journal Science.
"The performance of atomic clocks, quantum computers and quantum systems rely upon the proper curation of the properties of the chosen system," said Dr. Paul Baker, program manager, atomic and molecular physics at ARO. "This research effort demonstrates that the system statistics can be altered by properly constraining the dimensions of the system. In addition to furthering our understanding of foundational principles, this discovery could provide a method for dynamically switching a system from bosonic to fermionic to best meet the military need."
The researchers experimentally demonstrated that, when bosons expand in one dimension -- the line of atoms is allowed spread out to become longer -- they can form a Fermi sea.
"All particles in nature come in one of two types, depending on their spin, a quantum property with no real analogue in classical physics," said David Weiss, Distinguished Professor of Physics at Penn State and one of the leaders of the research team. "Bosons, whose spins are whole integers, can share the same quantum state, while fermions, whose spins are half integers, cannot. When the particles are cold or dense enough, bosons behave completely differently from fermions. Bosons form Bose-Einstein condensates, congregating in the same quantum state. Fermions, on the other hand, fill available states one by one to form what is called a Fermi sea."
The research team created an array of ultracold one-dimensional gases made up of bosonic atoms (Bose gases) using an optical lattice that uses laser light to trap the atoms. In the light trap, the system is at equilibrium and the strongly interacting Bose gases have spatial distributions like fermions, but still have the velocity distributions of bosons. When the researchers shut off some of the trapping light, the atoms expand in one dimension. During this expansion, the velocity distribution of the bosons smoothly transforms into a one that is identical to fermions.
"By fully understanding the dynamics of one-dimensional gases, and then by gradually making the gases less integrable, we hope to identify universal principles in dynamical quantum systems," Weiss said.
Dynamical, interacting quantum systems are an important part of fundamental physics. They are also increasing technologically relevant, as many actual and proposed quantum devices are based on them, including quantum simulators and quantum computers.
"We now have experimental access to things that if you would have asked any theorist working in the field ten years ago 'will we see this in our lifetime?' they would have said 'no way,'" said Marcos Rigol, professor of physics at Penn State and the other leader of the research team.
Story Source:
Materials provided by U.S. Army Research Laboratory. Note: Content may be edited for style and length.
0 notes