#QGis
Text
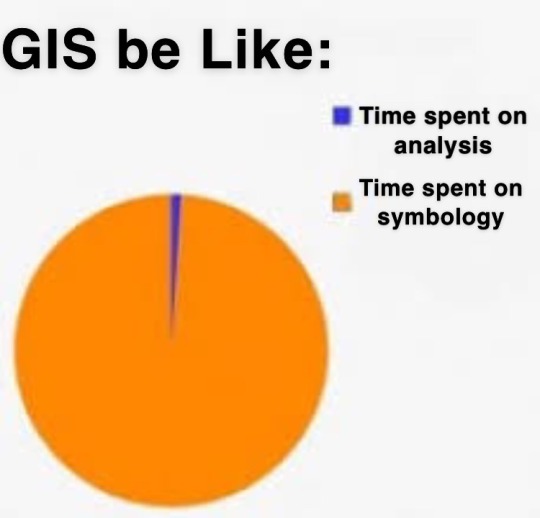
why is the default symbology the ugliest thing ive ever seen like Who want a map that looks like That
47 notes
·
View notes
Text
just described qgis as “if photoshop and excel had a baby”
what did i mean
28 notes
·
View notes
Text
a year into my master's—some favorite resources
context: i am studying an MRes in sociology at a european university.
notion—lifesaver
google drive—because my school runs on google
adobe acrobat plugin for google drive—great for annotations
goodnotes—better than notion if you have access to powerpoints before class! (implies having a tablet)
slidesgo—cute presentation designs, can be edited and made into templates!
pomodoro kitty—cutest website ever, keeps me accountable!
thematic selections on theconversation (in my case, "environment")—great for keeping up with the latest research in your area of choice!
greek alphabet letters website—for math/stats
stack overflow—a lifesaver for those of us learning r
statistics by jim—simple but amazing explanations
center for spatial research tutorials (columbia university)—great for qgis!
plus jstor and some others i cannot legally name, obviously...
that's it! i don't really use paper. hopes this reaches the right audience <3 good luck with back to school prep!
12 notes
·
View notes
Text


Three views of the Richibouti River in New Brunswick.
The True Colour image, the Normalised Differential Water Index, and the Normalised Differential Vegetation Index. These each show interesting bits of information about the area, but I just posted them up because I like how they look.
Sentinel 2 is an optical satellite which provides colour imagery at 10m for some bands. This makes it really useful, because it has a pretty good resolution.
The NDWI is wonderful because it shows areas that are wetter, which means that it highlights specific areas, and I have used it to highlight wet spots and waterbodies.
The NDVI can highlight vegetation health, but also areas without vegetation.
6 notes
·
View notes
Text
New #GIS drinking game - Every time Q/Arc crashes, you take a shot! It's like Russian roulette for your liver with every click!
29 notes
·
View notes
Text
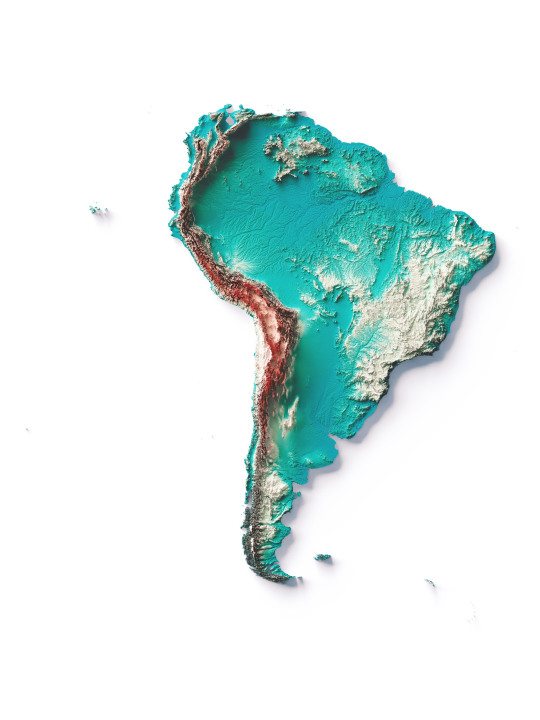
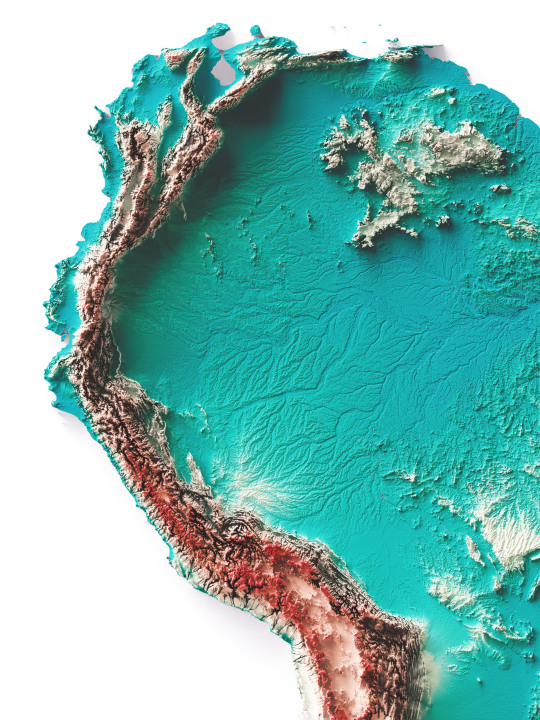
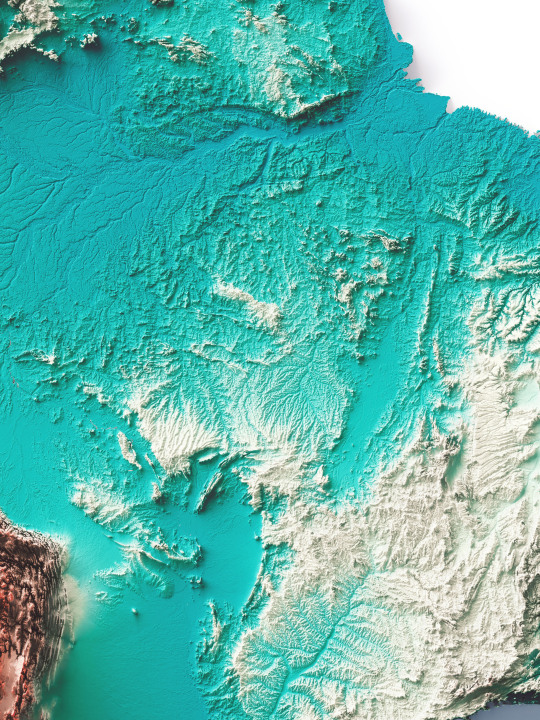
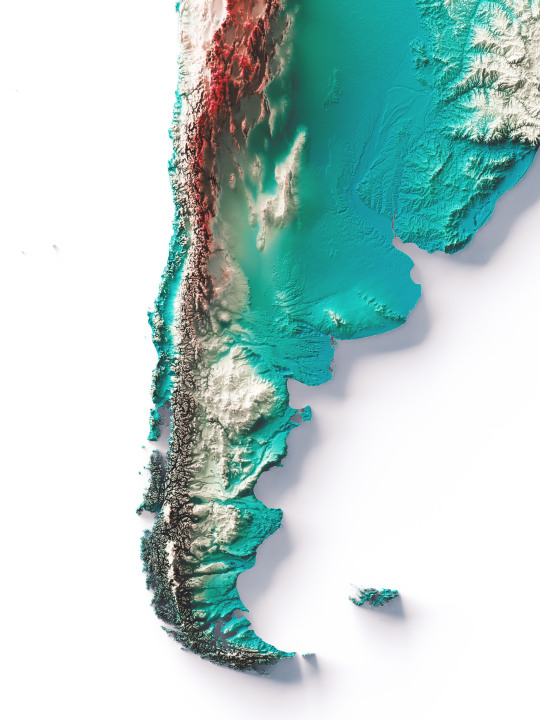
South America, elevation map on Spectral tint.
We have created four colour variants for this continent and would like this combination to become standard.
The red area shows the highest mountains, the Cordillera de los Andes, while the plains are indicated with the colour petrol blue.
If you like our work, want to see our daily updates (or want to say hello to our studio), consider to follow our Instagram or Twitter account. Otherwise if are interested in our prints or have a custom request check our shop.
#mapporn#dataviz#datavisualization#mapart#b3d#blender#qgis#cartography#maps#geography#reliefmaps#reliefmap#3dmapping#mapping#mapartwork#southamerica#southamericatrip#southamericatravel#brazil#braziltravel#argentina#argentinatravel#braziltrip#chile#chiletravel#chiletrip#argentinacampeon#perutrvel#uruguay🇺🇾
99 notes
·
View notes
Text
Tips from a (former) GIS Undergraduate Student to other GIS students
Reuploaded since reddit mods haven't got back to my message and reddit's spam filter is removing it no matter where i post it...
I have graduated from college (wooo!) and wanted to share advice that helped me out. I hope you find it useful!
Volunteer to boost your resume or if you lack GIS work experience
When I first started my GIS major, I wanted to get work experience alongside my classes. The thing was I began my degree when Covid started, so landing a GIS internship when most organizations were laying off people was not realistic.
I knew I needed something on my resume so I decided volunteering was the best way to go.
I googled ‘GIS volunteer opportunities’, saw a listing through United Nation’s volunteer portal, and got something pretty quickly. It was an online position that I did on my own time for 6 months. It was very fun! I highly recommend any Geography student do some type of GIS volunteer work before you graduate.
As of writing this post, I checked the website and it looks like the UN doesn’t have any positions listed but there is a website dedicated to GIS volunteer positions:
https://www.giscorps.org/become-a-volunteer/
Also, every job interview I had has always asked me about this volunteer role lol.
Speaking of jobs….
Make a GIS Portfolio
Start a portfolio NOW. Add anything you created from your courses to it! A GIS portfolio makes you stand out from the competition when applying to internships/jobs, and may even be required for some job applications.
This is a VERY detailed video about what it should include (Yes it’s an hour long but the information is worth it!! ).
youtube
Network
You have heard it a MILLION times but network!! Connect with your local GIS organization and try to attend a conference. If you can’t for whatever reason, search for online GIS organizations and see if you can join their online zoom meetings.
Learn to Code
I have run into Python, R, Javascript, and HTML/CSS during my undergraduate work and various internships/jobs. Be ahead of the curve and learn it on your own. I would HIGHLY recommend Python if you want to start with a language and don’t have a course at your university. Just start with a basic ‘intro to python’ video and then complete python gis tutorials.
Make a separate account for GIS stuff
Just to keep things organized and in one place, I recommend you make a separate email for GIS. For some of my courses I was required to sign up for GIS software/sites and I wanted to have access long after graduation so I made a separate account for it.
Example email: [email protected]
Take Advantage of (Online) Communities
Being in GIS forums/groupchats/servers/etc has helped me so much! From feedback with assignments to how to market myself when looking for a job, joining groups is beneficial.
I LOVEEE the GIS Discord server and highly recommend you join.
(Link to server https://disboard.org/server/769917190182404127 )
Keep Learning!
This is the most important thing I want you to leave with. GIS is constantly evolving and in order to be on top, you need to be up to date on new technology and software updates etc.
Personally, I would be learning new stuff during semester breaks and take advantage of the free courses Esri MOOC has.
39 notes
·
View notes
Video
youtube
Quick OSM effective data collection
2 notes
·
View notes
Text

The final race day of the season is here already. Where did these three months go to? Oh, how it sucks that the season is so short and the off-season so long in this sport.
Anyway, my favourite discipline, mass start, has the honour to bring even this season to an end. The women will be running yet again on the 2.5 km loop while the men are using this 3 km loop (or 2.8 km track according to my measurements). The course design in Canmore is rather interesting in the sense that the 3 km loop has a section that is not used in any other track, the longer tracks included. It makes the downhill after the climb near the shooting range longer, but otherwise it does not add much to the 2.5 km track besides the curiosity.
The track also has a bit longer downhill after the extra loop as it goes further down after going under the bridge of 3.3 km loop and starts to climb up to the stadium there. This makes the 3 km course probably the toughest one in Canmore in terms of shooting. The athletes have a proper 500 metres of uphill before entering the range. This climb might also be the place to make it or break it in the final lap. Who still has gas in their tank when there is 500 metres of season left? We will have to wait and see.
4 notes
·
View notes
Text
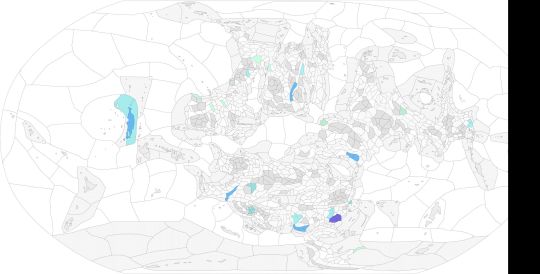
Map of all of the diamond deposits in my world, look out for 35 of these maps in the next week or so
10 notes
·
View notes
Text

back on my gis bullshit i guess
#qgis#personal#glad to have an excuse to post these memes i made when i had a Crippling crush on my gis ta lolol#gis#attribute table#linking key#not me having to Google literally anything and everything
3 notes
·
View notes
Text
Welcome!
I don't know what to put here but I wanted to create a blog of my own.
I'll try to put something here, maybe some passion projects.
About me:
In college, Geodetic Engineering in the Philippines.
Studying to become a surveyor.
I'm a try hard graphic designer.
I'm trying to learn how to use QGIS, so I may post maps.
and maybe some graphic design i guess...
3 notes
·
View notes
Text

A map prepared for part of my thesis work
A little map made for my thesis work. <3
I love landsat data. It just looks really pretty.
5 notes
·
View notes
Text
Thoughts at 830...
If you're wondering how our day is going ....
She sent me a zip file called Shapefiles that had all of the .shx, .proj, .dbf and stuff... but did NOT actually have the freaking .shp shapefile!!!!!!!!
We are GIS professionals... we get paid a LOT of money to do GIS stuff... sometimes... we fuck up and forget to send the .shp's
For those who don't know, Shapefiles are a lot like ikea furniture... you need all the parts to make it work. She basically sent me the screws, the funky allen wrench, the instructions, and a nice sticker.... but forgot the actual wood pieces needed to make the bookcase.
6 notes
·
View notes
Text
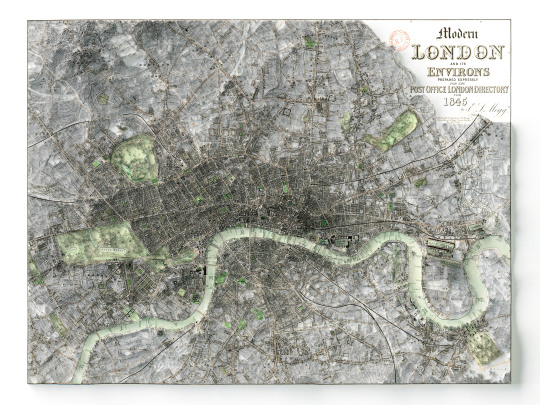
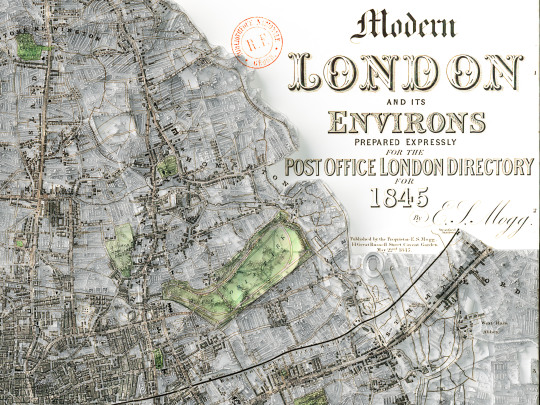
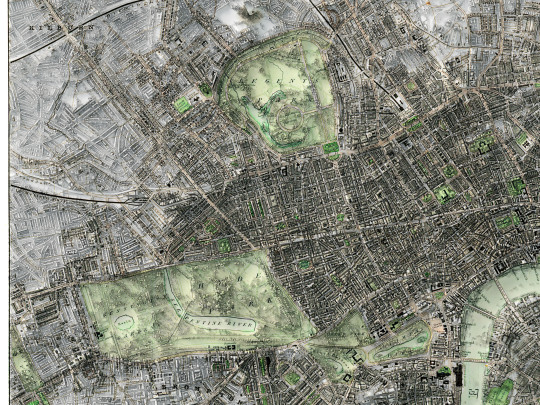
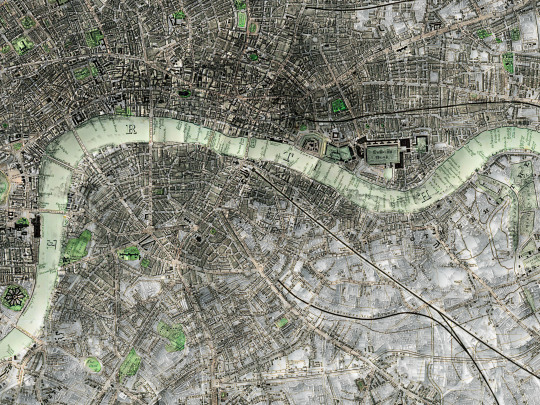
Finally here we go! Another map of a city, and
this time it's London!
It's a map from 1845 and we spent a lot of time in order
to restore it.
We're very pleased with the result we got, but to be
honest we already have more planned, again of
London, and we hope to be able to show them to you
soon.
If you like our work, want to see our daily updates (or want to say hello to our studio), consider to follow our Instagram or Twitter account. Otherwise if are interested in our prints or have a custom request check our shop.
#blender#datavisualization#qgis#geography#mapporn#cartography#mapping#gis#blender3d#dataviz#b3d#map#maps#citytour#citymap#london#londonart#londoncity#londonlife#london🇬🇧#londontravel#londonlove#londonlover#britain#england#londontower#regentspark#hydepark
14 notes
·
View notes
Text
My maps for electoral results I'm working on were completely off because I forgot we live in a world where "Number of voters" doesn't correlate 1:1 with "Number of votes"
It's more a 2:1 if anything...
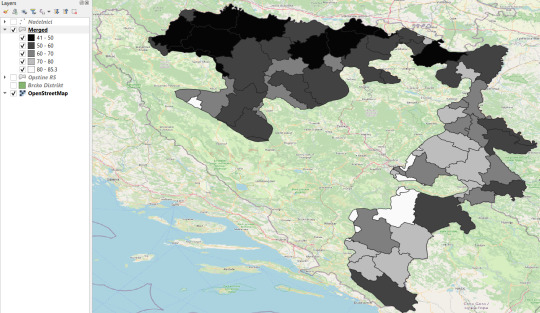
#og post#qgis#keep in mind the north is higher in population thus the deeper black holes in it#I like this breakdown specifically because it shows we do have municipalities where “Didn't vote” won the election#Guess what happens? 2nd place still takes power since you “Didn't vote” and someone has to!#This is what makes election boycotts very funny to me. What did you expect would happen? That people would give a shit about “legitimacy” ?
3 notes
·
View notes
Last Seen Blogs

williambyeets
Squeamie On My Panini

cimdymoon
mall rat

lolazoel
Lola

augustgeiger
banging like an 808

sangi-jpg
sangi_jpg