#Pareto Charts
Explore tagged Tumblr posts
Visit Tumblr Blog
Explore Tumblr blogs with no restrictions, modern design and the best experience.
Last Seen Tumblr Blogs


Fun Fact
If you dial 1-866-584-6757, you can leave an audio post for your followers.
Text
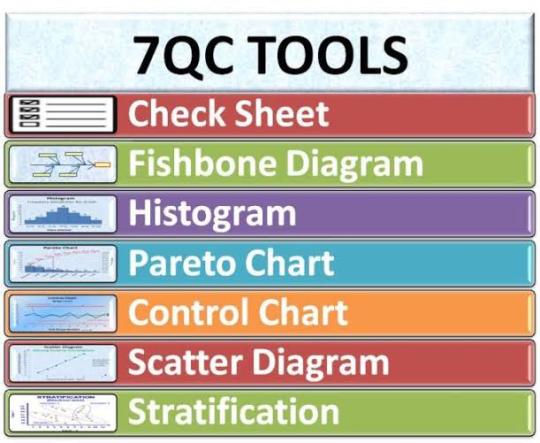
What are 7 QC Tools? 7 QC Tools: The Foundation of Quality Management
In the realm of quality management, the 7 Quality Control (QC) tools, also known as the 7 Basic Tools of Quality, serve as the bedrock for analyzing and improving processes. These powerful tools, developed by Dr. Kaoru Ishikawa, are indispensable for identifying issues, making informed decisions, and enhancing overall quality. This article delves into the details of the 7 QC tools, their…
View On WordPress
#7 QC Tools#Business Excellence#Cause-and-Effect Diagrams#Check Sheets#Continuous Improvement#Control Charts#Cost Savings#Customer Satisfaction#data analysis#Data-Driven#Decision Making#Defect Concentration Diagrams#Flowcharts#Healthcare#Histograms#Manufacturing#Operational Excellence#Pareto Charts#Problem Identification#Process Improvement#Process Stability#Quality Control#Quality Management#Root Cause Analysis#Service Sector#Versatile Solutions
0 notes
Text
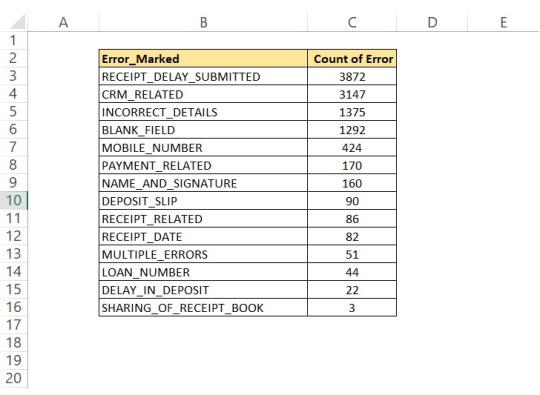
How to create a Pareto Chart in Excel - 80/20 Rule
How to create a Pareto Chart in Excel Pareto Chart is the presentation of Pareto principles also known as 80/20 rules, the law of the vital few, or the principle of factor sparsity is used in statistics and quality control. This principle explains 80% of the consequences come from 20% of the causes( the vital few). This 80/20 proportion can be changed in practical life based on the actual…
View On WordPress
0 notes
Text
9 ways to Improve quality scores
youtube
#bpo jobs#youtube#bpo interview questions and answers#bpo interview tips for freshers#bpo services#bpo tutorials#bpo interview#bpo trends#bpo#bqm#call center jobs#call center vacancy#call calibration#call center#conference call#pareto chart#six sigma green belt#lean six sigma#sixsigma#six sigma#quality analyst#quality#bottom quartile management#low quality#7 qc tool#quality tools#histogram
0 notes
Text
Continuous Improvement
The manufacturing sector is highly competitive, and companies must continually improve their processes. In this article, we will discuss a step-by-step approach to continuous improvement in manufacturing. We will focus on collecting data for the process, prioritizing problems, monitoring defects, identifying the root cause of defects, standardizing the fix, and confirming the solution’s…

View On WordPress
#Continuous improvement#control chart#Cost reduction#data collection#defect monitoring#first-time yield#manufacturing#Pareto analysis#problem prioritization#productivity#Quality#Root Cause analysis#Standardization
0 notes
Text
Maximizing Efficiency with Pareto Analysis

Source: https://rambox.app/wp-content/uploads/2023/10/The-power-of-Pareto-analysis.png
In the fast-paced world of business and problem-solving, prioritizing actions can make the difference between success and failure. Enter Pareto Analysis, a powerful tool rooted in the 80/20 rule, which helps identify the most significant factors affecting outcomes. This principle, named after the Italian economist Vilfredo Pareto, asserts that 80% of effects often come from 20% of causes. Here’s why and how Pareto Analysis can transform your approach to tackling challenges.
The Power of the 80/20 Rule
The 80/20 rule is both simple and profound. It suggests that a small number of causes (20%) are responsible for the majority of effects (80%). In business, this might mean that 80% of your revenue comes from 20% of your customers, or 80% of your problems stem from 20% of the underlying causes. Recognizing this disproportionate distribution allows you to focus your efforts on the areas that will yield the most significant improvements.
Implementing Pareto Analysis
Identify Key Issues: Begin by listing all the problems or causes related to the situation at hand. This could be defects in a product, customer complaints, or sources of inefficiency.
Quantify the Impact: Measure the frequency or severity of each issue. This data-driven approach ensures your analysis is based on facts, not assumptions.
Rank and Prioritize: Arrange the issues from most significant to least significant. This ranking helps in visualizing which problems are the most critical.
Create a Pareto Chart: Construct a bar graph with causes on the x-axis and their impact on the y-axis. Add a cumulative percentage line to see how quickly the issues add up to 80% of the problem.
Benefits of Pareto Analysis
Focus on What Matters: By zeroing in on the most impactful issues, you can allocate resources more effectively and achieve quicker results.
Data-Driven Decisions: Pareto Analysis removes guesswork, allowing decisions to be based on solid data.
Improved Efficiency: Addressing the key causes first leads to significant improvements with less effort.
Real-World Example
Consider a software company facing numerous customer complaints. A Pareto Analysis might reveal that 80% of complaints come from 20% of the software bugs. By prioritizing fixes for these critical bugs, the company can significantly enhance user satisfaction and reduce the volume of complaints.
Conclusion
Pareto Analysis is a game-changer for anyone looking to optimize processes and solve problems efficiently. By focusing on the vital few causes that have the greatest impact, you can make meaningful progress without being overwhelmed by the many lesser issues. Embrace the 80/20 rule and watch your efficiency and effectiveness soar.
Maximize your impact with Pareto Analysis, and turn your biggest challenges into your most significant victories.
📊✨ #ParetoAnalysis #8020Rule #Efficiency #ProblemSolving #DataDriven #BusinessStrategy #Optimize
#80/20 rule#analysis#engineering#business#education#tools#paretoprinciple#strategies#business strategy
2 notes
·
View notes
Text
7 QUALITY CONTROL TOOLS FOR PROCESS IMPROVEMENT
“As much as 95 per cent of all quality-related problems in the factory can be solved with seven fundamental quantitative tools.”
-Kaoru Ishikawa, The inventor of Fishbone Diagram
In today’s customer-centric market, quality is an integral factor in the growth and sustainability of any business. Businesses go the extra mile to provide the best and excellent customer experience to ensure customer satisfaction. Hence, efficient quality management which has the highest impact on customer experience is one of the most essential features for any business.
Introduced by Kaoru Ishikawa, the seven basic tools of quality also known as 7QC tools are very effective in quality management and quality assurance process. So, businesses who want to ensure competitive and excellent quality of their products and services can utilize the proven 7QC tools for structuring a strategic plan for quality improvement.
LIST OF 7 QC TOOLS
Cause and Effect Diagram
Cause and Effect Diagram also known as Fishbone Diagram helps in identifying the potential causes of an effect or a problem. In addition to sorting ideas in respective categories, it also helps in understanding the areas of opportunity through effective brainstorming. Fishbone training empowers you to identify the potential cause in the problem.
Control Chart
Control charts are used to study how the processes have changed over a period of time. Further, by comparing current data to historical control limits, one could lead to the conclusion about whether the process variation is consistent as in under control or unpredictable as in out of the control due to being affected by special causes of variation.
Pareto Chart
Pareto Chart is based on the 80/20 rule where it shows the significant factors that have the highest impact on the identified problem.
Check Sheet
Check sheet is a structured process which helps to collect and analyzing data. It is an effective tool that can be for a variety of purposes.
Histogram
Histogram is commonly used a graph that shows the data and its frequency of distribution to help users identify each different value in a set of data occurs.
Scatter Diagram
Scatter diagram shows the relationship between two important factors i.e. pairs of numerical data, one variable on each axis to demonstrate the relationship.
Stratification
Stratification also known as a flow chart or run chart is a technique that separates the data gathered from a variety of sources so that patterns can be seen i.e., the path an entity has taken through a defined process.
Utilizing the 7 QC tools in six sigma or quality management process helps in taking a systematic approach to identify and understand the risk, assess the risk, control fluctuation of product quality and accordingly provide solutions to avoid future defects.
WHEN SHOULD YOU USE 7 QC TOOLS?
7 QC tools can be carried out during the quality management, quality improvement process, six sigma implementation processes or even the regular PDCA cycle for the quality purpose for enhanced quality management.
In the first phase of measuring and identifying, Fishbone Diagram also known as cause and effect diagram, Pareto Chart and Control Chart can be utilized. In the next phases of assessment and analysis, Scatter Diagram, Histogram and Checklist can be carried out. The Control Chart can be utilized consistent quality improvement.
BENEFITS OF 7 QC TOOLS
The 7 QC tools are structured and fundamental instruments that help businesses improve their management and production process for achieving enhanced product quality.
From assessing and examining the production process, identification of key challenges and problems to controlling the fluctuation present in the product quality and providing solutions for prevention of defects in future, the easy to understand and implement, 7 QC tools are very effective. Some of the major business benefits of 7 QC tools are listed below.
Provides a more structured path for problem-solving and quality improvement
Easy to understand as well as implement yet extremely effective
A scientific and logical approach for problem-solving
Follows the 80/20 rule i.e. gain 80% result with 20% efforts
Improve the quality of product and services
Helps in identifying and analyzing problems during the process
Fishbone training aides in root cause analysis and problem-solving
Encourages team spirit and fosters a healthy culture
Identifies roots cause and solve it permanently
Enhance customer experience and customer satisfaction
Based on the data-driven process and customer-centric approach, 7 QC tools implementation is one of the most effective processes that too in the shortest amount of time.
4C team of certified professionals has provided 80+ implementation of 7 QC Tools and 120+ 7 QC Tools Training. By solving 200+ quality problems, 4C has empowered clients to reduce the 80% cost of poor quality. To accelerate your quality management process and reduce your cost of poor quality, contact our experts now.
#iso certification#iso certification consultants#iso consultancy#iso consultant#iso certificate online#iso certification in india
3 notes
·
View notes
Text
Istilah dan metode dalam Statistika:
1. Data
2. Variabel
3. Rata-rata (Mean)
4. Median
5. Modus
6. Standar Deviasi
7. Distribusi Normal
8. Regresi
9. Korelasi
10. Uji Hipotesis
11. Interval Kepercayaan
12. Chi-Square
13. ANOVA
14. Regresi Linier
15. Metode Maximum Likelihood (ML)
16. Bootstrap
17. Pengambilan Sampel Acak Sederhana
18. Distribusi Poisson
19. Teorema Pusat Batas
20. Pengujian Non-parametrik
21. Analisis Regresi Logistik
22. Statistik Deskriptif
23. Grafik
24. Pengambilan Sampel Berstrata
25. Pengambilan Sampel Klaster
26. Statistik Bayes
27. Statistik Inferensial
28. Statistik Parametrik
29. Statistik Non-Parametrik
30. Pengujian A/B (A/B Testing)
31. Pengujian Satu Arah dan Dua Arah
32. Validitas dan Reliabilitas
33. Peramalan (Forecasting)
34. Analisis Faktor
35. Regresi Logistik Ganda
36. Model Linier General (GLM)
37. Korelasi Kanonikal
38. Uji T
39. Uji Z
40. Uji Wilcoxon
41. Uji Mann-Whitney
42. Uji Kruskal-Wallis
43. Uji Friedman
44. Uji Chi-Square Pearson
45. Uji McNemar
46. Uji Kolmogorov-Smirnov
47. Uji Levene
48. Uji Shapiro-Wilk
49. Uji Durbin-Watson
50. Metode Kuadrat Terkecil (Least Squares Method)
51. Uji F
52. Uji t Berpasangan
53. Uji t Independen
54. Uji Chi-Square Kemerdekaan
55. Analisis Komponen Utama (PCA)
56. Analisis Diskriminan
57. Pengujian Homogenitas Varians
58. Pengujian Normalitas
59. Peta Kendali (Control Chart)
60. Grafik Pareto
61. Sampling Proporsional Terhadap Ukuran (PPS)
62. Pengambilan Sampel Multistage
63. Pengambilan Sampel Sistematis
64. Pengambilan Sampel Stratified Cluster
65. Statistik Spasial
66. Uji K-Sample Anderson-Darling
67. Statistik Bayes Empiris
68. Regresi Nonlinier
69. Regresi Logistik Ordinal
70. Estimasi Kernel
71. Pengujian Kuadrat Terkecil Penilaian Residu (LASSO)
72. Analisis Survival (Survival Analysis)
73. Regresi Cox Proportional Hazards
74. Analisis Multivariat
75. Pengujian Homogenitas
76. Pengujian Heteroskedastisitas
77. Interval Kepercayaan Bootstrap
78. Pengujian Bootstrap
79. Model ARIMA (Autoregressive Integrated Moving Average)
80. Skala Likert
81. Metode Jackknife
82. Statistik Epidemiologi
83. Statistik Genetik
84. Statistik Olahraga
85. Statistik Sosial
86. Statistik Bisnis
87. Statistik Pendidikan
88. Statistik Medis
89. Statistik Lingkungan
90. Statistik Keuangan
91. Statistik Geospasial
92. Statistik Psikologi
93. Statistik Teknik Industri
94. Statistik Pertanian
95. Statistik Perdagangan dan Ekonomi
96. Statistik Hukum
97. Statistik Politik
98. Statistik Media dan Komunikasi
99. Statistik Teknik Sipil
100. Statistik Sumber Daya Manusia
101. Regresi Logistik Binomialis
102. Uji McNemar-Bowker
103. Uji Kolmogorov-Smirnov Lilliefors
104. Uji Jarque-Bera
105. Uji Mann-Kendall
106. Uji Siegel-Tukey
107. Uji Kruskal-Wallis Tingkat Lanjut
108. Statistik Proses
109. Statistik Keandalan (Reliability)
110. Pengujian Bootstrap Berkasus Ganda
111. Pengujian Bootstrap Berkasus Baku
112. Statistik Kualitas
113. Statistik Komputasi
114. Pengujian Bootstrap Kategorikal
115. Statistik Industri
116. Metode Penghalusan (Smoothing Methods)
117. Uji White
118. Uji Breusch-Pagan
119. Uji Jarque-Bera Asimetri dan Kurtosis
120. Statistik Eksperimental
121. Statistik Multivariat Tidak Parametrik
122. Statistik Stokastik
123. Statistik Peramalan Bisnis
124. Statistik Parametrik Bayes
125. Statistik Suku Bunga
126. Statistik Tenaga Kerja
127. Analisis Jalur (Path Analysis)
128. Statistik Fuzzy
129. Statistik Ekonometrika
130. Statistik Inflasi
131. Statistik Kependudukan
132. Statistik Teknik Pertambangan
133. Statistik Kualitatif
134. Statistik Kuantitatif
135. Analisis Ragam Keterkaitan (Canonical Correlation Analysis)
136. Uji Kuadrat Terkecil Parsial (Partial Least Squares Regression)
137. Uji Haar
138. Uji Jarque-Bera Multivariat
139. Pengujian Bootstrap Berkasus Acak
140. Pengujian Bootstrap Berkasus Tak Baku
3 notes
·
View notes
Text

➡️ Pareto Chart and Principles explained with Case Study
#lean six sigma#excellence#tutorial#kaizen#iso9001#leansixsigma#tutorials#leanmanufacturing#5s#oee#industrialengineering#pokayoke#7qctools#histogram#tpm#iatf16949#g8d#iatf#qms#vsmstudy#flowchart#histograms#smartgoal#DMAIC#5Why#BlackBelt#GreenBelt#YellowBelt
3 notes
·
View notes
Text
Master Quality Control with 7QC Tools Training by 4C Consulting

In the competitive world of manufacturing and production, maintaining high quality standards is crucial for success. The 7QC Tools Training offered by 4C Consulting equips professionals with essential tools for effective quality control and process improvement. This blog provides a comprehensive overview of the 7QC Tools, their importance, and how the training can benefit organizations in achieving superior quality management.
Understanding 7QC Tools
Definition: The 7QC Tools (Seven Quality Control Tools) are fundamental instruments used in quality management and problem-solving processes. These tools are widely recognized for their simplicity, effectiveness, and ability to aid in data analysis and decision-making.
The Seven Tools:
Cause-and-Effect Diagram (Fishbone/Ishikawa Diagram): Identifies potential causes of a problem to find the root cause.
Check Sheet: A structured, prepared form for collecting and analyzing data.
Control Chart: Monitors process variation and stability over time.
Histogram: Graphically displays the distribution of data.
Pareto Chart: Highlights the most significant factors in a data set.
Scatter Diagram: Analyzes the relationship between two variables.
Flow Chart (Process Mapping): Visualizes the steps in a process.
Importance of 7QC Tools
Problem Identification and Resolution: Helps in identifying the root causes of quality issues and developing effective solutions.
Data-Driven Decisions: Provides a basis for making decisions based on actual data rather than assumptions.
Process Improvement: Facilitates continuous improvement in processes, leading to higher efficiency and reduced waste.
Enhanced Product Quality: Ensures that products meet or exceed customer expectations by controlling and improving quality.
Employee Engagement: Involves employees in quality control processes, fostering a culture of quality and accountability.
Customer Satisfaction: Leads to higher customer satisfaction by consistently delivering high-quality products and services.
7QC Tools Training
Understanding 7QC Tools:
Cause-and-Effect Diagram: Learn to create and analyze fishbone diagrams to identify root causes of problems.
Check Sheet: Understand the design and use of check sheets for data collection and analysis.
Control Chart: Gain skills in developing and interpreting control charts to monitor process variation.
Histogram: Learn to construct histograms and analyze data distribution patterns.
Pareto Chart: Understand the 80/20 rule and how to apply it using Pareto charts.
Scatter Diagram: Develop skills in plotting and interpreting scatter diagrams to identify relationships between variables.
Flow Chart: Learn to create process maps to visualize and improve workflows.
Importance of Training:
Practical Skills: Provides hands-on experience in using each of the 7QC tools effectively.
Analytical Thinking: Enhances analytical and critical thinking skills required for quality management.
Improvement Projects: Equips participants with the knowledge to lead and participate in process improvement projects.
Certification: Validates the skills and knowledge acquired, adding value to professional credentials.
Why Choose 4C Consulting?
4C Consulting offers comprehensive 7QC Tools Training designed to empower professionals with the knowledge and skills needed for effective quality control. Our expert trainers bring extensive industry experience, ensuring practical and relevant learning. We provide customized training solutions tailored to meet the specific needs of your organization, fostering a culture of continuous improvement. By choosing 4C Consulting, you gain access to the best practices in quality management, helping your organization achieve excellence in product quality and customer satisfaction. Contact us now.
0 notes
Text
Synthetic Biology Market Outlook On Rising Application, Revolutionary Trends & Potential Growth Ways 2032
According to the research report, the global synthetic biology market was valued at USD 15.47 billion in 2023 and is expected to reach USD 71.51 billion by 2032, to grow at a CAGR of 18.6%during the forecast period.
Our newly published research report titled Synthetic Biology Market Insights offers a comprehensive analysis of the rapidly growing market. It highlights all the key factors anticipated to drive growth while shedding light on potential challenges and opportunities that could emerge in the market in the upcoming years. The market assessment includes a thorough analysis of Synthetic Biology market share, size, gross margin, and CAGR. The research report has been prepared using industry-standard methodologies to offer a thorough assessment of the major market participants and their market scope.
All the data and information provided in the study are curated and verified by expert analysts to provide a reliable and accurate market analysis. Also, pictorial representations such as tables, charts, and graphs have been used to enhance decision making and improve business strategy. The research report is a must-read for anyone involved or interested in the market in any form.
Key Report Features:
Comprehensive Market Data: Provides a thorough market examination of annual sales, current market size, and anticipated Synthetic Biology market growth rate during the forecast period.
Regional Analysis: Thorough analysis of all the major regions and sub-regions in the market.
Company Profiles: An in-depth assessment of all the leading market participants and emerging businesses.
Customization: Report customization as per your requirements with respect to countries, regions, and segmentation.
Major Market Participants:
The research report includes a comprehensive competitive landscape section that helps businesses understand their competitors and the market in which they operate. All the major Synthetic Biology market players have been covered in the report. By going through the competitive landscape, businesses can identify their competitors and understand their strengths and weaknesses. Also, businesses can better examine the products/services of their competitors and evaluate their offers and pricing. All the major competitive analysis frameworks, including SWOT analysis and PESTEL analysis, have been included in the research study to offer a thorough assessment of the market’s competitive scenario. Here are a few of the key players operating in the market:
Browse Full Insights
The top players operating in the market are:
Biosciences Inc.
Codexis Inc.
Creative Biogene
CREATIVE ENZYMES
Enbiotix Inc.
Illumina Inc.
Merck Kgaa (Sigma-Aldrich Co. LLC)
New England Biolabs
Euro fins Scientific
Novozymes
Pareto Bio Inc.
Market Dynamics:
Growth Drivers: The research report sheds light on all the major factors driving the robust growth of the market. Also, all the key trends and opportunities anticipated to have a favorable impact on market Synthetic Biology development have been covered in the study.
Technological Advancements: All the major advances in technology that can support market growth have been covered in the research report. Besides, the introduction of new products/services by major participants has been detailed.
Regulatory Policies: The research report examines the regulatory landscape of the constantly evolving market, shedding light on new market frameworks and policies projected to drive the market forward.
Segmental Overview:
This section of the research report categorizes the market into various segments, such as end use, product type, application, and region. Also, a thorough analysis of all the major sub-segments has been provided in the study. By going through the segmental analysis section, businesses and stakeholders can easily examine different Synthetic Biology market segments and identify consumer requirements within each of them. Besides, businesses can optimize their brand positioning and tailor their marketing efforts to specific segments. What’s more, companies can use market segmentation to identify gaps in their offerings that can developed up on.
Report Answers Questions Such As:
• What is the current market size and projected value? • What are the major factors driving Synthetic Biology market sales and demand? • What are the key developments and trends driving the market forward? • What are the key outcomes of the PESTEL analysis for the market? • Who are the major players offering their products/services in the market? • What are the major opportunities that market participants can capitalize on?
Report Summary:
The Synthetic Biology market research report is a reliable resource to understand the dynamic nature of the market. It covers several key market features, including capacity, revenue, price, consumption, production rate, and supply demand, to provide an in-depth market analysis. By going through the research study, readers can get a precise and reliable analysis of the rapidly evolving market.
More Trending Latest Reports By Polaris Market Research:
Electric Vehicles Battery Recycling Market
Jars Market
Smart Home Automation Market
Protein A, G, and L Resins Market
Automated Waste Collection Systems Market
3D Machine Vision Market
Cashmere Clothing Market
Gunshot Detection System Market
0 notes
Text
Digital Tools for Automating 7 QC Tools Usage
The 7 Quality Control (QC) tools are fundamental instruments for problem-solving, process improvement, and quality management in industries worldwide. With advancements in digital technologies, leveraging software and automation for these tools can significantly enhance efficiency, accuracy, and decision-making. This article explores digital tools that automate the usage of the 7 QC tools, their benefits, and practical applications.
Understanding the 7 QC Tools
Before diving into digital tools, let’s briefly revisit the 7 QC tools:
Check Sheets - Used for data collection and analysis.
Pareto Charts - Helps identify the most significant factors in a dataset.
Cause-and-Effect Diagrams (Fishbone/Ishikawa) - Identifies root causes of problems.
Control Charts - Monitors process variation over time.
Histograms - Visualizes the distribution of data.
Scatter Diagrams - Identifies relationships between two variables.
Flowcharts - Maps out processes to understand and improve them.
Digital Tools for Automating the 7 QC Tools
1. Microsoft Excel and Google Sheets
Excel and Google Sheets remain versatile tools for automating calculations, visualizations, and data organization. Their built-in templates, formulas, and charting capabilities are highly adaptable for:
Creating Check Sheets with dropdowns and conditional formatting.
Generating Pareto Charts using pivot tables.
Designing Control Charts with dynamic ranges.
2. Minitab
Minitab is a statistical software specifically designed for quality improvement. It offers:
Automated creation of Control Charts.
Quick generation of Histograms and Scatter Diagrams.
Integrated tools for Cause-and-Effect analysis.
3. Lucidchart
Lucidchart simplifies the creation of Flowcharts and Cause-and-Effect Diagrams. Features include:
Drag-and-drop interface for diagramming.
Cloud-based collaboration for team inputs.
Integration with tools like Google Drive and Slack.
4. Tableau and Power BI
These data visualization platforms excel in presenting insights visually:
Build Pareto Charts to prioritize issues.
Create Scatter Diagrams to analyze variable relationships.
Generate interactive dashboards to monitor quality metrics.
5. Qlik Sense
Qlik Sense is another data analytics tool that:
Automates Histogram generation from large datasets.
Offers predictive analytics to enhance Scatter Diagram insights.
Allows for real-time monitoring with Control Charts.
6. Fishbone Diagram Software
Dedicated tools like XMind and Edraw Max specialize in:
Interactive Fishbone Diagrams.
Collaboration for brainstorming root causes.
Exporting diagrams in various formats for reports.
7. Custom Quality Management Software
Platforms like Qualityze and MasterControl provide:
Comprehensive QC tool integration.
Automated workflows for Check Sheets and Flowcharts.
Scalability for enterprise-level quality management.
Benefits of Automating QC Tools
Improved Accuracy: Reduces human error through automation.
Time Efficiency: Accelerates data analysis and visualization.
Enhanced Collaboration: Cloud-based tools allow teams to work together seamlessly.
Data Integration: Combines data from various sources for holistic analysis.
Real-Time Monitoring: Enables immediate insights into process performance.
Practical Applications in Industries
Manufacturing:
Automating Control Charts to monitor production quality.
Using Pareto Charts to identify key defects.
Healthcare:
Employing Flowcharts for patient care workflows.
Leveraging Check Sheets for data collection on recurring issues.
IT and Software:
Using Scatter Diagrams to analyze system performance metrics.
Automating Fishbone Diagrams for debugging processes.
Retail:
Monitoring sales processes with Histograms.
Improving inventory management using Pareto analysis.
Conclusion
Digital tools have revolutionized the application of the 7 QC tools by offering automation, accuracy, and collaborative capabilities. Businesses that integrate these technologies into their quality management processes can achieve superior efficiency and better decision-making. Investing in the right software not only streamlines operations but also paves the way for continuous improvement and long-term success.
0 notes
Text
Six Sigma Quality Tools: A Guide to Elevating Business Processes
https://businessviewpointmagazine.com/wp-content/uploads/2024/11/33-Six-Sigma-Quality-Tools_-A-Guide-to-Elevating-Business-Processes-Image-by-Funtap-from-Getty-Images.jpg
Latest News
News
Stock Market Update: Nifty 50 Movement, Trade Setup, and Top Stock Picks
News
Markets on Edge: Indian Indices Dip, Bitcoin Hits Record, and Global Trends Shape the Week Ahead
News
BlueStone Jewellery Plans ₹1,000 Crore IPO with Fresh Issue and OFS
Source: Funtap-from-Getty-Images
In the competitive business landscape, quality management plays a pivotal role in ensuring that companies deliver exceptional products and services. One of the most effective methodologies that businesses across the globe, including India, have adopted to enhance operational efficiency and product quality is Six Sigma. Central to this methodology are the Six Sigma quality tools, which help in identifying defects, improving processes, and ensuring that companies meet customer expectations.
This article delves into the key Six Sigma quality tools, their relevance to Indian industries, and how businesses can leverage these tools to boost productivity, reduce waste, and improve profitability.
What is Six Sigma?
Before diving into the Six Sigma quality tools, it is essential to understand the concept of Six Sigma. Six Sigma is a data-driven methodology that aims at improving business processes by eliminating defects and reducing variation. Originally developed by Motorola in the 1980s, Six Sigma has since been adopted by companies worldwide, including several Indian businesses across sectors like manufacturing, healthcare, and IT services.
Six Sigma follows the DMAIC framework (Define, Measure, Analyze, Improve, Control) to drive process improvements. At the heart of this methodology are the Six Sigma quality tools that help organizations make data-driven decisions, identify problem areas, and ensure continuous improvement.
The Importance of Six Sigma Quality Tools for Indian Businesses
India, being one of the fastest-growing economies, faces stiff competition both globally and domestically. As businesses strive to improve their products and services while minimizing costs, the need for effective quality management has never been more critical. Here, Six Sigma quality tools come into play.
These tools help Indian businesses:
Reduce defects in production and service delivery processes.
Streamline operations, thereby lowering costs and improving efficiency.
Enhance customer satisfaction by ensuring that products and services meet or exceed customer expectations.
Drive innovation by encouraging continuous improvement in processes.
Now, let’s take a closer look at the six key Six Sigma quality tools that businesses can use to improve their operations.
1. Pareto Chart

The Pareto Chart is a powerful tool used to identify the most significant factors contributing to a problem. It is based on the Pareto Principle, which states that 80% of the problems come from 20% of the causes. By focusing on these vital few causes, businesses can prioritize their efforts for maximum impact.
For instance, in Indian manufacturing sectors, companies can use Pareto Charts to identify the most common defects in their production lines. By addressing these key issues, they can significantly reduce defects and enhance product quality.
2. Fishbone Diagram (Cause-and-Effect Diagram)
Also known as the Ishikawa or Fishbone Diagram, this tool helps in identifying the root causes of a problem. It breaks down problems into various categories such as materials, methods, machines, and manpower, making it easier to pinpoint the cause of the issue.
In Indian industries like pharmaceuticals or IT services, where multiple variables affect the final outcome, the Fishbone Diagram is an effective way to map out all possible factors and prioritize the ones that need attention.
3. Control Charts
Control charts, also known as Shewhart charts, are used to monitor process behavior over time and identify any variations that may lead to defects. This is one of the most effective Six Sigma quality tools for ensuring that a process remains within specified limits and that any deviations are detected early.
In sectors like healthcare, where quality and consistency are of utmost importance, control charts help Indian hospitals and clinics ensure that their processes, such as patient care or medical testing, remain consistent and meet the highest standards.
4. Failure Mode and Effects Analysis (FMEA)

FMEA is a systematic tool used to identify potential failures in a process and evaluate their impact on the final product or service. It helps businesses prioritize which failures to address based on their severity, occurrence, and detectability.
Indian automotive and electronics companies, for example, can use FMEA to assess risks in their product development processes and take preventive measures to avoid costly failures. This not only improves product reliability but also boosts customer satisfaction.
5. Histogram
A histogram is a graphical representation of data that shows the frequency distribution of a set of variables. It helps businesses understand the distribution of data and identify patterns or variations that may require corrective action.
In industries such as textiles or FMCG (Fast Moving Consumer Goods) in India, histograms can be used to analyze product quality data, such as the weight or size of products, and ensure that they meet the required specifications.
6. 5 Whys
The 5 Whys technique is a simple yet effective tool for uncovering the root cause of a problem by repeatedly asking “Why?” until the fundamental issue is identified. This tool is particularly useful in finding solutions to problems that are not immediately apparent.
Indian companies across sectors, from IT to retail, can benefit from using the 5 Whys technique to get to the bottom of operational issues, resolve them quickly, and prevent them from recurring.
Why Six Sigma Quality Tools Matter in the Indian Context
https://businessviewpointmagazine.com/wp-content/uploads/2024/11/33.3-Why-Six-Sigma-Quality-Tools-Matter-in-the-Indian-Context-Image-by-alexsl-from-Getty-Images-Signature.jpg
Indian businesses are constantly under pressure to deliver high-quality products and services at competitive prices. By adopting the Six Sigma quality tools, companies can achieve several significant benefits:
Cost Savings: Reducing defects and improving process efficiency translates to lower operational costs. This is especially crucial in price-sensitive markets like India.
Improved Quality: By focusing on quality improvements, businesses can ensure customer satisfaction, leading to increased loyalty and repeat business.
Global Competitiveness: Indian companies aiming to expand globally need to meet international quality standards. Six Sigma quality tools help them achieve this by maintaining high levels of consistency and reliability.
Employee Engagement: Implementing Six Sigma encourages a culture of continuous improvement, where employees are actively involved in problem-solving and process enhancement.
Conclusion
In a rapidly evolving business environment like India, maintaining quality and efficiency is crucial for long-term success. By leveraging the Six Sigma quality tools, companies can not only improve their processes but also reduce costs, enhance customer satisfaction, and stay ahead of the competition. Whether it’s a manufacturing unit aiming to reduce defects or an IT services firm looking to streamline operations, these tools provide a structured and data-driven approach to continuous improvement.
By focusing on eliminating defects and enhancing efficiency, Indian businesses can unlock their true potential and create a lasting impact in the global market.
Did you find this article helpful? Visit more of our blogs! Business Viewpoint Magazine
#leansixsigma#lean#leanmanufacturing#leadership#training#kaizen#s#iso#greenbelt#projectmanagement#processimprovement#quality#o#business#kanban#pdca#blackbelt#innovation#management#growth
0 notes
Text
From Dreams to Reality: Proven Principles for Lasting Success

Everyone has dreams—visions of a future where aspirations are achieved, goals are conquered, and life feels fulfilling. Yet, many dreams remain unfulfilled, not because they are unattainable but because the journey from imagination to realization requires intention, effort, and adherence to specific principles. Here, we explore the proven principles that can help you transform your dreams into lasting success.
1. Clarity of Vision
Success begins with a clear vision. Before embarking on any journey, you must define your destination. What does success look like for you? Is it a thriving career, financial freedom, meaningful relationships, or personal growth? Write down your goals in vivid detail. The more specific your vision, the easier it becomes to chart a path toward achieving it.
A clear vision acts as a compass, keeping you aligned even when distractions or challenges arise. Remember, vague goals yield vague results. Take time to visualize your dream life, and don’t be afraid to dream big—ambition fuels innovation and creativity.
2. Develop a Growth Mindset
A growth mindset is essential for lasting success. Coined by psychologist Carol Dweck, this principle emphasizes the belief that abilities and intelligence can be developed through dedication and hard work. Instead of fearing failure, embrace it as a learning opportunity.
When setbacks occur, analyze what went wrong, adapt your approach, and keep moving forward. Cultivate resilience by reminding yourself that progress is more important than perfection. Celebrate small wins and learn to view challenges as stepping stones rather than roadblocks.
3. Strategic Planning and Action
Dreams without actionable steps remain fantasies. Break down your goals into smaller, manageable tasks and create a roadmap to guide your efforts. Use tools like timelines, checklists, or digital planners to stay organized and track your progress.
Prioritize your tasks based on their importance and urgency. The Eisenhower Matrix, a simple tool that categorizes tasks, can help you focus on what truly matters. Remember, consistent action—even small steps taken daily—compounds over time and leads to significant results.
4. Cultivate Self-Discipline
Self-discipline is the bridge between goals and achievement. It requires you to stay committed to your vision, even when motivation wanes. Establish routines that align with your goals and minimize distractions that detract from your focus.
One effective strategy is the 80/20 rule, also known as the Pareto Principle. Identify the 20% of actions that yield 80% of your results and concentrate your energy on those tasks. By managing your time and energy wisely, you’ll maintain momentum toward success.
5. Surround Yourself With the Right People
The people you associate with significantly influence your mindset and actions. Surround yourself with individuals who inspire, support, and challenge you to grow. Seek mentors who have achieved what you aspire to and learn from their experiences.
Conversely, distance yourself from negativity and toxic relationships. A supportive environment fosters motivation and accountability, making it easier to stay on track. Remember the adage: “You are the average of the five people you spend the most time with.”
6. Embrace Continuous Learning
The path to success is ever-evolving, requiring you to adapt and grow constantly. Invest in your personal and professional development through books, courses, workshops, and networking. Stay curious and open-minded, seeking opportunities to expand your knowledge and skills.
Successful individuals prioritize learning not only to stay competitive but also to nurture innovation and creativity. As the world changes, your ability to adapt and innovate will set you apart and keep you moving toward your goals.
7. Master the Art of Perseverance
The journey from dreams to reality is rarely smooth. Obstacles, failures, and moments of doubt are inevitable. What sets achievers apart is their ability to persevere through adversity.
When faced with challenges, remind yourself why you started. Reflect on your progress and the potential rewards of staying the course. Develop mental toughness by practicing mindfulness, stress management, and maintaining a positive outlook. Remember, every great success story is filled with moments of struggle and perseverance.
8. Adopt an Abundance Mindset
An abundance mindset focuses on opportunities rather than limitations. It encourages you to see possibilities instead of obstacles and fosters gratitude for what you already have. This perspective empowers you to take calculated risks and step outside your comfort zone.
Shift your focus from scarcity—fearing there’s never enough—to abundance, believing there’s more than enough success, opportunities, and resources for everyone. This change in perspective can unlock creativity and inspire bold actions that propel you toward your dreams.
9. Practice Gratitude and Reflection
Gratitude is a powerful force that can enhance your outlook and strengthen your resilience. Regularly acknowledge and appreciate your achievements, no matter how small. Gratitude fosters contentment while fueling the motivation to keep striving for more.
Additionally, take time to reflect on your journey. Journaling, meditating, or discussing your experiences with a trusted friend or mentor can provide valuable insights and help you identify areas for improvement. Reflection ensures you remain aligned with your goals and values.
10. Focus on Long-Term Impact
True success is not just about achieving your dreams; it’s about creating a lasting impact. Consider how your actions and achievements contribute to the greater good. Whether it’s mentoring others, giving back to your community, or leaving a legacy, aligning your goals with a higher purpose enhances fulfillment and significance.
Think about the ripple effect of your efforts. When your vision extends beyond personal gain, you’ll find deeper motivation and satisfaction in your accomplishments.
Conclusion
Turning dreams into reality requires more than wishful thinking—it demands clarity, discipline, perseverance, and a commitment to personal growth. By embracing these proven principles, you can navigate the journey from aspiration to achievement with confidence and purpose.
Remember, the path to success is not a sprint but a marathon. Celebrate your progress, learn from your setbacks, and stay dedicated to your vision. With the right mindset and strategies, you can transform your dreams into lasting success and inspire others to do the same.
Best success principle 2025
1 note
·
View note
Text
how to drag serial number in ms excel
youtube
#bpo jobs#youtube#bpo interview questions and answers#bpo interview tips for freshers#bpo services#bpo tutorials#ms excel#vlookup#serial number#ms excel tricks#call center vacancy#call calibration#call center jobs#pareto chart#call center#bpo interview#bpo trends#bpo
0 notes
Text
Microsoft Excel Advanced Course - Elevate Your Excel Mastery
Microsoft Excel is a cornerstone of productivity in the business world. From data analysis to financial modeling, Excel’s capabilities are vast. However, to truly leverage its potential, you need advanced knowledge beyond the basics. Whether you’re a professional looking to improve efficiency or a student aiming to gain an edge, enrolling in a Microsoft Excel Advanced Course can significantly enhance your skillset. This article explores the benefits of such a course, what it covers, and how it can propel your career forward.
Why an Advanced Excel Course is a Must-Have
While many people are familiar with Excel’s basic functions, few fully grasp its advanced features. Mastering these can drastically improve your work efficiency and the quality of your output. Here’s why you should consider taking a Microsoft Excel Advanced Course:
Enhanced Data Management: Learn how to manage and analyze large datasets with advanced functions like PivotTables, Power Query, and data modeling.
Increased Efficiency: Automate repetitive tasks using macros and VBA, saving time and reducing errors.
Better Decision-Making: Use advanced data analysis tools to derive insights and make informed business decisions.
Career Advancement: Excel proficiency is highly valued by employers, making it a critical skill for career growth.
By upgrading your Excel skills, you position yourself as a more competent and valuable professional in any industry.
What You’ll Learn in a Microsoft Excel Advanced Course
A Microsoft Excel Advanced Course is designed to equip you with expert-level skills that can be applied across various professional scenarios. Here’s an overview of the core topics typically covered:
1. Advanced Formulas and Functions
Complex Formulas: Learn to create and troubleshoot complex formulas involving multiple functions.
Logical Functions: Master functions like IF, AND, OR, and XOR to create dynamic spreadsheets.
Text Functions: Manipulate text data with functions like LEFT, RIGHT, MID, and CONCATENATE.
2. Data Analysis Techniques
PivotTables: Deep dive into PivotTables to summarize, filter, and analyze large datasets.
Power Query: Automate data import, cleaning, and transformation tasks with Power Query.
What-If Analysis: Use tools like Goal Seek, Solver, and Data Tables to evaluate different business scenarios.
3. Macros and VBA Programming
Macro Recording: Record macros to automate routine tasks with a single click.
Introduction to VBA: Learn the basics of Visual Basic for Applications (VBA) to write custom scripts for Excel.
Custom Functions: Create your own Excel functions using VBA to solve specific problems efficiently.
4. Data Visualization
Advanced Charts: Create sophisticated charts like histograms, Gantt charts, and Pareto charts.
Conditional Formatting: Use advanced conditional formatting to highlight key data trends and outliers.
Dashboards: Design interactive dashboards that consolidate key metrics and make data-driven insights easily accessible.
5. Data Validation and Security
Data Validation: Set up rules to ensure the integrity and accuracy of data entry.
Workbook Protection: Learn how to protect sensitive data using Excel’s built-in security features.
Collaboration Tools: Manage and track changes in shared workbooks effectively.
Who Should Enroll in a Microsoft Excel Advanced Course?
This course is ideal for anyone who regularly works with data, including:
Business Analysts: Improve your ability to analyze complex datasets and present findings.
Financial Professionals: Enhance your financial modeling skills and automate processes.
Project Managers: Track project data, budgets, and timelines more efficiently.
Entrepreneurs: Gain the skills to manage and analyze business data for better decision-making.
An advanced Excel course can make a significant impact on your productivity and career trajectory, no matter your field.
Benefits of a Microsoft Excel Advanced Course
Here’s why investing in an advanced Excel course is worthwhile:
Boosted Efficiency: Automate tasks, streamline workflows, and save valuable time.
Improved Data Accuracy: Learn to manage data more effectively, reducing errors and inconsistencies.
Career Growth: Excel proficiency is a marketable skill that can lead to promotions and higher-paying roles.
Certification: Upon completion, many courses offer certification, validating your expertise and enhancing your resume.
How to Choose the Right Microsoft Excel Advanced Course
When selecting a course, consider the following:
Course Curriculum: Ensure the course covers advanced topics relevant to your work or interests.
Instructor Qualifications: Opt for courses taught by industry experts with real-world experience.
Learning Format: Decide between online or in-person classes based on your learning style and schedule.
Course Duration: Consider how much time you can commit; courses can range from a few weeks to several months.
Cost: Compare pricing to find a course that offers good value for your investment.
Frequently Asked Questions (FAQ)
1. What prerequisites are needed for a Microsoft Excel Advanced Course?
A solid understanding of basic Excel functions and formulas is recommended. Familiarity with intermediate features like PivotTables and basic data analysis will also be beneficial.
2. How long does it take to complete the course?
The duration varies, but most advanced Excel courses take 4 to 8 weeks, depending on the content and pace of learning.
3. Do I get a certification after completing the course?
Yes, most reputable courses offer a certification upon successful completion, which can be added to your professional profile.
4. Can I take the course online?
Absolutely. Many advanced Excel courses are available online, providing the flexibility to learn at your own pace.
5. How will this course benefit my career?
Mastering advanced Excel skills can improve your job performance, make you a more competitive candidate, and open up new career opportunities in data-intensive roles.
Conclusion
A Microsoft Excel Advanced Course is an essential investment for anyone looking to maximize their efficiency and effectiveness in the workplace. By mastering Excel’s advanced features, you can automate tasks, analyze data with precision, and present your findings in a compelling way. Whether you’re a business professional, analyst, or entrepreneur, these skills will not only enhance your productivity but also boost your career prospects. Don’t miss out on the opportunity to advance your Excel skills—enroll in a Microsoft Excel Advanced Course today and take your expertise to the next level!
0 notes
Text
Week 2 post


1.3 Project: Research and Analysis
Capstone Santa Rosa Medical Group

Kariann Martin
# 0005284367
August 10, 2024
Introduction
Santa Rosa Medical Group (SRMG) currently operates a patient referral and medical transport service that connects patients to specialized care facilities. While this process is crucial for ensuring timely treatment, the current model has inefficiencies that lead to delays and increased operational costs. Below, I will outline the existing process flow, highlight its shortcomings, and propose a more efficient business model to address these issues.
Current Process Flow: Patient Referral and Medical Transport
The current process flow for SRMG’s patient referral and medical transport service is as follows:
Patient Assessment (Start): A patient visits a primary care facility.
Diagnosis: The medical professional conducts initial diagnosis.
Referral Decision: Based on the diagnosis, the patient is either referred to a specialist or treated on-site.
Referral Authorization: The referral is sent for authorization, which involves communication with insurance providers.
Transport Arrangement: Upon authorization, the medical transport team is contacted to arrange patient transfer.
Transport Confirmation: The transport team confirms availability, often leading to delays due to scheduling conflicts.
Patient Transfer: The patient is transported to the specialized facility.
Admission to Specialized Facility: The patient is admitted, and treatment begins.
Follow-up Coordination: The primary care provider coordinates follow-up care.
Billing & Insurance Processing (End): Billing information is processed and sent to insurance for reimbursement.

Shortcomings of the Current Process:
Delay in Authorization: The referral authorization step often leads to significant delays due to slow communication with insurance providers.
Transport Scheduling Conflicts: Scheduling conflicts with the transport team cause further delays, impacting patient outcomes.
High Operational Costs: The lack of an integrated system for communication among stakeholders increases operational costs due to inefficiencies.
Lack of Data Integration: The process lacks real-time data integration, leading to redundant paperwork and miscommunication.
Santa Rosa Medical Group Building:
Medical Transport Service

Proposed Business Model
To address the inefficiencies in the current patient referral and medical transport process, I propose a new business model that integrates real-time data communication, automates key steps, and optimizes resource allocation. This model will significantly reduce delays, lower operational costs, and improve patient outcomes.
Implementing Six Sigma in SRMG's medical transport process can significantly streamline operations, reduce wait times, and improve patient outcomes. Here's a detailed implementation plan using the DMAIC methodology:
Define
Issue: Delayed patient transport
Objective: Improve transport efficiency
Measure
Data Points:
Average wait time
Number of transports per day
Transport delays
Patient satisfaction scores
Analyze
Tools: Fishbone Diagram, Pareto Analysis
Root Causes: Insufficient vehicles, inadequate scheduling, communication gaps, untrained staff
Improve
Solutions:
Exclusive Transport Services
Revised Discharge Policy
Improved Scheduling System
Staff Training
Implementation: Phased rollout
Control
Monitoring: Continuous tracking of KPIs
Feedback Loop: Regular feedback from patients and staff
Average Wait Time (Hours)
The chart shows the average wait time for each month with control limits based on the standard deviation from the mean.
Transports per Day
This chart illustrates the number of transports per day each month, along with the control limits.
Delays (Number)
The delays per month are plotted with control limits, indicating the variation over time.
Patient Satisfaction (%)
This chart represents patient satisfaction percentages, with control limits showing the acceptable range based on the standard deviation from the mean.
Proposed Process Flow: Enhanced Patient Referral and Transport System
The new model introduces the following enhancements:
Patient Assessment (Start): Same as the current process.
Digital Diagnosis & Referral Entry: Diagnosis is entered into a centralized digital system that automatically generates a referral if needed.
Automated Referral Authorization: The system automatically communicates with insurance providers for instant authorization.
Integrated Transport Scheduling: The transport team’s schedule is integrated into the system, allowing real-time availability and reducing conflicts.
Automated Transport Confirmation: The system confirms transport availability and schedules patient transfer without delays.
Patient Transfer: The patient is transported to a specialized facility.
Real-time Admission Notification: The specialized facility notifies in real-time of the incoming patient, allowing for immediate admission.
Follow-up Coordination: The system automatically schedules follow-up appointments and communicates with the primary care provider.
Integrated Billing & Insurance Processing: Billing is processed automatically, reducing errors and speeding up reimbursement.
Data Analytics & Continuous Improvement (End): The system collects data on all steps for continuous process improvement.

Implementation of New Transport Project: The implementation of the new ETL project at Santa Rosa Medical Group will follow a systematic approach to ensure a smooth transition from the old system to the new architecture. Key steps in the implementation process may include:
Conducting a thorough assessment of current data systems and requirements to identify integration needs and potential challenges.
Designing a data migration plan to transfer existing data from legacy systems to the new EDM architecture, ensuring data integrity and minimizing downtime.
Configuring and deploying the selected ETL solution, including setting up data pipelines, transformations, and workflows according to business requirements.
Testing the new system extensively to validate data accuracy, performance, and reliability, using both synthetic and real-world data scenarios.
Providing comprehensive training and support to staff members to ensure they are proficient in using the new ETL tools and workflows.
Monitoring the implementation process closely and addressing any issues or concerns that arise promptly to minimize disruptions to operations.
Advantages of the New Model:
Reduced Delays: Automated referral and transport scheduling eliminate delays in patient transfer.
Lower Operational Costs: The integrated system reduces redundant tasks and communication errors, lowering operational costs.
Enhanced Patient Outcomes: Faster referral and transport processes improve patient outcomes by reducing time to treatment.
Data-Driven Decision Making: Real-time data integration allows for continuous monitoring and improvement of the process.
Cost Analysis
Below is a cost analysis comparing the current model with the proposed model:
Expense Current Model Proposed Model Savings/Increase
Operational $500,000 $350,000 $150,000 savings
Tech & Software $50,000 $150,000 $100,000 increase
Personnel $300,000 $280,000 $20,000 savings
Total Annual $850,000 $780,000 $70,000 savings
Current Model:


Analysis:
Initial Investment in Technology: The proposed model requires an upfront investment in technology and software. However, the long-term operational savings and improved efficiency make this investment worthwhile.
Personnel Cost Reduction: By automating certain tasks, the proposed model allows for a reduction in personnel costs, particularly in administrative roles.
Overall Savings: The proposed model leads to an overall cost reduction of $70,000 annually, while also improving patient outcomes and operational efficiency.
In summary, the proposed business model for SRMG's patient referral and medical transport system is designed to optimize operations and improve patient care, representing a valuable investment for the future. Recent analyses conducted over the past month have identified key areas within SRMG that require focus, especially concerning medical transport. By implementing strategic measures such as securing exclusive transport contracts, updating discharge protocols, and utilizing quality improvement frameworks like Six Sigma and Deming's 14 Points, SRMG can significantly boost operational efficiency and enhance patient outcomes. Ongoing monitoring and feedback mechanisms will be essential to maintain these advancements, ultimately resulting in a more dependable and effective medical transport system for SRMG.
References:
Power BI Link: https://app.powerbi.com/links/CpGCDqWWuv?ctid=9d13590e-6670-47d6-b634-ee79df018644&pbi_source=linkShare&bookmarkGuid=0425c7ee-8704-41c0-95ec-b80b642e220e
Community Health Systems Santa Rosa Medical Group and Propsal status .xlsx
Centers for Medicare & Medicaid Services. (2023). COVID-19 Healthcare Data. Retrieved from https://www.cms.gov/covid-19
Smith, J. (2023). The Hidden Costs of Big Data. Forbes. Retrieved from https://www.forbes.com/sites/forbesfinancecouncil/2023/01/15/the-hidden-costs-of-big-data/
Jones, A. (2022). How Much Does a Data Breach Cost?. Security Magazine. Retrieved from https://www.securitymagazine.com/articles/97043-how-much-does-a-data-breach-cost
Roberts, L. (2023). The Price You Pay for Poor Data Quality. Data Quality Solutions. Retrieved from https://www.dataqualitysolutions.com/the-price-you-pay-for-poor-data-quality
Yahoo Finance. (2024). Santa Rosa Medical Group (SRMG) Historical Data. Retrieved from https://finance.yahoo.com/quote/SRMG/history
Reuters. (2023). Healthcare Stocks Surge Amid Regulatory Changes. Reuters. Retrieved from https://www.reuters.com/business/healthcare-stocks-surge-2023
Kimball, R., Ross, M., & Thornthwaite, W. (1996). The Data Warehouse Toolkit: Practical Techniques for Building Dimensional Data Warehouses. Wiley.
HealthIT.gov. (n.d.). Big Data. Retrieved from https://www.healthit.gov/topic/health-it-and-health-information-exchange-basics/big-data
Oracle. (n.d.). Big Data Management. Retrieved from https://www.oracle.com/big-data/big-data-management/
Community Health Systems. (n.d.). About Us. Retrieved from https://www.chs.net/about-us/
Health Catalyst. (n.d.). Healthcare Data Warehousing. Retrieved from https://www.healthcatalyst.com/solutions/healthcare-data-warehousing
Deming, W. E. (1986). Out of the Crisis. MIT Press.
George, M. L., Rowlands, D., Price, M., & Maxey, J. (2005). The Lean Six Sigma Pocket Tool book: A Quick Reference Guide to 100 Tools for Improving Quality and Speed. McGraw-Hill.
Montgomery, D. C. (2009). Introduction to Statistical Quality Control (6th ed.). John Wiley & Sons.
Pyzdek, T., & Keller, P. A. (2018). The Six Sigma Handbook (5th ed.). McGraw-Hill Education.
Taghizadegan, S. (2006). Essentials of Lean Six Sigma. Butterworth-Heinemann.
Inmon, W. H. (2005). Building the Data Warehouse (4th ed.). John Wiley & Sons.
Kimball, R., & Ross, M. (2013). The Data Warehouse Toolkit: The Definitive Guide to Dimensional Modeling (3rd ed.). John Wiley & Sons.
Eckerson, W. W. (2010). Performance Dashboards: Measuring, Monitoring, and Managing Your Business (2nd ed.). John Wiley & Sons.
Davenport, T. H., & Harris, J. G. (2007). Competing on Analytics: The New Science of Winning. Harvard Business Review Press.
O'Brien, J. A., & Marakas, G. M. (2011). Management Information Systems (10th ed.). McGraw-Hill Education.
0 notes