#AWS CloudWatch
Explore tagged Tumblr posts
Visit Tumblr Blog
Explore Tumblr blogs with no restrictions, modern design and the best experience.
Last Seen Tumblr Blogs


Fun Fact
Tumblr was created by web developers David Karp and Marco Arment.
Video
youtube
CloudWatch Metrics Made Simple with Real-time Monitoring Full Video Link - https://youtu.be/3JBLgWFQ0cY Check out this new video on the CodeOneDigest YouTube channel! Learn how to use #cloudwatch for application health monitoring. How to create custom #metrics in AWS cloudwatch? Learn about cloudwatch #APM tool.@codeonedigest @awscloud @AWSCloudIndia @AWS_Edu @AWSSupport @AWS_Gov @AWSArchitecture
0 notes
Text
ColdFusion and AWS CloudWatch: Monitoring and Logging Best Practices
#ColdFusion and AWS CloudWatch: Monitoring and Logging Best Practices#ColdFusion and AWS CloudWatch Monitoring#ColdFusion and AWS CloudWatch Logging Best Practices#ColdFusion and AWS CloudWatch#ColdFusion AWS CloudWatch#ColdFusion#AWS CloudWatch#ColdFusion Monitoring and Logging Best Practices#AWS CloudWatch Monitoring and Logging Best Practices
0 notes
Text
Is AWS Elasticsearch Developer’s True Hero?

Elasticsearch is a free open source search engine, which is used for log analytics, full-text search, application monitoring and more. It makes easy to deploy, operate and scale Elasticsearch clusters in the AWS Cloud. We can get direct access to the Elasticsearch APIs. It provides Scalability, Availability and Security for the workload process run.
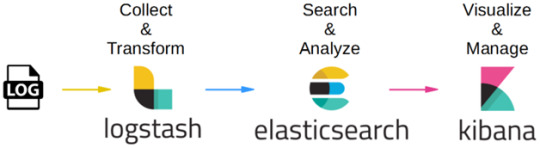
Elasticsearch architecture
The AWS Elasticsearch Service Architecture is very dynamically to allow create instances, remove instances, change instance sizes, change storage configuration and customize to make other changes. This Elasticsearch allows to search and analyse the data log. It consists of three components.
Logstash – is used to collect and transferred to the Elasticsearch.
Elasticsearch –facilitates search and analyze with the logs stored in it. It acts as a database.
Kibana –Kibana enables the data visualization on the dashboard that uses ELK stack. This tool provides a quick insight of the documents using visualization Kibana’s dashboard contains interactive diagrams, geospatial data, and graphs to visualize complex queries that let you search, view, or interact with the stored data. Kibana helps you to perform advanced data analysis and visualize your data in a variety of tables, charts, and maps.
Get started with an Elastic Cluster with AWS
First, create an AWS account and follow the following steps to claim your domain.
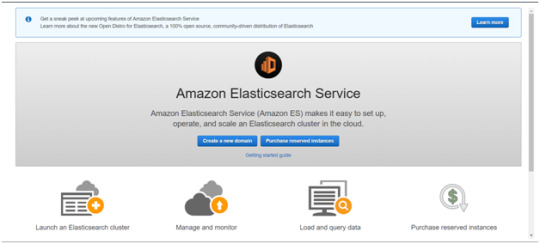
Tap on to “Create a new domain”
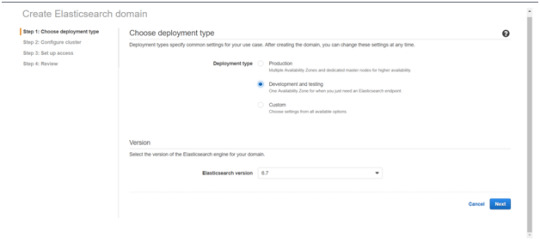
Select on the appropriated Deployment type and select the Elasticsearch version. Click Next.
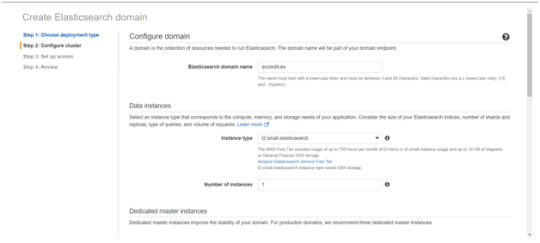
Enter a domain name and choose the Instance type in the prompt page and Click Next.
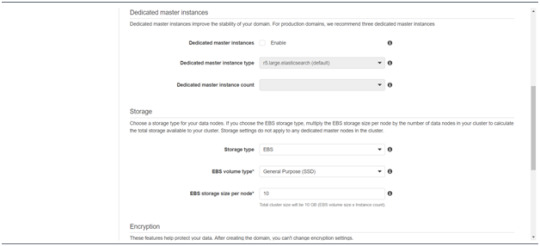
Follow to enter the “Dedicated master instances”
Click Next.
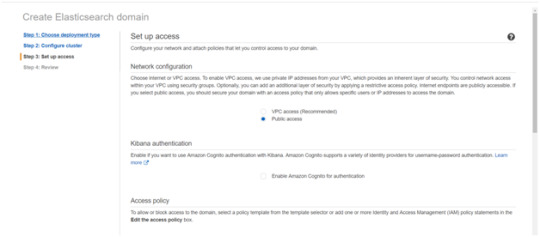
After the Cluster Configuration, you will be taken to the Set up access part. In the Setup access part, enable the specific set of users who can access your ElasticSearch cluster. There are two options — VPC access and Public access. Once you select one of the options and confirm your entries your new cluster is created.
Things to consider
1. Expandable
Amazon Elasticsearch Service provides to monitor your cluster through Amazon CloudWatch metrics.
We can change the cluster in various size from top or bottom within single clicks in the AWS management console or via a single API call.
There is a customizable setting available based on the range of instance types and storage options including SSD-powered EBS volumes.
2.Integrations
Many integrations available in the AWS Elasticsearch such as Kibana for data visualization, Amazon CloudTrail is used to audit API calls configure in AWS ES domains and integrate with Amazon Amazon S3, Amazon Kinesis, and Amazon DynamoDB for loading streaming data into Amazon ES.
3.Guarantee
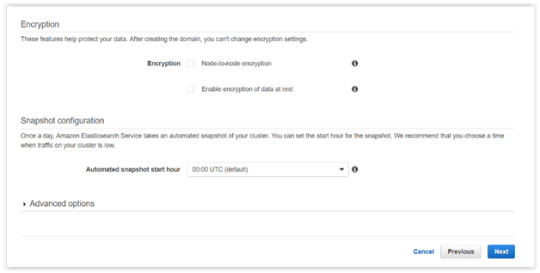
It guarantees to provide a secure environment and easy integration with Amazon VPC and VPC security groups. There is an availability to access the Identity and Access Management (IAM) control. It provides authentication for Kibana and Data encryption with node-to-node encryption.
4.Availability
Amazon ES supports the different zones in two geographical locations and various node allocations with a large number of zones in the same region itself. It manages the cluster and notifies the damaged nodes automatically.
Conclusion
This article has covered what AWS Elastic Search means, its benefits, what happens between and how you can use it.
#AWS#Elasticsearch#LogAnalytics#SearchEngine#CloudComputing#DataVisualization#Kibana#Scalability#Security#CloudWatch#AWSIntegration#DataEncryption#VPC#ElasticCluster#API#CloudInfrastructure#TechSolutions#BigData#AWSElasticsearch#ElasticSearchService#DataAnalysis#CloudServices
0 notes
Text
Save Big with Amazon CloudWatch: Affordable Log Storage
Amazon CloudWatch log class for infrequent access logs
Today, Amazon CloudWatch Logs unveiled the Infrequent Access log class, a new log class. With this new log class, customers can more affordably consolidate all of their logs in one location by providing a customized set of capabilities for infrequently visited logs at a lower cost.
The volume of logs created grows together with the scale and growth of customers’ applications. Many consumers are compelled to make difficult compromises in order to reduce the rise in logging expenses. Some customers, for instance, restrict the amount of logs their applications generate, which may impair the application’s visibility, or select a different solution for certain log categories, which increases the complexity and inefficiencies associated with managing various logging solutions.
Customers might, for example, provide CloudWatch Logs the logs required for real-time analytics and alerts and send a less expensive, less feature-rich solution the more detailed logs required for debugging and troubleshooting. Ultimately, these workarounds may affect the application’s observability as users are need to switch between several solutions in order to view their logs.
With the help of the Infrequent Access log class, you can use CloudWatch to create a comprehensive observability solution by centralizing all of your logs in one location for economical consumption, querying, and storing. The cost per gigabyte of ingestion for Infrequent Access is half that of Standard log class. For clients that don’t require sophisticated features like Live Tail, metric extraction, warning, or data protection functions that the Standard log class offers it offers a customized set of capabilities. You may still take advantage of fully managed ingestion, storage, and deep diving using CloudWatch Logs Insights with Infrequent Access.
How often to use the new log class for Infrequent Access
When you have a fresh workload that doesn’t require the advanced functionality offered by the Standard log class, use the Infrequent Access log class. It’s crucial to keep in mind that once a log group is created with a certain log class, it cannot be changed afterwards.
Because debug logs and web server logs are typically verbose and don’t require much of the more advanced features offered by the Standard log class, they are a good fit for the Infrequent Access log class.
An Internet of Things (IoT) fleet sending detailed logs that are only accessible for post-event forensic analysis is another excellent workload for the Infrequent Access log class. Additionally, because the Infrequent Access log type will be queried seldom, it is a desirable option for workloads where logs must be kept for compliance.
Getting started
Create a new log group in the CloudWatch Logs console and choose the new Infrequent Access log class to begin utilizing the new log class. The AWS Management Console, AWS Command Line Interface (AWS CLI), AWS CloudFormation, AWS Cloud Development Kit (AWS CDK), and AWS SDKs are the only ways to establish log groups using the new Infrequent Access log type.
You can use the newly generated log group in your workloads as soon as it’s created. You will set up a web application to submit debug logs to this log group for the purposes of this demonstration. You can return to the log group and view a fresh log stream after the web application has run for some time.
CloudWatch Logs Insights will be displayed when you choose a log stream.
You may make queries, search those logs for pertinent information, and rapidly examine all the logs in one location by using the same comfortable CloudWatch Logs Insights experience you receive with Standard Class.
Accessible right now
With the exception of the China and GovCloud regions, all AWS regions now offer the new Infrequent Access log class. You can get started with it and benefit from a fully managed, more economical method of gathering, storing, and analyzing your logs.
Read more Govindhtech.com
0 notes
Text
Amazon Web Service & Adobe Experience Manager:- A Journey together (Part-7)
In the previous parts (1,2,3,4,5 & 6) we discussed how one day digital market leader meet with the a friend AWS in the Cloud and become very popular pair. It bring a lot of gifts for the digital marketing persons. Then we started a journey into digital market leader house basement and structure, mainly repository CRX and the way its MK organized. Ways how both can live and what smaller modules they used to give architectural benefits.Also visited how they are structured together to give more.In the last part we have visited with AEM eCommerce part .
In this part as well will see more on the another flavor of AEM which is already familiar with cloud side of this combination.
Now ready to go with with Adobe Experience Manager (AEM) Cloud Management aka AEM Cloud.
Adobe Experience Manager (AEM) Cloud Management is SaaS(Software-as-a-Service) that reduced time and costs for provisioning and managing Web Experience Management (WEM) or Web Content Management (WCM) used in digital marketing solutions .
AEM Cloud Management ready to takes advantage of cloud with Amazon Web Services (AWS) Cloud Hosting, to start any AEM digital solutions rapidly and consistently. It save a lot of hardware cost for the initial setup , which required to pay in starting of the solution. This leads quicker to market and global enterprise reach very easy and quickly. So it rapidly engage customers, drive market shares, and focus on innovation.
Adobe is emerging leader in the digital market it evolves a lot of tool to support digital solutions and enrich the user experience. Also it is making footprint to increase the reach with cloud platform . So Adobe emerging its solution available into digital marketing. Here Adobe's own cloud champ is coming into picture "Adobe CC" or "Adobe Creative Cloud".
Adobe Creative Cloud:-
Adobe Creative Cloud(Adobe CC) is collection of very useful tools or software application for different platform i.e.Window ,iOS , Android etc. Basically they support to creative professionals, designers, and marketing professionals to create content.
Many Creative Cloud applications are available individually, or as part of a comprehensive suite.
Adobe Creative Cloud applications are widely used by professionals in digital marketing field for creating , designing and publishing digital marketing solutions for various needs.
Adobe Premiere Pro, is an example of a non-linear video editing tool. Adobe Creative Cloud next powerful applications for print design is InDesign . A well known name is already famous Photoshop , it used by every major magazine publisher and new website.
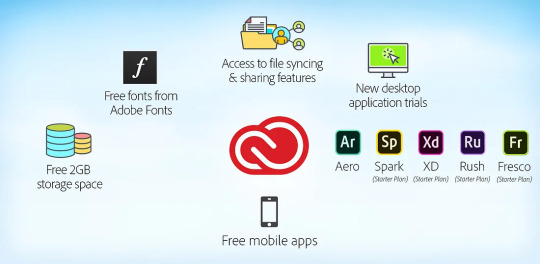
Adobe Creative Cloud is a tool for enabling both creativity and collaboration. The Creative Cloud provides applications to work on projects including video editing, mobile design and even desktop publishing.
Creative Cloud for teams includes the entire collection of Creative Cloud desktop applications including Adobe Photoshop CC, Adobe Illustrator CC, etc. plus services and business features for teams and small to medium-sized organizations.
Main Advantage of Adobe CC:-
Adobe is mainly focusing on digital media and digital marketing.
Adobe decided to focus more on AWS because of strong API set.
AWS allow to deploy, integrate their automation system in to AWS provide very efficient environment for digital market and eCommerce.
Quicker time to market and ROI.
Flexibility in pricing based on subscription.
Scaling on demand to handle future and peak incoming request.
Good relationship with AWS as vendor .
Reduce Opex(operational expenditure) , so more investment on development & innovation.
Till here we are able to understand this variation Adobe solution which have cloud ready and giving a lot of feature with benefits .
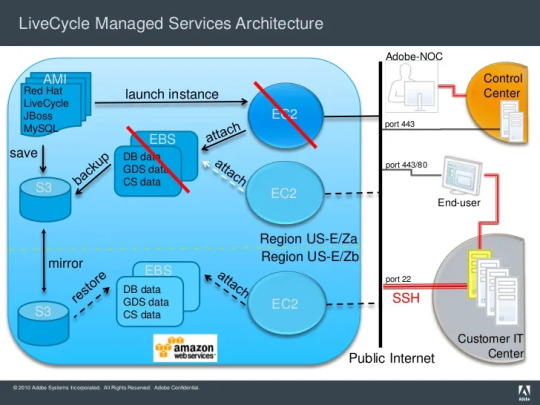
AEM cloud provisioning
AEM cloud is provisioned on public clouds with one Dispatcher, one Publish instance, and one Author instance by default.
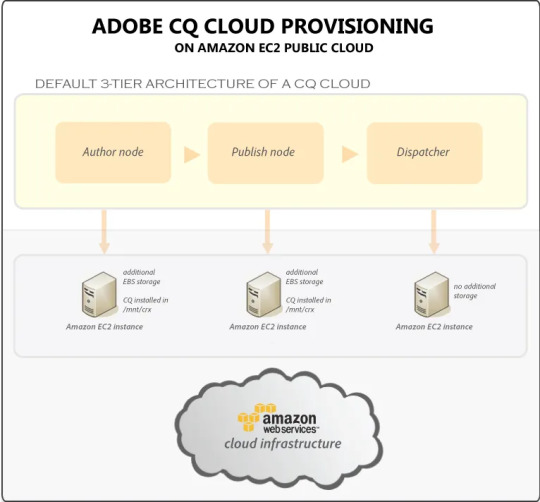
Dispatcher: Amazon EC2 instance launched from an Amazon Machine Image (AMI) .
Publish : Amazon EC2 instance launched from an AMI with Elastic Block Store (EBS) storage. Adobe AEM is installed on the persistent EBS storage in the /mnt/crx folder.
Author : Amazon EC2 instance launched from an AMI with EBS storage . Adobe AEM is installed on the persistent EBS storage in the /mnt/crx folder.
Backups: Backups are triggered using the AEM backup feature and then copied automatically to the Amazon Simple Storage Service (Amazon S3) using your Amazon credentials.
Topologies:
Development/Testing: 1 Author instance, 1 Publish instance, and 1 Dispatcher with no load balancer.
Staging/Production: 1 Author instance, 1 Publish instance, 1 Dispatcher, and a load balancer in front of the Dispatcher.
Creative Cloud Architecture
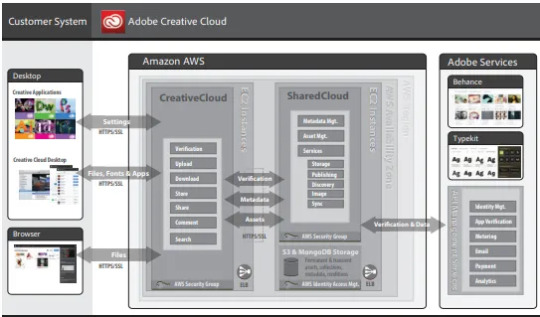
Infrastructure:
AWS services can use into flowing combination :-
S3, KMS, EC2: ELB, EBS, Snapshoting, Dynamic DB, VPC, SQS, SNS, SES, RDS, ELASTIC CASHE, CLOUD FORMATION, ROUTE 53, Cloudwatch, Cloudtrail, IAM,elastic cache MongoDB, Redshift, kinesis.
In this journey we walk through AEM & AWS for Adobe CC aka Creative cloud to provide solutions to transform your business digitally. So any Adobe CC solution deliver holistic, personalized experiences at scale, tailoring each moment of your digital marketing journey.
For more details on this interesting Journey you can browse back earlier parts from 1-6.
#aem#adobe#aws#wcm#cloud#security#elb#ec2#aws lambda#kinesis#redshift#mongodb#cache#elastic#IAM#Cloudtrail#Cloudwatch#ROUTE 53#CLOUD FORMATION#ELASTIC CASHE#RDS#SES#SNS#SQS#VPC#Dynamic DB#Snapshoting#EBS#KMS#amazon s3
1 note
·
View note
Text
Day 14: Telling
The hunting party as a group stopped in their tracks not half a bell after they’d crossed the Gates of Judgment. The game here was less dangerous thanks to the increased military presence, and if somebody was badly hurt or lost in a snowstorm then Camp Dragonhead and Whitebrim were both close enough that aid could be sought and a rescue party summoned. Matthieu had planned to insist on this when his parish’s shooting club had invited him along, but to his relief he needn’t have concerned himself, as this was part of their usual route.
The club was a small one, the product of a few citizens in the parish coming into money thanks to Ishgard’s increased trade volume and deciding to put that coin to use acquiring some of Skysteel’s newest products. None of them were able to afford the aetherotransformer unit that turned the average rifle into a multi-faceted man-portable weapon of mass destruction, but having access to rifle and shot still made them feel like they were part of the new Coerthas and afforded them the chance to go out on hunts without years of training in spear or bow.
They’d insisted on Matthieu coming along at least once, and while he was generally well-liked by most of his constituents, he had to admit that he was most popular with the kind of people who got along with his aunt: older ladies who enjoyed their tea and gossip, found his willingness to help around the store to be charming, and lightly teased him about his relationship with Edda. That was enough of the parish to have gotten him elected, but he had to admit that getting others to like him more would help in the next election. In this case, that meant agreeing to attend one of the Crozier 4th’s Official Club of Jolly Fellows once-a-moon hunts.
The title was not of his choosing.
And so he’d agreed, gotten some assistance from his fellows in the Commons in selecting an easy-to-use carbine and how to load, point, and fire it without embarrassing himself, allowing for the knowledge that this was his first time out, and met up with a dozen of the Fellows at the Gates. The plan had been to traipse about the snows between the Gates and Whitebrim, take a few cloudkin or a wild karakul if the opportunity presented itself, then head back to help themselves to some beet stew and sort out who was the best and worst shot while their catches were prepared.
It was a cloudy morning, and while the cloudwatchers had suggested a mild chance of snow, visibility was still clear. The group had a clear view of the Nail interrupting the highlands in one large series of jagged peaks, and of what had stopped them: a single dragon, perched on one of the larger outcroppings, observing the comings and goings of the wildlife on the ground below.
“Fury, would you look at that.” Alort, the parish cobbler, made a quick sign of prayer to Halone, his tone of voice breathless. It wasn’t clear to Matthieu if he spoke in awe or fear.
“Never thought I’d see one of those without taking to my heels,” said Gaspardieux, the carpenter. “Still feels like I ought to.”
“That makes sense.” Matthieu kept his composure while he replied, simply raising a hand to the dragon in greeting. Events surrounding his election had given him more benign exposure to the Dravanian Horde than the average commoner, and he kept abreast of efforts to repatriate those who had turned into aevis and wished to return to the city. “I’m sure it’s just as wary.”
If the dragon had even seen Matthieu’s raised hand, it didn’t show it, simply lowering its head to rest it on its forelegs. “Mayhaps if we were knights or dragoons it’d be wary,” said Gaspardieux. “But I left my chainmail at home and haven’t perched on any high places of late.” The other Fellows chuckled, the tension easing.
“It’s a lovely color, isn’t it?” said Ophoix, the local gemcutter. “Like sapphires, but a little deeper.” He stepped forward, shielding his eyes from the clouds to get a better look. “I’d love to see it up close.”
“I don’t think you’ll be turning that into a stone fit for a brooch anytime soon, Ophie,” said Gaspardieux.
“I wouldn’t!” Ophoix stepped back, holding up his other hand in protest. “But surely, just a scale. Mayhaps we could ask.”
“No.” The statement was short, sharp, and firm, and came from Aubineaux, the parish tailor. The others took notice; while the Fellows had no official leader, it was Aubineaux who took the hunts most seriously, did most of the organizing, and led the other members in drills to improve their marksmanship. “Let it come to us if it likes, but otherwise we keep our distance.”
There was some grumbling from the Fellows, but Aubineaux stood firm, turning to face them from the head of the group. “No.” Grim-faced, with heavy eyebrows and a stocky build for an elezen, the tailor didn’t match up to the “Jolly” part of the club’s name. Matthieu suspected the title wasn’t of his choosing, either.
“Well, what’s it doing here, anyway?” The question came from Constant, one of the local tutors. Matthieu frowned; to his recollection, Constant had been one of the more reactionary voices in the community in Ishgard’s recent upheavals. Some had thought he was one of the True Brethren, in their brief existence, but he’d denied this ever since their disbandment. “It’s quite far from Dravania.” “I’m sure the knights are aware of it,” Matthieu replied. “If we’re going to be at peace, we have to have some free movement, and simply live with a little suspicion. Perhaps it’s simply enjoying time where it wouldn’t be otherwise.”
“I don’t know,” said Alort. “You wouldn’t catch me going past Falcon’s Nest, let alone Tailfeather, and certainly not out in their own lands simply because I could. It doesn’t mean I ought.”
“We don’t even catch you leaving even the parish, Alort,” said Gaspardieux. The cobbler puffed out his cheeks in annoyance.
“And we already have their dragonets in the Firmament,” said Matthieu. “And the returning aevis and so forth. I simply mean there’s a good reason for it, no doubt.”
“Good or ill, we’re wasting time.” Aubineaux gestured down the trail towards the Whitebrim Front. “And losing good bells when we could be catching karakul with no snow to cover their tracks.”
“What a catch it would be though, eh?” Constant mused on this, watching the dragon with a speculative expression. “In worse times, of course.” “Of course,” said Matthieu. “But only in worse times. Remember what happened to Flaurienne Mollet?”
The Fellows all collectively winced. Mollet, who had stood for another parish in the Crozier, was scandalized to have been involved in the poaching of dragon leather after the conclusion of the Dragonsong War, and had been forced to resign in disgrace.
Before any further debate could be had, Gaspardieux pointed upwards at the dragon. Following his arm, the group saw a pair of smaller figures flitting about the dragon. “Have a look, it’s just brought its children on a little outing, you see? Nothing wrong with that.” There was a long silence among the group as they watched the wyrmlings flit about the outcropping. The dragon briefly snapped its maw in the air, as if to chide them, and then settled down again. After a minute, Matthieu found he misliked it.
“We certainly shouldn’t get close if that’s the case. Aubineaux, could you lead us to some tracks, if you please?”
“Yes.” Despite his refusal, at this point even Aubineaux was watching the dragon. “Come along now.”
4 notes
·
View notes
Text
How can you optimize the performance of machine learning models in the cloud?
Optimizing machine learning models in the cloud involves several strategies to enhance performance and efficiency. Here’s a detailed approach:

Choose the Right Cloud Services:
Managed ML Services:
Use managed services like AWS SageMaker, Google AI Platform, or Azure Machine Learning, which offer built-in tools for training, tuning, and deploying models.
Auto-scaling:
Enable auto-scaling features to adjust resources based on demand, which helps manage costs and performance.
Optimize Data Handling:
Data Storage:
Use scalable cloud storage solutions like Amazon S3, Google Cloud Storage, or Azure Blob Storage for storing large datasets efficiently.
Data Pipeline:
Implement efficient data pipelines with tools like Apache Kafka or AWS Glue to manage and process large volumes of data.
Select Appropriate Computational Resources:
Instance Types:
Choose the right instance types based on your model’s requirements. For example, use GPU or TPU instances for deep learning tasks to accelerate training.
Spot Instances:
Utilize spot instances or preemptible VMs to reduce costs for non-time-sensitive tasks.
Optimize Model Training:
Hyperparameter Tuning:
Use cloud-based hyperparameter tuning services to automate the search for optimal model parameters. Services like Google Cloud AI Platform’s HyperTune or AWS SageMaker’s Automatic Model Tuning can help.
Distributed Training:
Distribute model training across multiple instances or nodes to speed up the process. Frameworks like TensorFlow and PyTorch support distributed training and can take advantage of cloud resources.
Monitoring and Logging:
Monitoring Tools:
Implement monitoring tools to track performance metrics and resource usage. AWS CloudWatch, Google Cloud Monitoring, and Azure Monitor offer real-time insights.
Logging:
Maintain detailed logs for debugging and performance analysis, using tools like AWS CloudTrail or Google Cloud Logging.
Model Deployment:
Serverless Deployment:
Use serverless options to simplify scaling and reduce infrastructure management. Services like AWS Lambda or Google Cloud Functions can handle inference tasks without managing servers.
Model Optimization:
Optimize models by compressing them or using model distillation techniques to reduce inference time and improve latency.
Cost Management:
Cost Analysis:
Regularly analyze and optimize cloud costs to avoid overspending. Tools like AWS Cost Explorer, Google Cloud’s Cost Management, and Azure Cost Management can help monitor and manage expenses.
By carefully selecting cloud services, optimizing data handling and training processes, and monitoring performance, you can efficiently manage and improve machine learning models in the cloud.
2 notes
·
View notes
Text
OC PROFILE #7: ORIGINAL UNIVERSE (ARMAGEDDON)

"Fear not, for I am DEXTER... former messenger of... The Big Guy."
ꙮ name: Unknowable to mortals, goes by DEXTER ꙮ nicknames: Dex, Dexy ꙮ age: No concept of age ꙮ birthday: Unknown, celebrates on December 17 ꙮ star sign: None? ꙮ birthplace: Primum Mobile, Paradiso, Heaven ꙮ hometown: The Empyrian, Paradiso, Heaven ꙮ ethnicity: None, just a Seraph ꙮ nationality: Heaven... ese? ꙮ languages spoken: ALL ꙮ gender: No concept of gender, any pronouns, he/him for consistency ꙮ sexuality: Pansexual (despite being unable to copulate)
ii.– appearance
ꙮ description: DEXTER is a Seraph, one of the higher-ranking angels in Heaven. His true form is incomprehensible to most beings, so their form varies. When interacting with anyone of a lower rank, he appears with a tall humanoid form with a head shaped like an Ophanim (gold rings, covered in eyes) and three pairs of white wings. ꙮ height: (perceivable form) 8'8" (264 cm.), (true form) 30'4" (925 cm.) ꙮ weight: Unknown ꙮ other distinguishing features: Variable
iii.– personality
ꙮ positive traits: understanding, trustworthy, open-minded, mature, wise ꙮ neutral traits: deadpan, sarcastic, frank, honorable, perfectionist ꙮ negative traits: nitpicky, manipulative, morbid, blunt, know-it-all ꙮ likes: cloudwatching, coffee, long naps, sweaters, relaxing ꙮ dislikes: strenuous labor, staying up late, cherubs, horror movies, cold temperatures ꙮ fears: The Big Guy. That's it. ꙮ hobbies: knitting, journaling, watching movies, cryptography ꙮ talents: intimidation, reasoning, swordfighting, writing, knitting
iv.– abilities
ꙮ status: Seraph ꙮ weapons: so fucking much. they can melt people, blind people, decapitate them with a sword, whatever. lotta manners of killing.
v.– relationships
ꙮ friends: Sammy Braddock, Ariel Merihem, most other angels (except for cherubs) ꙮ enemies: most lower-ranking demons, all demons with influence ꙮ love interest: an Ophanim named "FRANKIE"
vi.– backstory
Like all Seraphim, DEXTER was created by The Big Guy in the Primum Mobile to be a messenger. Still, they were taken out of commission after it was decided that guardian angels would be a better option for bettering humanity. After several thousand years of doing just about nothing (since The Big Guy doesn't let anyone higher than a Dominion descend to the mortal realm anymore since mortals are awful), he's getting tired and is ready for a change of pace.
…and then the fic starts.
vii.– other
ꙮ fashion style: semi-formal, cozy, light academia ꙮ voice claim: Harlan Ellison (specifically as AM) ꙮ theme song: Thirteen Angels Standing Guard 'Round The Side of Your Bed- Silver Mt. Zion ꙮ assorted fun facts: He has a flock of sheep. He's good at lying, despite it being a sin. His favorite show is Good Omens. His percievable form is 8'8 and his true form is over 30 feet tall. He enjoys Sisters of Mercy and Fields of the Nephilim. He can sleep just about anywhere.
#long post#oc#original character#oc profile#my oc#original universe#angel#biblically accurate angel#oc: DEXTER#his name is always capitalized deal with it#there are so many puns in this universe what have i done#he's insufferable but i love him#ocs
5 notes
·
View notes
Text
Navigating AWS: A Comprehensive Guide for Beginners
In the ever-evolving landscape of cloud computing, Amazon Web Services (AWS) has emerged as a powerhouse, providing a wide array of services to businesses and individuals globally. Whether you're a seasoned IT professional or just starting your journey into the cloud, understanding the key aspects of AWS is crucial. With AWS Training in Hyderabad, professionals can gain the skills and knowledge needed to harness the capabilities of AWS for diverse applications and industries. This blog will serve as your comprehensive guide, covering the essential concepts and knowledge needed to navigate AWS effectively.

1. The Foundation: Cloud Computing Basics
Before delving into AWS specifics, it's essential to grasp the fundamentals of cloud computing. Cloud computing is a paradigm that offers on-demand access to a variety of computing resources, including servers, storage, databases, networking, analytics, and more. AWS, as a leading cloud service provider, allows users to leverage these resources seamlessly.
2. Setting Up Your AWS Account
The first step on your AWS journey is to create an AWS account. Navigate to the AWS website, provide the necessary information, and set up your payment method. This account will serve as your gateway to the vast array of AWS services.
3. Navigating the AWS Management Console
Once your account is set up, familiarize yourself with the AWS Management Console. This web-based interface is where you'll configure, manage, and monitor your AWS resources. It's the control center for your cloud environment.
4. AWS Global Infrastructure: Regions and Availability Zones
AWS operates globally, and its infrastructure is distributed across regions and availability zones. Understand the concept of regions (geographic locations) and availability zones (isolated data centers within a region). This distribution ensures redundancy and high availability.
5. Identity and Access Management (IAM)
Security is paramount in the cloud. AWS Identity and Access Management (IAM) enable you to manage user access securely. Learn how to control who can access your AWS resources and what actions they can perform.
6. Key AWS Services Overview
Explore fundamental AWS services:
Amazon EC2 (Elastic Compute Cloud): Virtual servers in the cloud.
Amazon S3 (Simple Storage Service): Scalable object storage.
Amazon RDS (Relational Database Service): Managed relational databases.
7. Compute Services in AWS
Understand the various compute services:
EC2 Instances: Virtual servers for computing capacity.
AWS Lambda: Serverless computing for executing code without managing servers.
Elastic Beanstalk: Platform as a Service (PaaS) for deploying and managing applications.
8. Storage Options in AWS
Explore storage services:
Amazon S3: Object storage for scalable and durable data.
EBS (Elastic Block Store): Block storage for EC2 instances.
Amazon Glacier: Low-cost storage for data archiving.
To master the intricacies of AWS and unlock its full potential, individuals can benefit from enrolling in the Top AWS Training Institute.
9. Database Services in AWS
Learn about managed database services:
Amazon RDS: Managed relational databases.
DynamoDB: NoSQL database for fast and predictable performance.
Amazon Redshift: Data warehousing for analytics.
10. Networking Concepts in AWS
Grasp networking concepts:
Virtual Private Cloud (VPC): Isolated cloud networks.
Route 53: Domain registration and DNS web service.
CloudFront: Content delivery network for faster and secure content delivery.
11. Security Best Practices in AWS
Implement security best practices:
Encryption: Ensure data security in transit and at rest.
IAM Policies: Control access to AWS resources.
Security Groups and Network ACLs: Manage traffic to and from instances.
12. Monitoring and Logging with AWS CloudWatch and CloudTrail
Set up monitoring and logging:
CloudWatch: Monitor AWS resources and applications.
CloudTrail: Log AWS API calls for audit and compliance.
13. Cost Management and Optimization
Understand AWS pricing models and manage costs effectively:
AWS Cost Explorer: Analyze and control spending.
14. Documentation and Continuous Learning
Refer to the extensive AWS documentation, tutorials, and online courses. Stay updated on new features and best practices through forums and communities.
15. Hands-On Practice
The best way to solidify your understanding is through hands-on practice. Create test environments, deploy sample applications, and experiment with different AWS services.
In conclusion, AWS is a dynamic and powerful ecosystem that continues to shape the future of cloud computing. By mastering the foundational concepts and key services outlined in this guide, you'll be well-equipped to navigate AWS confidently and leverage its capabilities for your projects and initiatives. As you embark on your AWS journey, remember that continuous learning and practical application are key to becoming proficient in this ever-evolving cloud environment.
2 notes
·
View notes
Text
How to Deploy Your Full Stack Application: A Beginner’s Guide
Deploying a full stack application involves setting up your frontend, backend, and database on a live server so users can access it over the internet. This guide covers deployment strategies, hosting services, and best practices.
1. Choosing a Deployment Platform
Popular options include:
Cloud Platforms: AWS, Google Cloud, Azure
PaaS Providers: Heroku, Vercel, Netlify
Containerized Deployment: Docker, Kubernetes
Traditional Hosting: VPS (DigitalOcean, Linode)
2. Deploying the Backend
Option 1: Deploy with a Cloud Server (e.g., AWS EC2, DigitalOcean)
Set Up a Virtual Machine (VM)
bash
ssh user@your-server-ip
Install Dependencies
Node.js (sudo apt install nodejs npm)
Python (sudo apt install python3-pip)
Database (MySQL, PostgreSQL, MongoDB)
Run the Server
bash
nohup node server.js & # For Node.js apps gunicorn app:app --daemon # For Python Flask/Django apps
Option 2: Serverless Deployment (AWS Lambda, Firebase Functions)
Pros: No server maintenance, auto-scaling
Cons: Limited control over infrastructure
3. Deploying the Frontend
Option 1: Static Site Hosting (Vercel, Netlify, GitHub Pages)
Push Code to GitHub
Connect GitHub Repo to Netlify/Vercel
Set Build Command (e.g., npm run build)
Deploy and Get Live URL
Option 2: Deploy with Nginx on a Cloud Server
Install Nginx
bash
sudo apt install nginx
Configure Nginx for React/Vue/Angular
nginx
server { listen 80; root /var/www/html; index index.html; location / { try_files $uri /index.html; } }
Restart Nginx
bash
sudo systemctl restart nginx
4. Connecting Frontend and Backend
Use CORS middleware to allow cross-origin requests
Set up reverse proxy with Nginx
Secure API with authentication tokens (JWT, OAuth)
5. Database Setup
Cloud Databases: AWS RDS, Firebase, MongoDB Atlas
Self-Hosted Databases: PostgreSQL, MySQL on a VPS
bash# Example: Run PostgreSQL on DigitalOcean sudo apt install postgresql sudo systemctl start postgresql
6. Security & Optimization
✅ SSL Certificate: Secure site with HTTPS (Let’s Encrypt) ✅ Load Balancing: Use AWS ALB, Nginx reverse proxy ✅ Scaling: Auto-scale with Kubernetes or cloud functions ✅ Logging & Monitoring: Use Datadog, New Relic, AWS CloudWatch
7. CI/CD for Automated Deployment
GitHub Actions: Automate builds and deployment
Jenkins/GitLab CI/CD: Custom pipelines for complex deployments
Docker & Kubernetes: Containerized deployment for scalability
Final Thoughts
Deploying a full stack app requires setting up hosting, configuring the backend, deploying the frontend, and securing the application.
Cloud platforms like AWS, Heroku, and Vercel simplify the process, while advanced setups use Kubernetes and Docker for scalability.
WEBSITE: https://www.ficusoft.in/full-stack-developer-course-in-chennai/
0 notes
Text
Amazon S3 Bucket Feature Tutorial Part2 | Explained S3 Bucket Features for Cloud Developer
Full Video Link Part1 - https://youtube.com/shorts/a5Hioj5AJOU Full Video Link Part2 - https://youtube.com/shorts/vkRdJBwhWjE Hi, a new #video on #aws #s3bucket #features #cloudstorage is published on #codeonedigest #youtube channel. @java #java #awsc
Amazon Simple Storage Service (Amazon S3) is an object storage service that offers industry-leading scalability, data availability, security, and performance. Customers of all sizes and industries can use Amazon S3 to store and protect any amount of data. Amazon S3 provides management features so that you can optimize, organize, and configure access to your data to meet your specific business,…

View On WordPress
#amazon s3 bucket features#amazon s3 features#amazon web services#aws#aws cloud#aws cloudtrail#aws cloudwatch#aws s3#aws s3 bucket#aws s3 bucket creation#aws s3 bucket features#aws s3 bucket tutorial#aws s3 classes#aws s3 features#aws s3 interview questions and answers#aws s3 monitoring#aws s3 tutorial#cloud computing#s3 consistency#s3 features#s3 inventory report#s3 storage lens#simple storage service (s3)#simple storage service features
0 notes
Text
A Deep Dive into Amazon CloudWatch: Your Ultimate Monitoring Solution
In today's cloud-centric world, effective monitoring is crucial for maintaining the performance and reliability of applications and services. Amazon CloudWatch, a core component of the Amazon Web Services (AWS) ecosystem, offers a robust solution for monitoring AWS resources and applications. In this blog, we’ll explore the features, benefits, and best practices for using Amazon CloudWatch to ensure your cloud infrastructure operates smoothly.
If you want to advance your career at the AWS Course in Pune, you need to take a systematic approach and join up for a course that best suits your interests and will greatly expand your learning path.
What is Amazon CloudWatch?
Amazon CloudWatch is a comprehensive monitoring and observability service designed to provide real-time insights into your AWS environment. It collects data from various AWS resources, enabling users to track performance, set alarms, and gain visibility into overall system health. With CloudWatch, organizations can proactively manage their cloud resources, ensuring optimal performance and minimal downtime.
Key Features of Amazon CloudWatch
1. Comprehensive Metrics Collection
CloudWatch automatically gathers metrics from numerous AWS services. This includes essential data points such as CPU utilization, memory usage, and network traffic for services like EC2, RDS, and Lambda. By aggregating this data, users can monitor the health and efficiency of their resources at a glance.
2. Log Management and Analysis
CloudWatch Logs allows you to collect, monitor, and analyze log files from your applications and AWS resources. Users can search through logs in real-time, set retention policies, and create metrics based on log data, enabling effective troubleshooting and performance optimization.
3. Alarms and Notifications
Setting up CloudWatch Alarms helps you stay informed about the health of your services. You can define thresholds for specific metrics, and when those thresholds are breached, CloudWatch can trigger notifications via Amazon SNS (Simple Notification Service), ensuring you can act swiftly to address potential issues.
4. Custom Dashboards
CloudWatch Dashboards enable users to create personalized views of their metrics. These visual representations allow for easy monitoring of multiple resources, helping teams identify trends, bottlenecks, and anomalies quickly.
5. Event-Driven Monitoring
With CloudWatch Events, you can respond to changes in your AWS environment automatically. By defining rules, you can trigger actions based on specific events, such as scaling resources in response to increased load, further enhancing the automation of your infrastructure management.
6. Integration with AWS Services
CloudWatch integrates seamlessly with a wide range of AWS services, including AWS Lambda, Auto Scaling, and Amazon ECS (Elastic Container Service). This integration allows for more cohesive operations and enables automated responses to monitoring data.
To master the intricacies of AWS and unlock its full potential, individuals can benefit from enrolling in the AWS Online Training.

Benefits of Using Amazon CloudWatch
- Enhanced Operational Visibility
CloudWatch provides deep insights into your AWS resources, making it easier to monitor performance and troubleshoot issues before they escalate.
- Cost Management
By leveraging CloudWatch's monitoring capabilities, organizations can optimize resource usage, avoiding unnecessary costs associated with over-provisioning or underutilized resources.
- Increased Application Reliability
Proactive monitoring and alerting help maintain high application performance and reliability, leading to improved user experiences and satisfaction.
- Streamlined Automation
Automating responses to specific metrics and log events can save time and reduce the need for manual interventions, allowing teams to focus on more strategic initiatives.
Conclusion
Amazon CloudWatch is an indispensable tool for anyone utilizing AWS. Its comprehensive monitoring capabilities empower organizations to maintain high levels of performance and reliability in their cloud environments. By leveraging the features and best practices outlined in this blog, you can optimize your use of CloudWatch and ensure your applications run smoothly, ultimately enhancing business success in the cloud.
0 notes
Video
youtube
Amazon RDS Performance Insights | Monitor and Optimize Database Performance
Amazon RDS Performance Insights is an advanced monitoring tool that helps you analyze and optimize your database workload in Amazon RDS and Amazon Aurora. It provides real-time insights into database performance, making it easier to identify bottlenecks and improve efficiency without deep database expertise.
Key Features of Amazon RDS Performance Insights:
✅ Automated Performance Monitoring – Continuously collects and visualizes performance data to help you monitor database load. ✅ SQL Query Analysis – Identifies slow-running queries, so you can optimize them for better database efficiency. ✅ Database Load Metrics – Displays a simple Database Load (DB Load) graph, showing the active sessions consuming resources. ✅ Multi-Engine Support – Compatible with MySQL, PostgreSQL, SQL Server, MariaDB, and Amazon Aurora. ✅ Retention & Historical Analysis – Stores performance data for up to two years, allowing trend analysis and long-term optimization. ✅ Integration with AWS Services – Works seamlessly with Amazon CloudWatch, AWS Lambda, and other AWS monitoring tools.
How Amazon RDS Performance Insights Helps You:
🔹 Troubleshoot Performance Issues – Quickly diagnose and fix slow queries, high CPU usage, or locked transactions. 🔹 Optimize Database Scaling – Understand workload trends to scale your database efficiently. 🔹 Enhance Application Performance – Ensure your applications run smoothly by reducing database slowdowns. 🔹 Improve Cost Efficiency – Optimize resource utilization to prevent over-provisioning and reduce costs.
How to Enable Amazon RDS Performance Insights: 1️⃣ Navigate to AWS Management Console. 2️⃣ Select Amazon RDS and choose your database instance. 3️⃣ Click on Modify, then enable Performance Insights under Monitoring. 4️⃣ Choose the retention period (default 7 days, up to 2 years with paid plans). 5️⃣ Save changes and start analyzing real-time database performance!
Who Should Use Amazon RDS Performance Insights? 🔹 Database Administrators (DBAs) – To manage workload distribution and optimize database queries. 🔹 DevOps Engineers – To ensure smooth database operations for applications running on AWS. 🔹 Developers – To analyze slow queries and improve app performance. 🔹 Cloud Architects – To monitor resource utilization and plan database scaling effectively.
Amazon RDS Performance Insights simplifies database monitoring, making it easy to detect issues and optimize workloads for peak efficiency. Start leveraging it today to improve the performance and scalability of your AWS database infrastructure! 🚀
**************************** *Follow Me* https://www.facebook.com/cloudolus/ | https://www.facebook.com/groups/cloudolus | https://www.linkedin.com/groups/14347089/ | https://www.instagram.com/cloudolus/ | https://twitter.com/cloudolus | https://www.pinterest.com/cloudolus/ | https://www.youtube.com/@cloudolus | https://www.youtube.com/@ClouDolusPro | https://discord.gg/GBMt4PDK | https://www.tumblr.com/cloudolus | https://cloudolus.blogspot.com/ | https://t.me/cloudolus | https://www.whatsapp.com/channel/0029VadSJdv9hXFAu3acAu0r | https://chat.whatsapp.com/BI03Rp0WFhqBrzLZrrPOYy *****************************
*🔔Subscribe & Stay Updated:* Don't forget to subscribe and hit the bell icon to receive notifications and stay updated on our latest videos, tutorials & playlists! *ClouDolus:* https://www.youtube.com/@cloudolus *ClouDolus AWS DevOps:* https://www.youtube.com/@ClouDolusPro *THANKS FOR BEING A PART OF ClouDolus! 🙌✨*
#youtube#AmazonRDS RDSPerformanceInsights DatabaseOptimization AWSDevOps ClouDolus CloudComputing PerformanceMonitoring SQLPerformance CloudDatabase#amazon rds database S3 aws devops amazonwebservices free awscourse awstutorial devops awstraining cloudolus naimhossenpro ssl storage cloudc
0 notes
Text
Cloud-Based Pipelines: The Future of Scalable Business Operations
In today’s fast-paced digital landscape, businesses must adopt modern infrastructure to remain competitive. One of the most transformative technologies in recent years is the cloud-based pipeline. These pipelines ensure scalability, efficiency, and agility, enabling organizations to streamline their workflows and optimize operations. But what makes cloud-based pipelines the future of business operations? Let’s dive in.
What Are Cloud-Based Pipelines?
A cloud-based pipeline is an automated process that helps businesses manage and process data, applications, or services through cloud infrastructure. These pipelines integrate various technologies like CI/CD (Continuous Integration and Continuous Deployment), automation, and AI to enhance efficiency.
Why Are Cloud-Based Pipelines Important?
Scalability: Businesses can easily scale resources up or down based on demand.
Cost Efficiency: No need for expensive on-premise infrastructure.
Enhanced Collaboration: Teams across different locations can access the same data in real time.
Security and Reliability: Cloud providers offer high-end security measures to safeguard data.
Faster Deployment: Automation reduces time-to-market for products and services.
Key Components of a Cloud-Based Pipeline
1. Infrastructure as Code (IaC)
IaC allows businesses to automate infrastructure management, making deployments consistent and error-free.
2. Continuous Integration/Continuous Deployment (CI/CD)
CI/CD pipelines automate code integration, testing, and deployment, ensuring rapid updates without downtime.
3. Data Pipeline Management
A cloud-based data pipeline enables the seamless transfer and transformation of data across different platforms.
4. Security and Compliance
Security is a top concern in cloud environments. Cloud pipelines incorporate encryption, access controls, and compliance measures.
5. Monitoring and Observability
Real-time monitoring tools like AWS CloudWatch, Datadog, and Prometheus help businesses track performance and detect issues early.
Benefits of Cloud-Based Pipelines
1. Improved Efficiency
Automated workflows minimize manual intervention, reducing human errors and improving productivity.
2. Reduced Costs
With pay-as-you-go models, businesses only pay for what they use, cutting down operational expenses.
3. Better Resource Utilization
Cloud providers offer auto-scaling features to optimize resource allocation based on workload demand.
4. Faster Product Development
Development teams can test and deploy software faster with cloud-based pipelines, improving time-to-market.
5. Remote Accessibility
Since everything is in the cloud, employees can collaborate from anywhere, enhancing workforce flexibility.
Industries Leveraging Cloud-Based Pipelines
1. IT and Software Development
Software companies use cloud pipelines for CI/CD processes, ensuring continuous delivery of updates.
2. Healthcare
Hospitals and research institutions use cloud pipelines to manage patient records and streamline clinical operations.
3. Finance and Banking
Banks rely on cloud-based pipelines for secure transactions, fraud detection, and real-time analytics.
4. E-Commerce
Retailers use cloud pipelines to manage inventory, optimize marketing campaigns, and enhance customer experience.
Challenges in Implementing Cloud-Based Pipelines
1. Security Concerns
Businesses must ensure compliance with data protection laws like GDPR and HIPAA.
2. Initial Setup Complexity
Setting up a cloud-based pipeline requires technical expertise and careful planning.
3. Vendor Lock-In
Relying on a single cloud provider can limit flexibility. Businesses must consider multi-cloud strategies.
Best Practices for Implementing Cloud-Based Pipelines
1. Choose the Right Cloud Provider
Select a provider that aligns with your business needs (AWS, Google Cloud, Azure, etc.).
2. Automate Everything
From deployments to monitoring, automation ensures efficiency and reduces errors.
3. Prioritize Security
Implement strong encryption, identity management, and regular security audits.
4. Monitor Performance
Use cloud-native monitoring tools to track performance and detect issues early.
5. Foster a DevOps Culture
Encourage collaboration between development and operations teams to optimize cloud workflows.
The Future of Cloud-Based Pipelines
The evolution of cloud computing is far from over. AI and machine learning are making cloud-based pipelines even more intelligent, predictive, and self-healing. Edge computing will further enhance processing power, enabling businesses to run workloads closer to users.
Conclusion
Cloud-based pipelines are revolutionizing how businesses operate by providing agility, cost efficiency, and security. Companies that adopt these technologies will be better positioned to scale and innovate in the digital economy. If your organization hasn’t embraced cloud-based pipelines yet, now is the time!
0 notes
Text
Step-by-Step Guide to AIOps Platform Development for Enterprises
As IT infrastructures become more complex, enterprises are increasingly turning to AIOps (Artificial Intelligence for IT Operations) platforms to streamline operations, enhance efficiency, and proactively manage incidents. A well-developed AIOps platform can automate troubleshooting, reduce downtime, and optimize IT performance using AI and machine learning.

In this blog, we’ll take you through a step-by-step guide to AIOps platform development for enterprises, covering everything from planning and data integration to model deployment and continuous optimization.
Step 1: Define Business Goals and Requirements
Before starting AIOps platform development, enterprises must clearly define objectives and align them with business needs. Key considerations include:
What IT challenges need to be solved? (e.g., downtime reduction, anomaly detection, performance optimization)
What metrics will define success? (e.g., Mean Time to Resolution (MTTR), system uptime, cost savings)
What existing IT tools and processes need integration?
A collaborative approach involving IT teams, data scientists, and business stakeholders ensures alignment between AIOps capabilities and enterprise goals.
Step 2: Choose the Right AIOps Architecture
The AIOps platform should be designed with scalability, flexibility, and real-time processing in mind. A typical AIOps architecture consists of:
1. Data Collection Layer
Collects data from logs, metrics, traces, and event streams
Integrates with IT monitoring tools (e.g., Splunk, Datadog, Prometheus)
2. Data Processing & Normalization
Cleans and structures raw data to prepare it for analysis
Eliminates redundant, outdated, and irrelevant data
3. AI & Machine Learning Models
Uses anomaly detection, predictive analytics, and event correlation algorithms
Applies natural language processing (NLP) for automated log analysis
4. Automation & Remediation Layer
Implements self-healing capabilities through automation scripts
Provides recommendations or auto-remediation for IT incidents
5. Visualization & Reporting
Dashboards and reports for monitoring insights
Custom alerts for proactive issue resolution
By selecting the right cloud-based, on-premises, or hybrid architecture, enterprises ensure scalability and flexibility.
Step 3: Data Integration & Collection
AIOps thrives on real-time, high-quality data from multiple sources. The platform should ingest data from:
IT infrastructure monitoring tools (Nagios, Zabbix)
Application performance monitoring (APM) tools (New Relic, AppDynamics)
Network monitoring tools (SolarWinds, Cisco DNA)
Cloud services (AWS CloudWatch, Azure Monitor)
💡 Best Practice: Use streaming data pipelines (Kafka, Apache Flink) for real-time event processing.
Step 4: Implement AI/ML Models for Analysis
The core of an AIOps platform is its AI-driven analysis. Enterprises should develop and deploy models for:
1. Anomaly Detection
Identifies abnormal patterns in system behavior using unsupervised learning
Helps detect issues before they escalate
2. Event Correlation & Noise Reduction
Uses graph-based analysis to correlate alerts from different sources
Filters out noise and reduces alert fatigue
3. Predictive Analytics
Forecasts potential failures using time-series forecasting models
Helps IT teams take preventive action
4. Incident Root Cause Analysis (RCA)
Uses AI-based pattern recognition to identify root causes
Reduces mean time to detect (MTTD) and mean time to resolve (MTTR)
💡 Best Practice: Continuously train and refine models using historical and real-time data for higher accuracy.
Step 5: Implement Automation & Self-Healing Capabilities
The true power of AIOps comes from its ability to automate responses and remediation. Enterprises should:
Automate routine IT tasks like server restarts, patch updates, and log cleanup
Use AI-driven playbooks for common incident resolution
Implement closed-loop automation where AI detects issues and applies fixes automatically
💡 Example: If an AIOps system detects high memory usage on a server, it can automatically restart specific processes without human intervention.
Step 6: Develop Dashboards & Alerts for Monitoring
To provide IT teams with real-time insights, enterprises must develop intuitive dashboards and alerting systems:
Use Grafana, Kibana, or Power BI for visualization
Set up dynamic alert thresholds using AI to prevent false positives
Enable multi-channel notifications (Slack, Teams, email, SMS)
💡 Best Practice: Implement explainable AI (XAI) to provide transparent insights into why alerts are triggered.
Step 7: Test, Deploy, and Optimize
After development, the AIOps platform should be rigorously tested for:
Scalability: Can it handle large data volumes?
Accuracy: Are AI models correctly identifying anomalies?
Latency: Is the system responding in real-time?
After successful testing, deploy the platform in stages (pilot → phased rollout → full deployment) to minimize risks.
💡 Best Practice: Implement a feedback loop where IT teams validate AI recommendations and continuously improve models.
Step 8: Continuous Learning and Improvement
AIOps is not a one-time setup—it requires continuous monitoring and optimization:
Retrain AI models regularly with new datasets
Refine automation workflows based on performance feedback
Incorporate user feedback to improve accuracy and usability
💡 Best Practice: Schedule quarterly AIOps audits to ensure efficiency and alignment with business goals.
Conclusion
Developing an AIOps platform for enterprises requires a structured, step-by-step approach—from goal setting and data integration to AI model deployment and automation. When implemented correctly, AIOps can enhance IT efficiency, reduce downtime, and enable proactive incident management.
0 notes
Text
How to Use Apache JMeter for Performance Testing

1. Introduction
What is Apache JMeter?
Apache JMeter is an open-source tool designed for performance, load, and stress testing of web applications, APIs, databases, and more. It allows testers to simulate multiple users accessing an application simultaneously to measure its performance under different conditions.
Why Use JMeter for Performance Testing?
Free & Open-Source: No licensing costs.
User-Friendly GUI & Scripting Support: Suitable for beginners and advanced users.
Extensive Plugin Support: Allows for extended capabilities.
Supports Multiple Protocols: HTTP, FTP, JDBC, SOAP, and more.
Distributed Testing: Can generate a high load across multiple machines.
Common Use Cases for JMeter
Evaluating website and API performance under load.
Identifying server bottlenecks before deployment.
Stress testing to determine the breaking point of an application.
2. Installing Apache JMeter
Prerequisites
Java (JDK 8 or higher) installed. Verify using:
bash
java -version
JMeter Installation Package: Download from JMeter’s official site.
Installation Steps (Windows, macOS, Linux)
Extract the JMeter ZIP file into a directory.
Navigate to bin and launch JMeter:
Windows: Run jmeter.bat
macOS/Linux: Run ./jmeter
3. Understanding JMeter Components
Before running a test, it’s essential to understand JMeter’s building blocks:
Test Plan:
A test plan defines the structure of your performance test, including thread groups, samplers, listeners, and assertions.
Thread Group (Users & Load Simulation):
Defines number of virtual users (threads).
Specifies ramp-up time (gradual increase in users).
Controls loop count (number of test iterations).
Samplers (Types of Requests to Test)
JMeter supports different types of requests:
HTTP Request: Used for testing websites and REST APIs.
JDBC Request: Used for database performance testing.
FTP Request: Tests FTP servers.
Listeners (Result Analysis & Reports)
View Results Tree: Displays response details.
Aggregate Report: Provides overall test metrics.
Graph Results: Visual representation of response times.
Timers, Assertions, and Config Elements
Timers: Simulate realistic user wait times.
Assertions: Verify response correctness.
Config Elements: Store variables like base URL, login credentials.
4. Creating a Basic Performance Test
Step 1: Create a New Test Plan
Open JMeter → File → New Test Plan
Step 2: Add a Thread Group
Right-click on Test Plan → Add → Threads (Users) → Thread Group
Configure:
Number of Threads (Users): e.g., 100
Ramp-Up Period: e.g., 20 seconds
Loop Count: Infinite or fixed
Step 3: Add an HTTP Request Sampler
Right-click Thread Group → Add → Sampler → HTTP Request
Configure:
Server Name: example.com
Path: /login
Method: POST
Step 4: Add a Listener
Right-click Thread Group → Add → Listener → View Results Tree
Step 5: Run the Test & View Results
Click the Start (Green Play Button).
Observe the request-response details in View Results Tree.
5. Analyzing Performance Test Results
After running the test, it’s important to interpret the key performance metrics:
Metric Description Response Time Time taken to complete a request. Through put Requests processed per second. Error Rate Percentage of failed requests. Latency Time taken before the first response is received.
Example Report Interpretation:
High response times? Possible server bottleneck.
Low throughput? Needs performance optimization.
High error rate? Application may be failing under load.
6. Best Practices for Performance Testing with JMeter
1. Define Clear Test Objectives
What user load are you expecting?
What is the acceptable response time?
2. Simulate Real-World User Behavior
Use timers to avoid unrealistic rapid-fire requests.
Vary user interactions (e.g., login, browsing, checkout).
3. Monitor Server Performance
Use JMeter + APM tools (New Relic, Grafana, or AWS CloudWatch) to track CPU, memory, and database load.
4. Optimize JMeter Scripts for Large Tests
Avoid GUI Mode: Run tests in CLI mode (jmeter -n -t test.jmx).
Use Distributed Testing: Split the load across multiple machines.
5. Integrate JMeter with CI/CD Pipelines
Automate performance tests using Jenkins, GitHub Actions, or GitLab CI/CD.
7. Conclusion
Apache JMeter is a powerful tool for performance testing web applications, APIs, and databases. With a structured approach — defining test plans, running load tests, and analyzing results — developers and testers can identify bottlenecks and improve application scalability.
WEBSITE: https://www.ficusoft.in/software-testing-course-in-chennai/
0 notes