#isobars
Explore tagged Tumblr posts
Text
meteorology is so cool. i wish meteors were real
12 notes
·
View notes
Text
i keep waking up to my youtube autoplay half way through a multi hour long video abt physics
#todays hit: 'thermodynamics PV diagrams internal energy heat work isothermal adiabatc isobaric physics'#i dont know what those words mean.#rambles
2 notes
·
View notes
Text

The most important quantity for meteorologists is of course the product of latent pressure and temperostrophic enthalpy, though 'how nice the weather is' is a close second.
Skew-T Log-P [Explained]
Transcript
How to interpret a skew-T log-P diagram
[The comic shows a skew-T log-P diagram. On it are various labels, including isobars, comments, and other interpretations of the diagram.] Latent Heat of Cooling Isobars Omnitrophic Wind Isomers Line of Constant Thermodynamics Uncomfortable Moist Adiabat Oops, the balloon flew through a ghost These lines are slightly different because Dave messed them up No birds up here :( Track of Rising Weather Balloon Track of Popped Balloon Falling Back Down Meteogenesis Seems Bad Dew Point Heavyside Layer These Lines Are Tilted Because the Wind Is Blowing Them Don't Stand Here Or you Might get Hit By A Balloon
[Left to the diagram is an upwards-pointing arrow with the label "Pressure Latitude". Right to the diagram is a downwards-pointing arrow with the label "Entropic Density". Below the diagram is a right-pointing arrow with the label "Enthalpic Pressure".] [The remaining various labels are inside the diagram.]
166 notes
·
View notes
Text
what the fuck do you mean there are 60mph wind gusts forecast for tomorrow and this isn't a named storm???

look at those isobars. look at that low pressure. if this shit doesn't get named I'll be amazed but holy shit they're waiting right 'til the last minute if that does happen
20 notes
·
View notes
Text
"isobar" is one of those words where broad scientific literacy really comes back to bite me because i always think "no, it can't be that, that's a term in [meteorology/nuclear physics], not [nuclear physics/meteorology]" and have to google "term for [nuclides with same mass/contours of equal pressure]"
21 notes
·
View notes
Text
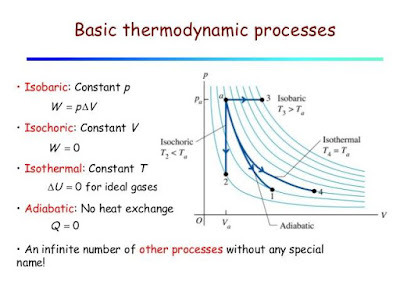
Thermodynamic Processes: Isobaric, Isochoric, Isothermal, and Adiabatic
A process in thermodynamics is the method by which the initial state of a system changes to the final state of a system. Technically speaking, there are countless types of thermodynamic processes to define each possible method in existence, most of which are unnamed. Of the specific named thermodynamic processes, there are four basic options.
Isobaric, isochoric, and isothermal (and, indeed, any other processes with the prefix iso-) are all processes in which a single variable is kept constant. For isobaric, pressure is constant, for isochoric, volume is constant, and for isothermal, temperature is constant. The fourth option, adiabatic processes, are processes in which there is no exchange of heat.
Sources/Further Reading: (Image source - Mechanics Tips blog) (University of Illinois lecture slides) (University of Central Florida) (Wikipedia) (Law of Thermodynamics Info)
51 notes
·
View notes
Text
Ezana Concept Art
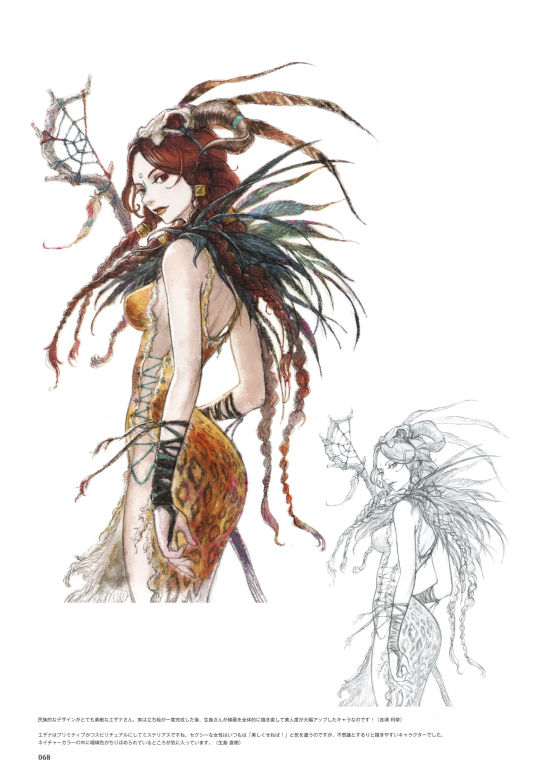
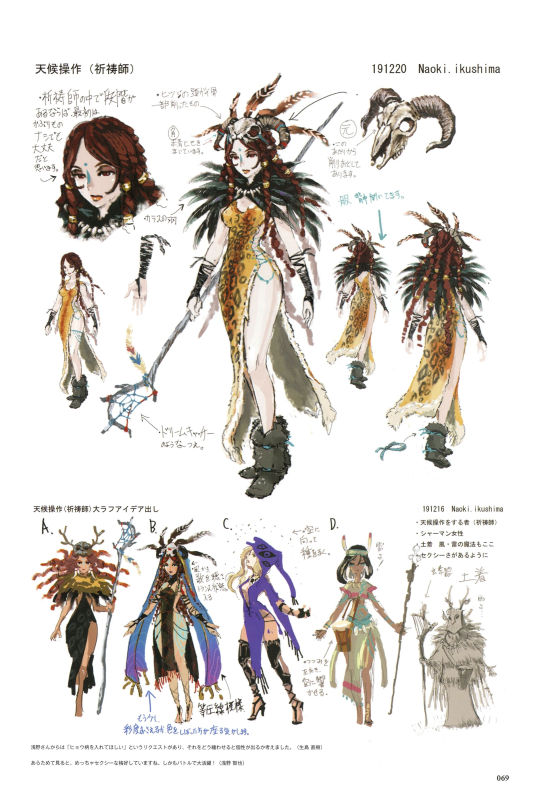

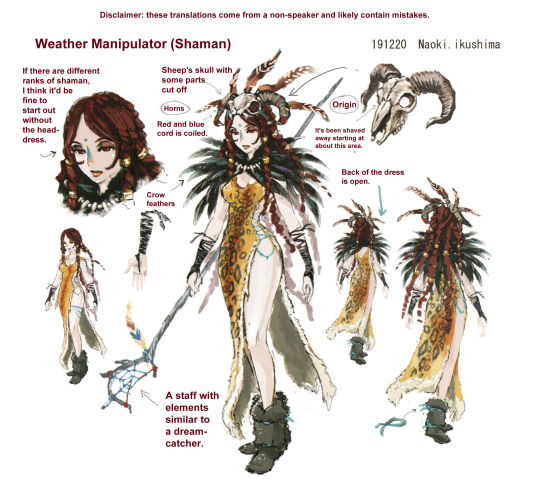
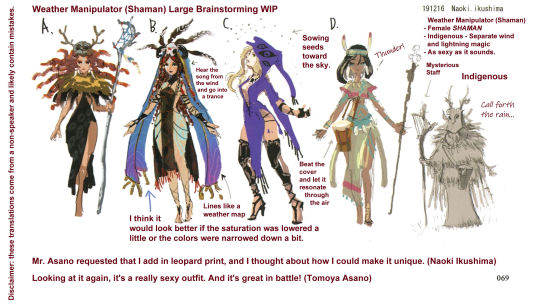
Concept art and translations for Ezana! Translation notes and image id under the cut.
Translation notes:
On the first page when Ikushima is talking about how he feels pressure to make his drawings beautiful, he's actually saying something more like "Usually with sexy woman I go 'I'm obligated to/I must make them beautiful!'... " but no matter how I phrased it the wording felt awkward in English, so I changed the sentence to go without the quotes.
There's a note on the second page above the monochrome sketch that was pretty hard to read (the middle character in particular might have been scribbled out?), so I kind of guessed at the rough meaning from the surrounding characters. The first kanji seems to be 玄, which has the general meaning of "mysterious, occultness, black, deep, profound," and the third kanji seems to be 器, which has the general meaning of "utensil, vessel, receptacle, implement, instrument, ability, container, tool, set". I went with "mysterious staff" as the meaning of the kanji together, also working off of the fact that it's. um. pointing at a staff that seems vaguely mysterious.
"Call forth the rain" was more literally just "rain," but it uses a particle at the end that has a vaguely commanding/requesting vibe to it, so I added extra words to convey that.
There's a part on the second page where I write "SHAMAN" in all caps. On that particular line, "Shaman" was written out using English phonetics, whereas on the rest of the page when I use the word it's the Japanese word for an equivalent concept.
"Lines like a weather map" is literally "isobar pattern". I'm assuming that most people aren't familiar with the word "isobar" (including myself) but from a brief google search, isobars are the lines that show up on a map when weather forecasts are trying to show the range of a storm and the barometric pressure specifically. Since it's (probably) not a commonly-known word, I just wrote out the "weather map" stuff instead.
"Sexy as it sounds" is a weird one. I think it's a portion of this phrase, which is defined as, "not existing despite seeming like it should", but just uses some different particles at the end which I'm assuming make it non-negative (e.g., "as sexy as it should be"). But I couldn't find a ton of examples of how the phrase is used though or what the differences in particles would be, so I just kind of went with the auto-translation I got from Deepl.
Image id:
[id: Multiple images from the Triangle Strategy artbook surrounding Ezana Qlinka. There is a page with a large colored portrait of her, along with a smaller line drawing in the corner. There are two illustrator's notes at the bottom: the first is, "Ezana has a really lovely ethnic design. Actually, after the character's portrait was completed, Mr. Ikushima redid all the linework, which added a lot to the character's beauty! (Yoshiura Rina)" and the second is, "Ezana is primitive, spiritual, and also a mysterious kind of character. With sexy women I usually feel pressure to make them beautiful, but strangely she was very easy to draw. I like how the natural colors are interspersed with the lapis lazuli. (Ikushima Naoki)". On the second page, the top half has several drawings of Ezana in a design close to her canon one. It is titled, "Weather Manipulator (Shaman)". There is one drawing where Ezana is without her headdress, captioned, "If there are different ranks of shaman, I think it'd be fine to start out without the headdress." There is a note pointing to her headress labeled, "Sheep's skull with some parts cut off," and another that reads, "Horns. Red and blue cord is coiled." Another note points to a full sheep skull and reads, "Origin. It's been shaved away starting at about this area." It points to roughly the middle of it. Another note points to a feather ruff she wears, labeled, "Crow feathers". Her staff is labeled, "A staff with elements similar to a dreamcatcher". There is a portrait of her from the back, with a note reading, "Back of the dress is open." The second half of the page is titled, "Weather Manipulator (Shaman) Large Brainstorming WIP". There are 5 drawings, each of a different potential design. The first is similar to her canon design, but with darker skin and a black dress. The second is very colorful, and has the notes, "Hear the song from the wind and go into a trance" as well as "Lines like a weather map" and "I think it would look better if the saturation was lowered a little or the colors were narrowed down a bit." The third drawing has a purple cloak with eyes on it, and seems to be throwing seeds into the air, captioned, "Sowing seeds toward the sky." The fourth design uses more pastels/bright colors, and has a drum at her hip. She seems to be saying, "Thunder!" and there is a note that reads, "Beat the cover and let it resonate through the air." The fifth drawing is of a woman wearing a full mask and a heavy cloak made of grass fibers. It has several bullet points including, "Weather Manipulator (Shaman)," "Female SHAMAN", "Indigenous - Separate wind and lightning magic", and "As sexy as it sounds." She holds a staff which is labeled, "Mysterious Staff" and also has a note reading, "Indigenous". She seems to be saying, "Bring forth the rain..." There are two illustrator's notes on the bottom. The first reads, "Mr. Asano requested that I add in leopard print, and I thought about how I could make it unique. (Naoki Ikushima)" and the second reads, "Looking at it again, it's a really sexy outfit. And it's great in battle! (Tomoya Asano)" /end id]
#triangle strategy#ts artbook character ref sheets#ezana qlinka#triangle strategy artbook#I don't like to assume any real meaningful information about the people behind team asano based off these little notes#especially since I'm not a native speaker#but I DO think it's really funny that every other time ikushima's in charge of a design#his illustrator's note seems to be something like 'asano asked me to change it :('#and asano's note is 'looks pretty good if I do say so myself! :)'#that B design in particular is really cool to me with all the weather patterns#though I can see why they felt like the colors were maybe too bright for tri strat
15 notes
·
View notes
Text
i say i am isobaric because i have constant pressure
47 notes
·
View notes
Photo


(via Under Intense [Air] Pressure from Rollercoaster Isobars)
.....
Fibromyalgia has narrowed my world in a way that nothing else ever has... Then it also got itself a "friend" -- Long COVID. Long COVID then went and got SEVERELY Exacerbated by Five Months of Hellish BURNOUT because of the STUPID Hospital's Treatment (or amazing lack thereof) of Lolli. Said BurnOut has rendered me... Entirely Non-Functional.
In about as bad a condition as I was when I was battling SEPSIS.... But Then... Along Comes The Big Fibro Nemesis... The GODDAMNED WEATHER -- And the Rollercoaster Isobars that cause PAIN & Paresthesia like No Other to me...
2 notes
·
View notes
Text
She Isobaric on my Bar til i reach 500mb of pressure
2 notes
·
View notes
Text
It's very windy outside. The meteorologists keep spacing out the isobars or whatever.
2 notes
·
View notes
Text
*trying to draw a reference for prominence
*lose my tin of colors somewhere in my room
*steals baby nephew’s color pencils
*realize there’s no black pencil so color with drawing pencil
*try to find the scanner
*lose plug to scanner
*don’t realize i got my switch plug instead and try to plug it in
*poopy broken isobar sparks and shorts out the fuse for my whole bedroom

2 notes
·
View notes
Text
Meteorologist Chappell Roan be like you you can map a pressure gradient with one hundred isobars
vehicular manslaughter chappell roan be like you can hit a hundred boys with cars
29K notes
·
View notes
Text
Sebum
a dysphoric calamity,
clamoring in the caverns of my pores,
seeping from the brim,
oozing for my attention.
a viscous cataclysm,
pouring over the remnants of my senses,
weighing on my shoulders,
suffocating even affection.
an isobaric ache,
bearing on my soul,
never to be rid of,
forever unable to let go.
0 notes

