#Stock Market Indices
Explore tagged Tumblr posts
Visit Tumblr Blog
Explore Tumblr blogs with no restrictions, modern design and the best experience.
Last Seen Tumblr Blogs


Fun Fact
The Tumblr office adopted Tommy, an 11-year-old Pomeranian.
Text

Learn how to trade Indices with CapitalXtend! Start by choosing a trusted broker, funding your account, and selecting your preferred index. Open a trade, monitor market trends, and take advantage of global opportunities. Start trading indices today.
0 notes
Text
Stock Market:Debt ratios explained
youtube
#stock market indices#investing stocks#stocks#stock market debt#debt#ratiosofstockmarket#howtoinvestinshare#howtoinvestinmarketofstocks#howtoinvestinsharemarket#how to invest#stockholm#stock trading#stock market#debt of time#Youtube
0 notes
Text
Get Ready for the Real Santa Claus Rally

Headed down to Wall Street yesterday to pave the way for Santa. As Yale Hirsch’s now famous line states: “If Santa Claus should fail to call, bears may come to Broad and Wall.”
This rather typical early December seasonal weakness sets up the Santa Claus Rally well. The Street has been buzzing about the Santa Claus Rally for three months now. Most still get it wrong. It’s not the yearend rally, the Q4 rally that runs from Halloween through January. Yes, November, December and January are the best three months of the year, but they are not the Santa Claus Rally.
Santa Claus Rally was devised by Yale Hirsch in 1972 and published in the 1973 Stock Trader’s Almanac. The “Santa Claus Rally” is the last 5 trading days of the year plus the first 2 of New Year. This year it begins on the open on December 24 and lasts until the second trading day of 2025, January 3. Average S&P 500 gains over this seven trading-day range since 1969 are a respectable 1.3%.
Failure to have a Santa Claus Rally tends to precede bear markets or times when stocks could be purchased at lower prices later in the year. Down SCRs were followed by flat years in 1994, 2005 and 2015, two nasty bear markets in 2000 and 2008 and a mild bear that ended in February 2016.
This is the first leg of our January Indicator Trifecta (2025 STA p 20) which includes the “First Five Days” (2025 STA p 16) and the full month “January Barometer” (2025 STA p 18), also invented and named by Yale Hirsch in 1972. This January Trifecta helps us affirm or readjust our outlook. When we hit this Trifecta and all three are positive S&P is up 90.6% of the time with an average gain of 17.7%.”
Based upon the outcome of these three indicators, we may adjust our outlook for the balance of Q1 and 2025. Until then, we remain bullish as this is the seasonal favorable period for stocks. Valuations are a concern, but economic data is holding up, the Fed is cutting interest rates, and the market continues to track seasonal trends and patterns rather closely.”
Stay tuned for more on the rest of my January Indicator Trifecta and sign up for my newsletter to get my official readings and analysis. And get the 2025 Stock Trader’s Almanac as a free bonus. https://stocktradersalmanac.com/LandingPages/get-Almanac-for-free.aspx

#santa claus rally#stock market#Seasonality#seasonal#patterns#s&p 500#January#Barometer#Indicator#Trifecta
23 notes
·
View notes
Text
Bullish Marubozu: An Important Signal for Uptrend
Among candlestick patterns in market analysis, the Bullish Marubozu candlestick is a bullish indicator that is simple to understand and very effective. Unlike other candlesticks, which may show shadows or wicks, the Bullish Marubozu is unique in its simplicity���it has no shadows.
What Is the Bullish Marubozu?
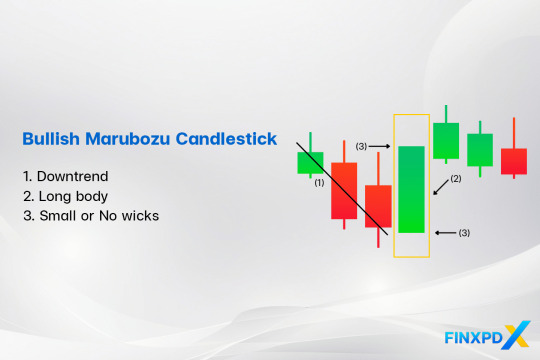
The Bullish Marubozu candlestick is a bullish candlestick pattern that shows strong buying pressure throughout the trading session. It has a long white or green body with no shadows or wicks, meaning the price opened at its lowest and closed at its highest point.
The name “White Marubozu” is another name for a Bullish Marubozu candlestick that combines its appearance and Japanese origins. “White” refers to the bullish candle color, and “Marubozu,” meaning “bald” in Japanese, describes its lack of wicks.
Characteristics of the Bullish Marubozu Candlestick
Bullish Marubozu: Features a long, solid green body with little to no wicks.
Full Bullish Marubozu: No wicks at all, showing the strongest bullish control throughout the session.
Open Bullish Marubozu: No lower wick but a small upper wick, indicating a strong upward move with slight selling pressure at the end.
Close Bullish Marubozu: A small lower wick but no upper wick, reflecting strong buying with a slightly higher open.
Read more: FinxpdX
Download PDF: 35 Powerful Candlestick Patterns
#investing#finance#investment#financial#stocks#forex#forextrading#forex market#candlestick#candlestick patterns#Marubozu#bullish#forex indicators
4 notes
·
View notes
Text
Importance of chart analysis for equity investments
Image by freepik Chart analysis, or technical analysis, can be quite helpful for equity investment in the Indian stock market. Here are several reasons why it is beneficial: Benefits of Chart Analysis in the Indian Stock Market 1.Trend Identification The Indian stock market, like any other, exhibits trends over time. Chart analysis helps in identifying these trends, allowing investors to ride…
#chart analysis#equity investment#Financial Markets#Indian stock market#investment strategies#market analysis#Market Sentiment#Stock Charts#Stock Market#Stock Trading#Support and Resistance#Technical Analysis#Technical Indicators#Trading Patterns#Trend Identification#Volume Analysis
3 notes
·
View notes
Text
AI-Signals: AI-Powered Buy and Sell Indicator for TradingView
AI-Signals stands as the world’s first AI-powered trading community, committed to nurturing a community of passionate traders. The AI-powered indicator, crafted with cutting-edge machine learning algorithms, takes into account a wide range of parameters to provide the most accurate buy and sell signals. This tool guides traders on the exact moments to enter and exit a trade, thereby facilitating smarter trading.
An integral feature of AI-Signals is the 24/7 AI Trading Chat Bot, available on their website. Trained on AI-Signals data, this chat bot is capable of answering any AI-Signals or trading-related queries. This feature assists traders in their journey towards becoming successful in their trading endeavors. Additionally, AI-Signals hosts a supportive Discord community, filled with individuals who share insights and educational content.
Trusted by traders worldwide, AI-Signals is on a mission to help traders enhance their trading knowledge and skills using AI-powered trading. The AI-Powered Buy & Sell Signals, AI-Powered Auto Order Blocks, and AI-Powered Auto Risk Management are some of the key features of the indicator.
AI-Signals offers two plans: a free Beta Indicator with simple Beta buy/sell signals, and a Full Version at $67 per month. The Full Version includes AI-powered buy & sell signals, AI-powered
risk management, AI-powered order blocks, and VIP Discord Invitations to exclusive events worldwide.
Beta users have already reported significant improvements in their trading. “AI Signals completely transformed my trading game,” said Mike Stuart, one of the first Beta users. “Even during the beta phase, the indicator helped me make profitable trades consistently. I can’t wait to see how the final product will perform!”
With its AI-powered indicator, AI-Signals is poised to transform the trading landscape, making trading more accessible and profitable for traders across the globe.
As part of its commitment to making trading more accessible, AI-Signals is inviting traders to visit their website and try the free Beta Indicator. This is an opportunity to experience firsthand the transformative power of AI in trading. For those who wish to take their trading to the next level, early access to the Full Version Indicator is also available.
About AI-Signals
AI-Signals is the world’s first AI-powered trading community. The company provides an AI-powered buy and sell indicator for TradingView, designed to make trading more profitable by providing precise buy and sell signals. AI-Signals is committed to building a community of passionate traders who are committed to enhancing their trading knowledge and skills using AI-powered trading.
For more information visit:
ai-signals.com
6 notes
·
View notes
Text
Market Cycles-Definition And Phases
A new market cycle that is industry-specific and not universal across all market segments can be brought on by new technology or regulatory changes.
The term "business cycle forecasting" describes the methods and tools used to anticipate changes in the business cycle, notably at the beginning of recessions. Let's see about the market cycle and its phases below:

What is the Market cycle?
The market cycle is a term used to describe economic trends seen in many commercial settings. When certain securities belonging to the same class of assets do better than others, it is also known as a stock market cycle.
It can be because the securities underlying the business model allow for growth under the current market conditions.
Phases:
The four phases of a market cycle involve securities responding to different market conditions. They are:
Accumulation Phase:
Early buyers include business insiders, value investors, and people who obtained capital during the collapse.
Prices are attractive, but caution is still present, and the attitude is still negative. Some have given up and accepted losses, and the media still covers the last slump.
Markup Phase:
The markup phase is characterized by a rise in market volumes, rising valuations, and a selling climax due to the participation of fence-sitters and risk-averse investors.
Market sentiment switches from neutral to bullish or euphoric, with a last parabolic price rise due to fence-sitters. Non-linear indicators significantly streamline and enhance the quality of traders' jobs.
Distribution Phase:
The third stage of the market cycle, known as the distribution phase, is when traders start to sell securities, and the outlook for the market shifts from bullish to mix.
Prices remain constant over several months but may accelerate due to negative geopolitical or economic news.
Mark-down phase:
The mark-down phase is the final phase of a market cycle, where security prices fall below what investors originally paid for them. It also signals the start of the subsequent accumulation phase.
As cycle analysis turns more bearish, investors start to exit their positions and lock in profits, increasing the existing selling pressure.
Final words:
Hence, these are the four phases of Market cycles. This cycle, usually called cycle analysis stock market, is a general phrase used to describe trends or patterns that appear throughout many markets or commercial contexts.
2 notes
·
View notes
Text

0 notes
Text
0 notes
Video
youtube
What's the Real Reason Behind Today's Market Highlights?
#youtube#Today's Stock Market Highlights in 60 Seconds! Hey everyone! Here’s your quick update from the stock market today! 📈 Major indices are s
0 notes
Text
Stock Market:Debt Good or bad
youtube
#stock tips#stock market indices#investing stocks#howtoinvestinsharemarket#howtoinvestinmarketofstocks#how to invest#howtoinvestinshare#how to invest in stocks#stocks#debt#isdebtgoodorbad#stock market debt#stock market ofindia#stock market#investment strategy#return on investment#return on equity#investment plans#Youtube
0 notes
Text

Visit our website today, combined monetary value of more than $8500 worth of products you can trial.
www.quaderr.com
0 notes
Text
Interface Inc. Stock Forecast: Should You Buy or Wait?
Discover Interface Inc.'s stock price forecasting. Learn why waiting for a market correction can enhance your investment returns. #InterfaceInc #TILE #stockpriceforecasting #investmentportfolio #profitabilityindicators #stockmarketanalysis #dividendpolicy
Interface Inc is a global leader in the commercial flooring industry, known for its innovative and sustainable products. The company focuses on creating environmentally friendly flooring solutions, including carpet tiles and modular carpet systems. Interface operates in multiple segments, including Corporate Office, Retail, Healthcare, and Education. The company has a strong presence in North…
#Commercial flooring industry#Dividend policy#Financial performance#Interface Inc#Investment#Investment Insights#Investment portfolio#Market correction#Profitability indicators#Stock Forecast#Stock Insights#Stock market analysis#Stock price forecasting#Sustainable products#TILE
0 notes
Text
Trade Smarter, Earn More – With Exness!
Step into the world of trading with a partner that prioritizes your success. Exness offers unbeatable trading conditions designed to help you achieve financial freedom and afford the lifestyle you’ve always dreamed of.
What Sets Us Apart?
🌟 67% Spread Reduction – Experience massive savings on trading costs. Spreads on top indices like US30, US500, and USTEC have been slashed by a remarkable 67%!
🌟 Higher Rebates on All Trades – Keep more of what you earn.
🌟 Zero Sign-Up Fees – Start trading for free.
By trading with reduced spreads, you can maximize your profits and minimize costs, giving you a significant edge in the market.
Don’t miss out on these exclusive benefits available to my referred clients.
Sign up today and start trading with Exness – Where Better Spreads Mean Bigger Opportunities!
#forex#money#stock market#trade#crypto cryptocurrency bitcoin ethereum blockchain btc cryptotrading cryptonews eth cryptocurrencies nft bitcoinnews bitcoins#stocks#indices#indian market#cryptocurrency#how to trade forex#onlinemarket#tradingtips#us market#xauusd
0 notes
Text
Stock market setup: Nifty 50, global trades.
The Nifty 50 reflects India’s economy and is closely tied to global market dynamics. Currency fluctuations, global trade, economic health, and geopolitical risks influence its performance. As global trade and investments shape it, the Nifty 50 becomes essential for tracking India’s economic progress in a global context.
#Nifty 50#Indian Economy#Global Market Dynamics#Currency Impact#Global Trade Influence#Geopolitical Risk Factors#Economic Indicators#Stock Market Trends#India’s Economic Growth
0 notes