#DataMapping
Explore tagged Tumblr posts
Text
Auto parts Catalog software - Anzael
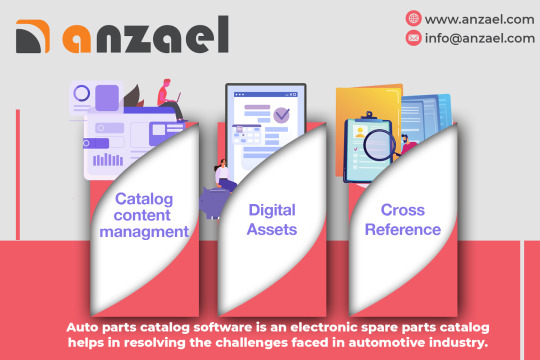
Anzael has millions of cross-reference parts. Get solutions for your aces and pies data mapping needs, data validation, catalog printing format, and data consultation services.
Auto parts catalog software is an electronic spare parts catalog that helps in resolving the challenges faced in the automotive industry. Choose Anzael for your auto parts data management services.
2 notes
·
View notes
Text
#Greetings from Ashra Technologies#we are hiring#ashra#ashratechnologies#jobs#hiring#jobalert#jobsearch#jobhunt#recruiting#recruitingpost#maximo#ibm#java#automation#dataloading#datamapping#dataextraction#upgrade#patching#installation#integrity#chennai#bangalore#pune#mumbai#linkedin#linkedinprofessionals#linkedinlearning#linkedinads
0 notes
Text
Transforming Data into Actionable Insights with Domo

In today's data-driven world, organizations face the challenge of managing vast amounts of data from various sources and deriving meaningful insights from it. Domo, a powerful cloud-based platform, has emerged as a game-changer in the realm of business intelligence and data analytics. In this blog post, we will explore the capabilities of Domo and how it enables businesses to harness the full potential of their data.
What is Domo?
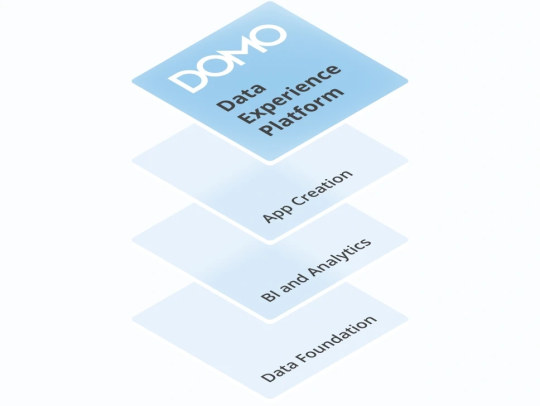
Domo is a cloud-based business intelligence and data analytics platform that empowers organizations to easily connect, prepare, visualize, and analyze their data in real-time. It offers a comprehensive suite of tools and features designed to streamline data operations and facilitate data-driven decision-making.
Key Features and Benefits:
Data Integration: Domo enables seamless integration with a wide range of data sources, including databases, spreadsheets, cloud services, and more. It simplifies the process of consolidating data from disparate sources, allowing users to gain a holistic view of their organization's data.
Data Preparation: With Domo, data preparation becomes a breeze. It offers intuitive data transformation capabilities, such as data cleansing, aggregation, and enrichment, without the need for complex coding. Users can easily manipulate and shape their data to suit their analysis requirements.
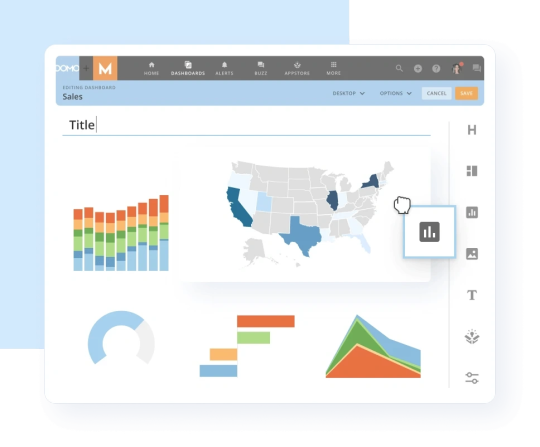
Data Visualization: Domo provides powerful visualization tools that allow users to create interactive dashboards, reports, and charts. It offers a rich library of visualization options and customization features, enabling users to present their data in a visually appealing and easily understandable manner.
Collaboration and Sharing: Domo fosters collaboration within organizations by providing a centralized platform for data sharing and collaboration. Users can share reports, dashboards, and insights with team members, fostering a data-driven culture and enabling timely decision-making across departments.
AI-Powered Insights: Domo leverages artificial intelligence and machine learning algorithms to uncover hidden patterns, trends, and anomalies in data. It provides automated insights and alerts, empowering users to proactively identify opportunities and mitigate risks.
Use Cases:
Sales and Marketing Analytics: Domo helps businesses analyze sales data, track marketing campaigns, and measure ROI. It provides real-time visibility into key sales metrics, customer segmentation, and campaign performance, enabling organizations to optimize their sales and marketing strategies.
Operations and Supply Chain Management: Domo enables organizations to gain actionable insights into their operations and supply chain. It helps identify bottlenecks, monitor inventory levels, track production metrics, and streamline processes for improved efficiency and cost savings.
Financial Analysis: Domo facilitates financial reporting and analysis by integrating data from various financial systems. It allows CFOs and finance teams to monitor key financial metrics, track budget vs. actuals, and perform advanced financial modeling to drive strategic decision-making.
Human Resources Analytics: Domo can be leveraged to analyze HR data, including employee performance, retention, and engagement. It provides HR professionals with valuable insights for talent management, workforce planning, and improving overall employee satisfaction.
Success Stories: Several organizations have witnessed significant benefits from adopting Domo. For example, a global retail chain utilized Domo to consolidate and analyze data from multiple stores, resulting in improved inventory management and optimized product placement. A technology startup leveraged Domo to analyze customer behavior and enhance its product offerings, leading to increased customer satisfaction and higher revenue.
Domo offers a powerful and user-friendly platform for organizations to unlock the full potential of their data. By providing seamless data integration, robust analytics capabilities, and collaboration features, Domo empowers businesses to make data-driven decisions and gain a competitive edge in today's fast-paced business landscape. Whether it's sales, marketing, operations, finance, or HR, Domo can revolutionize the way organizations leverage data to drive growth and innovation.
#DataCleaning#DataNormalization#DataIntegration#DataWrangling#DataReshaping#DataAggregation#DataPivoting#DataJoining#DataSplitting#DataFormatting#DataMapping#DataConversion#DataFiltering#DataSampling#DataImputation#DataScaling#DataEncoding#DataDeduplication#DataRestructuring#DataReformatting
0 notes
Text
#aitools#ai#artificialintelligence#digitaltwin#indoormapping#newtech#geospatialdata#datamapping#gis#mapping#geospatialtechnology#gismapping#dmapping#geospatial#dmap#digitaltwins#machinelearning#lidar#onpassiveai#onpassive#assetmapping#maps#fieldmapping#aitechnology#dataextraction#earth#voxelmaps#utilitymapping#onpassiveaitools#dmodeling
0 notes
Text

Dirty data can lead to lost opportunities and revenue. Don't let your business suffer due to inaccurate or incomplete data. Our data cleansing services can help you clean and standardize your data, so you can make informed decisions and achieve your business goals. Contact us today to learn more about how we can help you keep your data clean and sparkling!
For more information, https://hirinfotech.com/data-cleansing/ or contact us at [email protected]
#data cleansing services#dataquality#data#hirinfotech#dataset#data transfer#datavalidation#data processing#datamapping#problem solving#business
0 notes
Text
My latest mapping project. Based on the data collected by https://datamap-scotland.co.uk/ but also added a bit more filtering options. Will try to add some historical graphs where possible as well.
2 notes
·
View notes
Text
"Guardians of Privacy: Privacy Management Software Market 2025–2033 🔐🌐"
Privacy Management Software Market is rapidly expanding, fueled by growing regulatory requirements and heightened consumer awareness around data privacy. These solutions enable organizations to manage personal data effectively, ensuring compliance with global privacy laws and fostering trust through transparency. Key features include data mapping, consent management, incident response, and privacy impact assessments.
To Request Sample Report : https://www.globalinsightservices.com/request-sample/?id=GIS31522 &utm_source=SnehaPatil&utm_medium=Article
As businesses face complex privacy challenges, the market has seen substantial growth. The data discovery and mapping sub-segment leads, playing a critical role in identifying sensitive data across IT ecosystems. Consent management follows as a high-performing segment, driven by an emphasis on user consent and ethical data practices.
Regionally, North America dominates, supported by advanced privacy laws like the California Consumer Privacy Act (CCPA) and a mature tech infrastructure. Europe, propelled by the General Data Protection Regulation (GDPR), ranks as the second-largest market, with Germany leading in adoption due to its strong commitment to privacy rights.
In 2023, the market reached an estimated 350 million units, with projections to grow to 600 million units by 2033. The data protection segment commands the largest share at 45%, followed by consent management (30%) and risk assessment tools (25%). Leading players such as OneTrust, TrustArc, and BigID continue to innovate, leveraging AI, machine learning, and blockchain technologies to stay competitive.
While the market offers promising growth opportunities, particularly in emerging markets and sectors like healthcare and finance, challenges such as evolving regulatory landscapes and cybersecurity threats persist. Despite these hurdles, a 15% annual growth rate is anticipated, driven by investments in AI-powered analytics and cloud-based solutions.
#PrivacyManagement #DataProtection #GDPRCompliance #CCPA #PrivacySoftware #AIinPrivacy #DataMapping #ConsentManagement #RiskAssessment #DataPrivacy #CyberSecurity #TechInnovation #CloudPrivacy #DigitalCompliance #TrustInTech
0 notes
Text
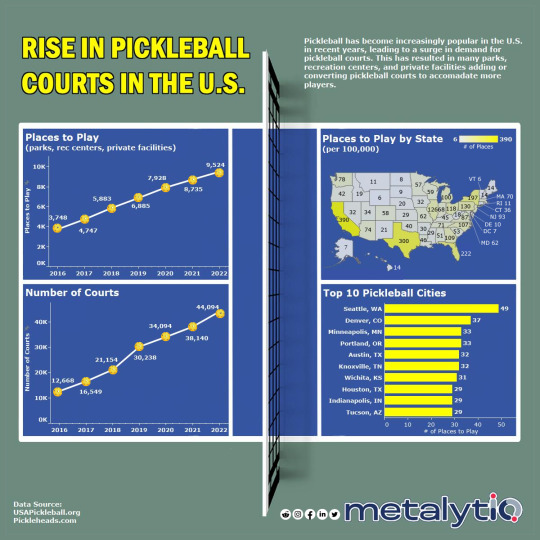
In recent years, the popularity of pickleball has skyrocketed in the United States, resulting in a surge in the number of pickleball courts across the country. Pickleball is a fun and easy-to-learn sport that combines elements of tennis, badminton, and ping pong, making it appealing to people of all ages and skill levels. As more people have discovered the joys of playing pickleball, there has been a growing demand for facilities where they can play. To meet this demand, many parks, recreation centers, and private clubs have started to install pickleball courts, sometimes even converting underutilized tennis or basketball courts. This trend shows no signs of slowing down, as more and more people are embracing pickleball as a fun and social way to stay active and enjoy the great outdoors.
Data Source:
#pickleball #pickleballislife #pickleballrocks #pickleballcourt #pickleballaddict #pickleballers #datavisualization #dataviz #data #infographic #datavisualisation #graphs #dashboard #chart #charts #graph #viz #visualization #graphicdesign #dataillustration #dataanalytics #metrics #visualcreative #datadriven #infographicdesign #map #gis #geospatial #datamapping #metalytiq
0 notes
Link
At B2B Sales Arrow, the data management professionals develop & sub-divide nearly 50,000 data records and deliver implacable and best quality data to the client.
Within four weeks, the data management professionals at B2B Sales Arrow could develop and sub-divide nearly 50,000 data records and deliver uncompromising data quality to the client
#marketresearch#datamining#datadrivenmarketing#deepdataresearch#demandgeneration#datavalidation#datamapping#databasepositioning#csuiteleadgeneration#b2bservices#leadgeneration#databaseservices
1 note
·
View note
Photo

REFLECTIVE JOURNALISM | DATA MAPPING OBJECTS
THE BEGINNING
The data object brief was my first assignment for ICT so for me it was about getting use to the course structure and the process of how a project would unfold. It was also my first group assignment for the course, so it was just a matter of going with the flow and seeing what unfolds. Initially when Ricardo pitched the brief in the morning lecture with some amazing examples of how data could be translated into a product and seeing how these products could help you understand an issue or be a constant reminder of an problem by either just being a simple stand-alone form or through human interactiveness. It seemed like an amazing assignment to work on, especially because the brief was somewhat to do with product design which is something I love. But as I went along one of the biggest hurdles I found was to find a data set and the problem was that I was reverse engineering the whole process, I was trying to imagine the product I wanted to make and trying to find a data that’ll help me achieve that. This made the process very slow and tedious, by the end of the week there was only a bunch of links collected with no grounding of what, how and where I wanted to go.
Week two. The first week was a slow weeks for most students with similar problems and there wasn’t much progress being made so the teachers though it was a good idea to put us in groups. We did this by putting post-it notes with our issue on a wall with everyone else’s notes, groups were then made by people with similar projects. Mine was an environmental issue, looking at global energy consumption and the usage of energy sources.
GOING IN TO GROUPS
Once we were in groups we faced similar problem, trying to figure out what we wanted to make before specifying on the dataset from the links. Most of us thought that in-order for the project to be good we had to choose a complex issue and use multiple dataset, this really set us back. We were so stuck with finding that ideal data-set that another week went by and we had a collection of links and plenty of ideas for a product by non to act on.
We’d set-up a trello account to manage and assign tasks but we barely used it due to the casualness of the whole process. We though we’d assign tasks once we had a data set, but because we didn’t get around to doing this until the first week of holiday, there were no deadlines or task assigned. Towards the end of the the first week working as a group we had Kinda decided on a product (Wind-mill) and on the second week with Sangeeta’s help we’re hustled towards choosing a dataset (global renewable energy usage from 1965 -2015). This was great, for the first time we felt that we’re getting somewhere and there was a sense of achievement. The girls worked on simplifying the data onto a chart and converting it to cm, the boys worked on researching on wind-chimes (design, style ect). We noticed that the data was very small in numbers and so the impact on the product wouldn’t be that strong, so we just took the beginning 1965 and the end 2015 cutting out everything in between and using that to base our product on. We created a couple of prototypes with existing materials in the class room, pens, paper and ice-block sticks. The following day we went to look sharp and bought mini toothpick wind-chimes to create our second prototype, the day after we cut open plastic bottles and thick zip lock bags and used them to create a event bigger free-standing model. With all these prototypes we didn’t have a specific goal in mind, we’re just getting the ideas out of our head by exploring.
While progress was being made, there was still a lack of interest within our group of actually going ahead with our current data-set and product.
Square 1
We had created 3-4 prototypes by now but it still didn’t feel exciting, I guess we’re still subconsciously exploring possibilities of what to do and actually choosing a dataset and doing it made us realise that it wasn’t something we wanted to do. We had previously brought up deforestation as an option so we eventually gravitated back to that. It was two days before mid-semester break and it basically went in gathering new links for deforestation data-sets. We’d come up with a few new ideas, one of the products we thought of was, a tea coaster. These coasters would be cut from a fallen tree branch at different thickness and different angle. The idea was the damage would be mapped on the angle at which the wood slab would be cut, bigger the damage, steeper the angle making it difficult to hold a drink when a cup would be placed on it (the tipping point). The other methods would be the size and thickness of the slab along with heat sensitive paint, painted at the proposition of the data-set (eg. In-order to resemble 80% on the surface of the tea coaster, you’d make a design that would cover 80% of the surface.
THE PRODUCTIVE MEET UP
We manage to pick a day and organise a meetup over the first of our holidays, which was probably our most productive time together yet. We choose a data-set from our various links which was to do with bird/ bird habitat threat in Canada, America, Mexico. After drinking couple of rounds fo cider one of us suggested to use the bottles to map the data-set through creating different sounds. We quickly latched on to this idea and started blowing on the bottle banning it with a stick whilst having it filled with different levels of water. This experiment became the basis of our final ideas, the wind-chime and the flute. So for our project we wanted to use materials that were organic, naturally grown out in the nature, sustainable in abundance and related to sound due to the topic of the issue. Bamboo was the one that immediately came up, we managed to find plenty of pre-cut semi dried bamboos where we were and started making use of it. The wind-chime would be made up of two datasets, “Threats: Species at great risk of extinction” and “Habitat: Tropical residents” decay in Usa, Canada and Mexico over the course of 40 years. Our second product “The flute” which came later and was intended to be a fun project, had a global data set of ‘Global risk for bird extinction’.
Reflection
There were multiple ups and down through-out the project, highs and lows of both exciting when a new idea arose or a dull sunken feel when we had a feeling of not moving further. For me it was my first project/ assignment for this course so it was all about getting a feel for the mood of the group and understanding the people around me, how they think, how are ideas shared and how do we collaborate effectively.
Dataset links / Resources.
http://www.savingoursharedbirds.org/loss-of-abundance
https://www.theguardian.com/environment/2018/apr/23/one-in-eight-birds-is-threatened-with-extinction-global-study-finds
1 note
·
View note
Text

Elevate your company performance with Data Cleansing Service
Every organization relies on accurate and consistent data. Clean data leads to improved marketing, accurate performance analytics, and elevated company performance. We deliver quick and efficient data cleaning services, which include -Data Verification & Validation, data deduplication, Data Removal, Mailing Lists Cleansing, Data Mapping, and Data Scrubbing Services.
For more information, visit our official page https://www.linkedin.com/company/hir-infotech/ or contact us at [email protected]
#datacleansing#data#dataquality#hirinfotech#dataenrichment#datahandling#dataset#datamapping#datatransformation#datascrubbing#dataservice
1 note
·
View note
Text
Data Mapping Helps Create a Better NHS
Data Mapping Protects Patient Records
Press release February 22, 2019
Gainesville, FL., February 22, 2019 (swampstratcomm-sp19.tumblr.com)-- Recently, Healthcare Global has focused on ways to innovate healthcare. One article reviews the top healthcare innovations for 2019, discussing new technologies such as artificial intelligence and new tools for storing patient records. Another article focuses on how healthcare is becoming more digitized and a new smartphone application released by NHS. One article, Fit for Purpose: Introducing Data Mapping for a Healthier NHS, focuses on how the NHS can use data mapping to help keep patients information more secure.
The NHS has been storing patient data for over 70 years, so the amount of data held by the NHS is large. The amount of data stored by the NHS presents a large threat to the security of patient records. During 2017, the global WannaCry attack resulted in the cancellation of 20,000 appointments and a large loss in revenue. The NHS is more prone to attack by cybercriminals because they use outdated technology and operating systems. If NHS suffers another cyber attack, it is possible they would not be able to recover from the damages. Even though there is much skepticism surrounding data security people still trust the NHS with their records. This makes it important that there is a way for NHS to store data and keep it secure. One way to do this is through data mapping. “Data mapping is about creating a visual overview of all the data collected and stored by an organisation, providing an insight into the potential risks associated with each data type and location.” Data mapping does not rely on data being strictly online, so it is compatible with all NHS documents that are still kept on paper. NHS must decide how all current audio, online, and paper data must be stored. They also must implement new policies for how data is controlled and create new guidelines for who controls the data. Once the NHS takes these steps, they can begin to chart the data flow. After NHS understands the data that is being stored, they can ask a series of questions to determine how the data is being processed and collected.
Data mapping is a technology that any company can use to make sure people’s information is safe. It is especially important when it comes to people’s medical records. By streamlining how data is collected, stored, and transferred through data mapping people’s information will be safer in the long run.
Healthcare Global highlights innovation and untraditional ways of handling patient care to continually move healthcare forward.
Contact:
Kionistorm
1 note
·
View note
Text
The Importance of Privacy Assessments & Privacy Management | DataBench
Looking for a Privacy Assessment? Databench offers a range of services to help you manage your privacy. We can help you assess your current privacy practices, develop a privacy management plan, and more. Contact us today to learn more.
1 note
·
View note
Photo

Volunteer display board for Secondary School, exploring the ways in which technology has evolved to support society during the 2020 pandemic.
#technology#emerging technology#ai#data#tech#datamapping#covid#pandemic#coronavirus#graphic design#infographic#digital media#digital art#digital design#typograph#layout#information tech#product
0 notes
Link
B2B offers qualitative customized B2B Marketing data of highly refined C-Suite Contacts as per industry, verticals, geographic regions and other required criteria
#databasepositioning#dataservices#databaseservices#marketresearch#datamining#datadrivenmarketing#deepdataresearch#demandgeneration#datavalidation#datamapping#csuiteleadgeneration#b2bservices#leadgeneration#Customizedmarketresearch
0 notes
Link
B2B Sales Arrow provides Firmographics B2B database to get high quality leads which help you transform sales into business opportunities. This will help you to keep your business growth steady in the market.
#marketresearch#datamining#datadrivenmarketing#deepdataresearch#demandgeneration#datavalidation#datamapping#databasepositioning#csuiteleadgeneration#b2bservices#leadgeneration#databaseservices
0 notes