#Candlestick Pattern
Explore tagged Tumblr posts
Text
What makes the bearish harami a weak bearish reversal indicator?
A bearish harami is one of the weakest bearish trend reversal candlestick.It is due to the psychology behind it.
In simple terms, it is the bears and bull's behaviour in the market that makes the bearish harami a weak trend reversal pattern.

The above picture depicts the behaviour of bulls and bears in the market that leads to the formation of bearish harami and also makes it a weak indicator.
Click here to read the explaination about their behaviour.
#stock trader#investing stocks#stock market#future and option trading#forex trading#forex#earn money online#investor#candlestick pattern#crypto traders
12 notes
·
View notes
Text
Bearish Engulfing Candlestick Pattern: A Simple Guide
The bearish engulfing candlestick pattern is a popular signal, most traders use this to predict the potential reversals in the stock or forex market.
It’s often considered a warning that an upward trend may end and that a price drop could happen anytime soon.
Here, I’ll explain what the pattern looks like, how it works, and why it’s important.
#candlestick patterns#bearish engulfing pattern#bearish engulfing candlestick#candlestick pattern#engulfing candlestick pattern#bearish engulfing candlestick pattern#bearish engulfing#candlestick patterns for beginners#candlestick trading#bullish engulfing pattern#bullish engulfing candlestick pattern#bearish engulfing candle pattern#candlestick bearish patterns#trading candlestick patterns#candlestick chart patterns#doji candlestick pattern
0 notes
Text
In stock market, traders rely on various share market techniques and tools to make informed decision based on the movements of price. One of the important techniques in technical trading is the Candlestick Pattern. Candlestick indicates the price movement of an asset over a specified period of time. The body of each candlestick is constructed from wicks (also known as shadows) at both ends, shows the open, high, low, and close for that particular time period. In order to help technical traders make predictions about the future movements and price patterns of the underlying asset, candlestick patterns evaluate one or more candlesticks. Before utilizing more complex patterns, it’s necessary that you understand the fundamentals of candlestick charts. Our team of experienced traders can offer valuable insights into different trading techniques. By utilizing our module for Candlestick Charts for Intraday Trading, Traders Platform can provide you a competitive advantage and educate you while you trade. Enroll in our trading course, designed for both beginners and expert traders, to learn more about technical trading and stock market strategies.
0 notes
Text
#risk management#market capitalization#india#bullish reversal#market trends#chart pattern#candlestick pattern
0 notes
Text
Unraveling the Island Reversal: A Comprehensive Guide to a Pivotal Technical Analysis Pattern
Technical analysis is a powerful tool employed by traders and investors to make informed decisions in the dynamic world of financial markets. Among the myriad of chart patterns that technicians use to predict market trends, the Island Reversal stands out as a fascinating and potentially lucrative phenomenon. In this blog post, we’ll delve into the intricacies of the Island Reversal pattern,…

View On WordPress
#Bearish Reversal#Bullish Reversal#candlestick pattern#Consolidation range#Decision-making#Financial Markets#island reversal#Market Conditions#Market Sentiment#Moving Average Convergence Divergence (MACD)#moving averages#Price gap#Relative Strength Index (RSI)#Risk Management#technical analysis#Time Frame Analysis#trading signals#Trading Strategy#Trend Reversal#Volume confirmation
0 notes
Text
Unlock the Secrets of Trading with Top Chart Patterns! Explore the world of chart patterns with Funded Traders Global. From understanding the basics of technical analysis to recognizing common chart patterns like head and shoulders, double tops, and flags, our blog equips you with the knowledge to enhance your trading skills. Discover advanced patterns like pennants, wedges, and harmonic patterns, and gain practical tips for effective trading. Improve your risk management, pinpoint entry and exit points, and combine chart patterns with technical indicators. Start your journey towards trading success today with Funded Traders Global!
#Advanced Chart Pattern#and Descending Triangles#and mini trading#Ascending#Basics of Technical Analysis#Benefits of Recognizing in Chart Pattern#Bullish and Bearish Flags Pattern#candlestick#candlestick Pattern#career in forex trading#chart patterns#classic reversal pattern#common chart patterns#cup and handle pattern#Double top and double bottom patterns#drawdown#financial markets#Forex trading financial freedom#FTG#ftg prop firm#ftg trading#Funded Traders Global#Gaps#Harmonic Patterns#Head and Shoulders Pattern#how to scale into a forex trade#Macro#Master the Market with These Top Chart Patterns for Trading#mastering Forex trading#micro
0 notes
Text
10 Advanced Candlestick Patterns PDF Download
If you’re an avid trader or investor looking to sharpen your skills and gain a competitive edge, understanding and utilizing advanced candlestick patterns can be incredibly beneficial. In this article, we will explore some of the most powerful candlestick patterns that can help predict future price movements more accurately.But why should you care about candlestick patterns? Well, these…
View On WordPress
#Advanced Candlestick Patterns#Candlestick pattern#Chart pattern#FYI#IOS#Island reversal#Market sentiment#PDF#Support and resistance#Technical analysis#Three black crows#Three white soldiers#Your Arsenal
0 notes
Text
Bullish Candlestick Patterns
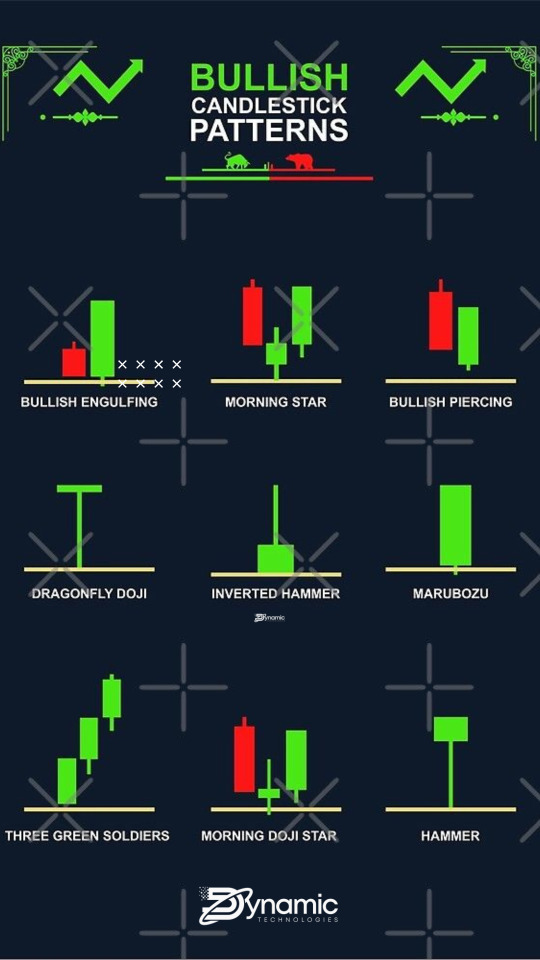
A bullish candlestick pattern is a type of chart pattern used in technical analysis that predicts an increase in stock price. This pattern is typically seen after a period of decline or consolidation and signals that the current trend is likely to reverse in an upward direction. The bullish candlestick pattern is formed when a candle’s open is lower than its close.
Bullish candlestick patterns can be used to identify buying opportunities in the stock market. These patterns can provide traders with a heads up that the market may be about to turn in their favor. Traders should look for patterns that appear in the midst of a downtrend. It is important to remember that these patterns are not always reliable and should be used in conjunction with other forms of technical analysis.
Bullish candlestick patterns typically consist of one large candle, followed by one or more smaller candle bodies. The large candle is the one that contains the buying pressure that is pushing the price higher. The smaller candles provide confirmation of the bullish trend. Some of the most common bullish candlestick patterns include the Hammer, Bullish Engulfing, Piercing Line, Morning Star, and Three White Soldiers.
Before entering into a trade based off of a bullish candlestick pattern, traders should ensure that the pattern is valid by looking at the preceding and following candles. It is also important to look for confirmation from other indicators, such as volume and momentum.
The Hammer is one of the most popular bullish candlestick patterns. It is formed when a candle has a small body at the top of the candle, followed by a much larger lower wick. The pattern is typically seen after a period of decline, indicating that buyers are beginning to enter the market.
The Bullish Engulfing pattern is another popular bullish candlestick pattern. This pattern is formed when a candle with a small body is followed by a much larger candle with a body that “engulfs” the previous candle. This pattern indicates that buyers are beginning to overwhelm sellers and that the current trend is likely to reverse.
The Piercing Line is a two-candle pattern that is formed when a long bearish candle is followed by a long bullish candle that “pierces” the midpoint of the previous candle. This pattern is typically seen after a period of decline and indicates that a reversal is likely.
The Morning Star pattern is a three-candle pattern that is formed when a long bearish candle is followed by a small-bodied candle, followed by a long bullish candle. This pattern indicates that buyers are beginning to enter the market and that the current trend is likely to reverse.
The Three White Soldiers is another three-candle pattern. This pattern is formed when three long bullish candles are seen in succession, indicating that buyers are becoming increasingly aggressive and that the current trend is likely to reverse.
Bullish candlestick patterns can be a useful tool for traders looking to capitalize on opportunities in the stock market. It is important to remember, however, that these patterns should not be used in isolation and should be used in conjunction with other forms of technical analysis. Traders should also look for confirmation from other indicators, such as volume and momentum, before entering into a trade based on a bullish candlestick pattern.
#candlestick pattern#Online Trading Platforms#Trading Software Solutions#Trading Software#Professional Trading Software
1 note
·
View note
Text

Understand the Art of Investing: The Dow Jones Candlestick Chart
Investors looking to get a leg up on the competition should make sure they understand how Dow Jones Candlestick Charts work. It's a powerful tool to help make better-informed decisions when it comes to investing. Dow Jones Candlestick Charts can be used to spot trends, gauge market sentiment and even anticipate where prices may head in the future. With the chart's visual display of data, investors are able to quickly interpret fluctuations in prices and identify buying and selling opportunities. The Dow Jones Candlestick Chart is an invaluable resource that can provide investors with the knowledge and confidence they need to make more successful investments.
0 notes
Text
Bearish Engulfing pattern can result in uptrend ! When and How?
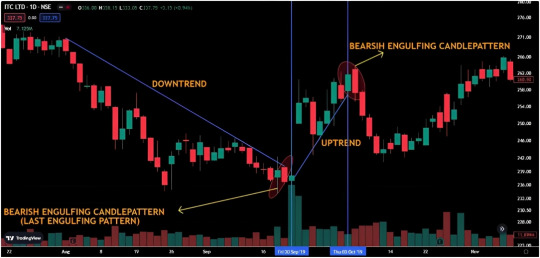
The above chart is a perfect example for a bearish engulfing pattern to act as a bullish trend reversal.This happens when bearish engulfing pattern occurs in the end of downtrend.
Click here to learn more about this in detail.
#stock trader#stock trading#candlestick pattern#crypto traders#future and option trading#forex trading#forex#earn money online#technical analysis
12 notes
·
View notes
Text
Understanding the Bullish Engulfing Candlestick Pattern
#bullish engulfing candlestick pattern#bullish engulfing pattern#bullish engulfing#bullish engulfing candlestick#candlestick pattern#candlestick patterns#engulfing candlestick pattern#bullish engulfing trading strategy#bullish engulfing candle#candlestick patterns for beginners#bullish candlestick pattern#engulfing pattern#bearish engulfing candlestick pattern#bullish engulfing candle pattern#engulfing bullish candlestick#engulfing candle strategy
0 notes
Text
Inverted Hammer Candlestick Pattern - Learn Trading Tips & Strategies Of It - By SS Trading Academy | What is Inverted hammer Candlestick Pattern? How to Identify and trade with it? and So on.
#Inverse hammer#inverted hammer#inverted hammer candle#inverted hammer candlestick pattern#inverted hammer pattern#inverted hammer vs hammer#bullish candlestick pattern#candlestick pattern#trading tips and tricks
0 notes
Text
Understanding the Inverted Hammer Candlestick Pattern: A Trader's Guide
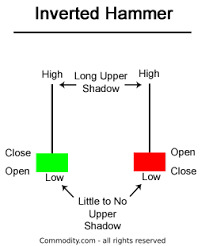
Title: Understanding the Inverted Hammer Candlestick Pattern: A Trader’s Guide Introduction: Candlestick patterns are powerful tools that traders use to analyze price movements in financial markets. One such pattern that often signals potential reversals is the inverted hammer. In this blog post, we will delve into what an inverted hammer is, how it works, and how traders can use it to make…
View On WordPress
#bullish reversal#candlestick pattern#Inverted Hammer#Risk Management#technical analysis#Trend Reversal
0 notes
Text





Spoonflower shop update! These designs are newly available to buy, as are a bunch of others, plus some new colour & scale variations... Take a look? spoonflower.com/profiles/rowanclair
#illustration#surface pattern design#victorian wallpaper#rose#candlesticks#chess#dragonfruit#snails#bees
48 notes
·
View notes
Text
The Japanese Candlestick Charting Technique
The Japanese candlestick charting technique second edition book was written by Steve Nison. He wrote the book to understand the candlestick patterns and analyze the market.
Steve Nison structures the book from basics to advanced strategies
This Second Edition book contains:
More about intraday markets
More focus on active trading for swing, and day traders
New tactics for getting maximum use from intraday charts
New Western techniques in combination with candles
A greater focus on capital preservation.
4 notes
·
View notes
Text
Bullish Marubozu: An Important Signal for Uptrend
Among candlestick patterns in market analysis, the Bullish Marubozu candlestick is a bullish indicator that is simple to understand and very effective. Unlike other candlesticks, which may show shadows or wicks, the Bullish Marubozu is unique in its simplicity—it has no shadows.
What Is the Bullish Marubozu?
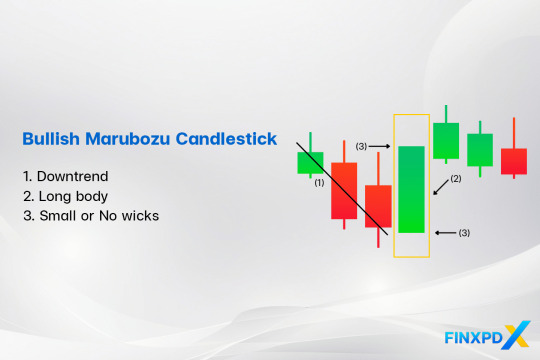
The Bullish Marubozu candlestick is a bullish candlestick pattern that shows strong buying pressure throughout the trading session. It has a long white or green body with no shadows or wicks, meaning the price opened at its lowest and closed at its highest point.
The name “White Marubozu” is another name for a Bullish Marubozu candlestick that combines its appearance and Japanese origins. “White” refers to the bullish candle color, and “Marubozu,” meaning “bald” in Japanese, describes its lack of wicks.
Characteristics of the Bullish Marubozu Candlestick
Bullish Marubozu: Features a long, solid green body with little to no wicks.
Full Bullish Marubozu: No wicks at all, showing the strongest bullish control throughout the session.
Open Bullish Marubozu: No lower wick but a small upper wick, indicating a strong upward move with slight selling pressure at the end.
Close Bullish Marubozu: A small lower wick but no upper wick, reflecting strong buying with a slightly higher open.
Read more: FinxpdX
Download PDF: 35 Powerful Candlestick Patterns
#investing#finance#investment#financial#stocks#forex#forextrading#forex market#candlestick#candlestick patterns#Marubozu#bullish#forex indicators
3 notes
·
View notes