#bullish reversal
Explore tagged Tumblr posts
Visit Tumblr Blog
Explore Tumblr blogs with no restrictions, modern design and the best experience.
Last Seen Tumblr Blogs


Fun Fact
Celebrities use Tumblr as well.
Text
Bitcoin Bullish Divergence
Bitcoin is in the process of forming a bullish reversal on Tuesday. Bitcoin broke below the day 46 low on Monday. Since the rally out of the day 46 low did not manage to turn the 10 day MA higher, breaking below the day 46 low extended to daily cycle decline. Bitcoin went on to print a lower low on Tuesday, day 57, which places bitcoin very deep and its timing band for a daily cycle low. There…
1 note
·
View note
Text
#risk management#market capitalization#india#bullish reversal#market trends#chart pattern#candlestick pattern
0 notes
Text
10 Candlestick Patterns for Effective Trading
Candlestick patterns are a powerful tool for traders to analyze price movements and predict future market behavior. Developed in Japan over 300 years ago, these patterns are widely used in modern technical analysis. This article will explore ten essential candlestick patterns that can help traders make informed decisions and enhance their trading strategies. What are Candlestick…
#Bearish Patterns#Bullish Patterns#Candlestick Patterns#Downtrend#Entry and Exit Points#Forex#Forex Traders#Forex Trading#Market Reversal#Price Movements#Risk Management#Stop-Loss#Take-Profit#Technical Analysis#Trading Psychology#Trading Strategies#Trading Strategy#Trend Direction#Trend Identification#Uptrend
1 note
·
View note
Text
Unlock the Secrets of Trading with Top Chart Patterns! Explore the world of chart patterns with Funded Traders Global. From understanding the basics of technical analysis to recognizing common chart patterns like head and shoulders, double tops, and flags, our blog equips you with the knowledge to enhance your trading skills. Discover advanced patterns like pennants, wedges, and harmonic patterns, and gain practical tips for effective trading. Improve your risk management, pinpoint entry and exit points, and combine chart patterns with technical indicators. Start your journey towards trading success today with Funded Traders Global!
#Advanced Chart Pattern#and Descending Triangles#and mini trading#Ascending#Basics of Technical Analysis#Benefits of Recognizing in Chart Pattern#Bullish and Bearish Flags Pattern#candlestick#candlestick Pattern#career in forex trading#chart patterns#classic reversal pattern#common chart patterns#cup and handle pattern#Double top and double bottom patterns#drawdown#financial markets#Forex trading financial freedom#FTG#ftg prop firm#ftg trading#Funded Traders Global#Gaps#Harmonic Patterns#Head and Shoulders Pattern#how to scale into a forex trade#Macro#Master the Market with These Top Chart Patterns for Trading#mastering Forex trading#micro
0 notes
Text

0 notes
Text
Candlestick Chart Patterns - An Essential to Earn Money Through Trading in Stock Market
Traders have been using Candlestick chart patterns for centuries to analyse price trends and predict market reversals. Developed in Japan during the 18th century, this technique gained popularity among rice traders before finding its way into modern financial markets. You might also like : Nifty 50 Prediction for Tomorrow What is a Candlestick Chart Pattern? A candlestick is a candle-like…

View On WordPress
#Bearish Candlestick Patterns#Bullish Candlestick Patterns#Candlestick Chart Patterns#Reversal Candlestick Patterns#Trading Candlestick Patterns#Types of Candlestick Patterns
0 notes
Text
How To Commerce The Inverse Head-and-shoulders Sample
With the investor loosing interest in investing in shares, the volume drops and the inventory worth starts to decline. The heart trough is the deepest and the opposite two are of roughly the same depth. An inverted Head and shoulders pattern occurs when the price of a security drops marking the bearish pattern and reaches the bottom level. Then the bullish development kicks back in and pushes the worth upwards.
In this case, the inventory's price reaches three consecutive lows, separated by momentary rallies.
This breakdown ought to be convincing, occurring on robust volume and coinciding with momentum indicators pointing towards sturdy bearish momentum.
If the value advance preceding the top and shoulders top is not long, the following worth fall after its completion may be small as nicely.
All expressions of opinion are subject to vary without discover in response to shifting market circumstances.
Some progress on the US debt ceiling talks is lifting the general market mood. The Relative Strength Index indicator turned bearish, warranting that additional downside is expected, whereas the 3-day Rate of Change , continues to slide beneath its neutral level. Futures and futures choices buying and selling includes substantial risk and isn't appropriate for all investors. Please read theRisk Disclosure Statementprior to buying and selling futures merchandise.
Figuring Out The Pinnacle And Shoulders Trading Pattern
The neckline can additionally be an essential part of the pinnacle and shoulders sample as it is the stage of resistance that merchants use in order to set up the world vary to put orders. So, to find the neckline, first, find the left shoulder, head, and proper shoulder. Then connect the low factors after the left shoulder with the low after the head, which creates the neckline.
youtube
youtube
It can be difficult for newbies to determine the altering developments.
Is Your Risk/reward Enough?
Chart patterns Understand the method to learn the charts like a professional trader. Live streams Tune into day by day live streams with expert merchants and transform your buying and selling abilities. A catalyst is something that can move traders or buyers to buy or promote a stock. That’s as a outcome of you must use this sample to discover out a significant change in development. Ascending triangle pattern need a lot of traders to see the sample, so they act accordingly and the price sample plays out.

#Chart patterns#Price action trading#Trading basics#Technical analysis#Candlestick patterns#Support and resistance#Trend lines#Breakout trading#Reversal patterns#Continuation patterns#Fibonacci retracements#Moving averages#Trading strategies#Bullish engulfing pattern#Bearish engulfing pattern#Head and shoulders pattern#Double top pattern#Triple bottom pattern#Cup and handle pattern#Ascending triangle pattern#Descending triangle pattern#Wedge pattern#Harami pattern#Doji candlestick#Morning star pattern#Evening star pattern#Trading psychology#Risk management#Entry and exit points#Backtesting strategies
0 notes
Text
Rating the recently revealed Miraculous ladybug season 6 names
601 - Climatiqueen- Sounds like Stormy weather upgrade. Hopefully no clipshow. 8/10
602 - Dessinatriste- Sounds like a depressed athlete. 5/10
603 - Sublimation- Rooster episode maybe? 3/10
604 - Daddycop- Either Roger cop 2, or a kink 5/10
605 -Papys Garous- Racist grandpa part 3 6/10
606 - Princesse Syren- Sounds Disney. 7/10
607 - El Toro De Piedra: I’m bullish on this one 8/10
608 - Vampigami- If Kagami doesn’t become a vampire we riot 10/10
609 - Monsieur Agreste- This better be Gabriel getting revealed as a monster and dying 5/10
610 - Le Château Noir Chat noir house party 8/10
611 - Revelator - Doofinshmirtz named this episode 6/10
612 - Psyconductrice- Idk a psychic chicken. 2/10
613 - Yaksi Gozen- Yakuza Mom! 10/10
614 - Couchorak - Sounds like a Rabbid couch 3/10
615 - La Redresseuse. Sounds fancy. 6/10
616 - Noe- No. 1/10
617 - La Fée De Beaux Rêves. Sounds like a Lila identity 4/10
618 - Les Crassetastrophes- I can smell the pun 8/10
619 - Riginarazione- sounds like an Italian chuck-e cheese. 3/10
620 - Renverse-cœurs- Reverse course? A bit lazy. 2/10
621 - Les Titans Chaînes- This sounds dope. 9/10
622 - Lady Chaos- THIS I LIKE 10/10
623 - Tristanansi- A sad spider? 4/10
624 - La Reine De Frayeurville- something about ruling and I’m bored 3/10
625 - Protocole Secret: Secret mission. 7/10
626 - Nemesis- a bit simple but neat. 6/10
111 notes
·
View notes
Text
Three Effective Trading Strategies Using M and W Patterns
Let us have look at how we use the M and W patterns (also referred to as Double Top & Double Bottom Patterns) in trading. Here are some Trading Strategies. 1. Double Top (M Pattern) Strategy Description: The Double Top, or M pattern, is a bearish reversal pattern that forms after an uptrend. It consists of two peaks at roughly the same level, with a trough in between. This pattern indicates…
#Bearish Reversal#Bullish Reversal#cryptocurrency trading#Double Bottom Strategy#Double Top Strategy#forex trading#learn technical analysis#M Patterns#MACD Divergence#Neckline Break#Risk Management#RSI divergence#stock trading#technical analysis#Trading Indicators#Trading Patterns#trading signals#Trading Strategies#Volatile Market Trading#Volume confirmation#W Patterns
1 note
·
View note
Text
Stocks Form Bullish Reversal
Stocks formed a bullish reversal on Tuesday. Tuesday was day 29, placing stocks in the early part of their timing band for a daily cycle low. Tuesday’s bullish reversal eases the parameters for forming a swing low. A break above 5992.65 will form a swing low. Then a close above the 50 day MA will signal the new daily cycle. We will use a close above the 10 day MA to label day 29 as the DCL.
0 notes
Text
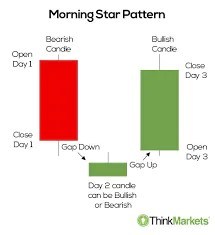
Mastering the Morning Star Pattern: A Step-by-Step Guide
Title: Mastering the Morning Star Pattern: A Step-by-Step Guide Introduction:The world of technical analysis offers traders a plethora of tools to identify potential trend reversals and market opportunities. One such powerful pattern is the Morning Star pattern, a three-candlestick formation that signals a potential bullish reversal after a downtrend. In this step-by-step guide, we will explore…
View On WordPress
#bullish reversal#candlestick patterns#comprehensive trading approach.#confirmation factors#doji candle#downtrend#false signals#market sentiment#momentum shift#Morning Star pattern#position sizing#price action#resistance levels#Risk Management#spinning top#stop-loss#support levels#technical analysis#trading strategy#trading volume#Trend Reversal#volume analysis
0 notes
Note
So when I see things like that EA guy's substack article about how AI energy use is fine and nobody should worry about it, and then I see another article about how coal use is ramping back up to meet AI demands for energy, and both are providing their statistics in the form of hard-to-parse visualizations ... this isn't really a question so much as complaint that someone has to be lying here, and I wish I knew who. It seems like it has to be the AI people, as they have the incentive, but ...
So I have a few of reactions to this.
It would be easier to debate the relative merits of two articles if you had linked me the other one, or at least given me some indication about what its title was, who it was by, and where to find it. Since you didn't, all we have is the bare claim that "coal use is ramping back up to meet AI demands for energy." Coal use for the United States as a whole has been steadily falling from 2007-2023 (the most recent year for which I can find data), and aside from small increases in 2010, 2013, and 2021 relative to the previous year, this decline has been almost completely monotonic.
Perhaps you mean this Register article, about how the lifetime of some coal powers plants is being extended because of data center power requirements? But that's not the claim you made. These are very different claims. "Coal use is declining more slowly" vs "coal use is increasing" no doubt sounds to some people like a small quibble, but I think it's really important, because this kind of sloppy equivocation between two substantively very distinct claims entails very distinct substantive consequences! The amount of power data centers have to consume to cause a coal power plant in one city to remain open longer than originally planned while other capacity is built vs the amount of power data centers have to consume to cause consumption of a resource whose usage has been falling steadily for sixteen years to reverse the trend of decline is a considerable difference. In short, if you saw the Register headline, and turned it into the claim presented in your anon ask, you are a liar misrepresenting the state of the world maliciously. If you simply heard the claim you present in your ask as-is, and repeated it, you were lied to.
If your response to the distinction between these two claims is "ah, what's the difference," and you continue to repeat the claim as you presented it in the anon ask, you are also a liar, and we can conclude that the reason you are confused about which claim is true is that you do not care to differentiate between true and false things. Someone like that would stumble through the world in a fog of confusion, not because the truth is hard (it sometimes is), but because they are uninterested in it.
The article I linked I found interesting because it provided very specific numbers, of the form you could check yourself if you doubted them. Again, you don't tell me which article you read that you felt provided a countervailing claim, is pretty light on numbers and pretty speculative on how future energy trends due to use of AI might look. Notably, a lot of claims about the future power needs of AI seem to be coming from companies promoting AI, and who therefore are publicly bullish about its widespread adoption, since they want to justify their investments in the technology to investors.
Andy Masley does not in any sense seem to be "an AI person"? He doesn't work for Google or Meta or OpenAI, or seem to have special background in this technology. My read of your ask seems to be that you think he has incentive to lie about the power consumption of AI technology, even though (again) he seems to provide a lot of numbers you could check yourself if you were so inclined.
You seem also to think that people who are opposed to the development of AI technology have no reason to misrepresent how costly the energy consumption of AI is. That is silly. People taken in by false claims have a strong incentive not to admit they were taken in by false claims! This might not be lying in the classical sense of "knowingly repeating something that is untrue," but I would not say that people who reflexively cleave to false claims because it would be embarrassing to admit they were wrong are being honest. Indeed, I think a huge amount of the misinformation that gets spread online and in-person is spread by people who are at best apathetic to the truth of the claims they are making, and who are more interested in winning individual arguments on a rhetorical basis.
If someone genuinely labors under confusion as to which of two sets of competing claims is correct, you can of course do the admittedly effortful task of trying to learn more, to see if you can achieve a little clarity on the subject. You don't have to look at two different articles, see that they seem to point in two different directions when it comes to a general conclusion about an issue ("Is AI very bad for the environment?") and throw your hands up helplessly and go "there is no way to know the truth here." I believe in you, anon.
That said, I don't think either the Register article nor the Masley article do point in two different directions. "People wildly exaggerate the energy and water consumption of AI" and "building or expanding a data center changes the local energy economy of a city, especially a smallish one like Omaha" are not even contradictory claims.
Unless, of course, you are not interested in building an accurate model of the world through acquiring information about it, but only in slotting each article you click on or social media post you read into one side or another in a rhetorical struggle, because you view everything through the lens of whether it will help you dunk on someone in an argument later. But those people are really annoying, so please don't be one of them.
#fudging a claim into a superficially similar but functionally substantially stronger version#is a very popular form of lying on the internet#as is taking one example and claiming it is demonstrative of a pattern#and both tend to pass by uncritically as claims when people are sympathetic to the thrust of the argument#but i wish people would call that sort of thing out more when they see it#because it *is* lying!#sometimes two superficially similar claims entail wildly different consequences!#and it matters a lot whether something has happened in the world one time#three times#or one thousand times
44 notes
·
View notes
Text
What to expect from the stock market this week

Last week, the review of the macro market indicators saw with October in the books and heading into the election and FOMC meeting, equity markets experienced a Halloween spooking. Elsewhere looked for Gold ($GLD) to continue its uptrend while Crude Oil ($USO) consolidated at the bottom of a broad range. The US Dollar Index ($DXY) looked to consolidate in its uptrend while US Treasuries ($TLT) pulled back in their consolidation. The Shanghai Composite ($ASHR) looked to continue the short term move higher while Emerging Markets ($EEM) pulled back in their uptrend.
The Volatility Index ($VXX) looked to remain at a neutral level, above the base established this year, and was likely to stay there at least until after the election. This might make for choppy light trading for equity markets to start next week. Their charts looked strong on the longer timeframe though. On the shorter timeframe both the $QQQ and $SPY had reset momentum measures lower and could reverse or turn bearish, likely a couple of days’ time would tell. The $IWM did not seem concerned about an election or Fed policy, churning sideways.
The week saw major movements happen following the election. It played out with Gold pulling back from its high Wednesday before a partial recovery while Crude Oil found some strength and moved higher in a choppy range. The US Dollar jumped to a 4 month high while Treasuries fell back to a 5½ month low Wednesday before a recovery. The Shanghai Composite continued the move to the upside while Emerging Markets chopped in a wide range.
Volatility crashed down to the low end of the range since August. This put a stiff breeze at the backs of equities and they started to move up Tuesday and then accelerated Wednesday through the end of the week. This resulted in the SPY and QQQ printing a new all-time highs Wednesday, Thursday and Friday and the IWM gapping up to a 1 year high. What does this mean for the coming week? Let’s look at some charts.

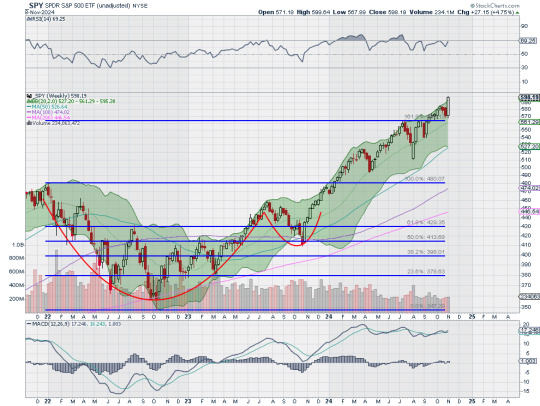
The SPY came into the week at the 50 day SMA on the daily chart in a pullback from the top. It had a gap left open from the end of the week. It held there on Monday and then started higher Tuesday, into the gap. It gapped up Wednesday to finish at a new all-time high and leaving an island below. It followed that up with new all-time highs Thursday and Friday. The Bollinger Bands® are open to the upside. The RSI is rising deep in the bullish zone with the MACD positive and rising.
The weekly chart shows a strong, long bullish candle rising from the 161.8% extension of the retracement of the 2022 drop. The 200% extension is now within view at 614 above. The RSI is rising near overbought territory in the bullish zone with the MACD drifting up and positive. There is no resistance above 599.60. Support lower sits at 585 and 580 then 574.50 and 571.50 before 565.50 and 556.50. Uptrend.
With the Presidential Election and November FOMC meeting in the rearview mirror, equity markets showed jubilation as they vaulted higher. Elsewhere look for Gold to in its uptrend while Crude Oil consolidates in a broad range. The US Dollar Index continues to move to the upside while US Treasuries consolidate in their pullback. The Shanghai Composite looks to continue the move higher while Emerging Markets chop in their short term uptrend.
The Volatility Index looks to remain low and drifting lower following the election making it easier for equity markets to continue higher. Their charts look strong on both timeframes, especially the SPY and QQQ. The IWM has now joined the party, a stone’s throw away from making its first new all-time high in 2 years. Use this information as you prepare for the coming week and trad’em well.
Join the Premium Users and you can view the Full Version with 20 detailed charts and analysis: Macro Week in Review/Preview November 8, 2024
44 notes
·
View notes
Text
Hatton Garden - Wikipedia
I AM TRAPPED IN LONDON DIAMOND DISTRICT!
START SUPPLYING!
Meturnomics: Periodic Table Element Manufacturing, Covalent Bonds Fertilizer with Soil Chemistry Ex. Carbon Compounds, Covalent Bonds Fertilizer with Soil Chemistry, Chandelier Tree for Bontonical Indicator; Diamond Vowels: A (Accessories Auctions), E (Exchange Probabilistic Model), I (Sensual Insurance), O (Open-pit Mines), U (Unanimous Laser Cutters and Laser Pressure); Metal Exchange Probabilistic Model for Derivatives CFDS;
AgCurrency: Economic Table, Barter Economics, NIRP Supply-side Fixed Rate Pegged De Facto; AgIndex: Commodities Portfolio Management; Agronomics CFDS//Option Exchange (Credit Spread Options, FX-CFD Interest Rates Beta-Arbitrage w/PPP and Supply-side Economics Currency Pair)
Authentic Movement STERRC (SMUGGLING, TRAFFICKING, EMBEZZLEMENT, RHIZOMES, AND RUGGED & REFINED CULTIVATOR)
Of Undisputed Origin.
Periodic Table Metallurgy Cultivator with Artisanal Primitive Anthropology, Nationalist, Art Intellect with Athletic Ability, Riverbanks Farmland, Real Estate Investment Trust and Real Estate Brokerage Trust Account, Pool-Live Monopoly Turf Accountant Board Game Tournament, Rugby and Kickboxing, Eagle Conservation, Painting and Polyrhythm Syncopated Progressive Drum Loops with Rhythm Flag (Anacrusis; Staccato and Legato; Barcarolle; Tonic and Dominant; Triple G Positions), and (Diamond; Decapods; Mollusk; Opium; Deliriants; Tobacco; Coffee; and Arms) Black Market
Kimberley Certificate
Open-pit Mines Economic Geography
Banking System and Probabilistic Model Exchange
Intermodal Cargo Countyline Trafficking Infrastructure
De facto SLL/SDM FX Counter Trading Party for Diamond CFD; SLL 5% AND SDM -0.5% Interest Rates Contract for Difference.
CURRENCY, OIL, & GOLD COMMODITIES CANDLESTICK CHARTS
Swing Trading: Use mt4/mt5 With Heiken Ashi Charts, Setting at 14 or 21 Momentum Indicator above 0 as Divergence Oscillator and Volume Spread Analysis as Reversal Oscillator and Trade when bullish candlesticks above 200 exponential moving average and/or 20 exponential moving average (EMA) on H1 (Hourly) Time Frame; use H4 (4 Hours) and D1 (1 Day) as reference.
(Artisanal Primitive King) Pedagogy: King Anthropology; Mixing a form of Royalty Title with Anthropology. CRAFT SOCIETY Sensory Processing Anthropology Artisan Primitive: Sensory Play of the Sensory Ethnography, Sensory Modulits CNS; Artisanal Plantation Metallurgy Cash Crops Spectrum; Evolution; Savagery, Emerging Markets, Civilianization, ECONOMICS OF FINANCIAL MARKETS; Economic Science (Supply-side Economics), Economic Geography (Artisanal Plantation), Economic Mathematics (CFD Probabilistic Model Exchange), Microeconomics (Contract Theory, Purchasing Theory, Portfolio Theory, Producer Price Index, Profit Sharing Plan, Lipstick Effect, Opportunity Cost, Private Limited Partnership, Public-Private Sectors, Pyramid Marketing, Minor Purchase Group) for Sensory Geography (5 Senses City); Prenatal Hormones with Fetus Alcohol Consumption for Sensory Overload Savant;
Athletic Spirit of Rugby: Rugby union football, commonly known simply as rugby union in English-speaking countries and rugby 15/XV in non-Anglophone Europe, or often just rugby, is a close-contact team sport that originated at Rugby School in England in the first half of the 19th century. Rugby is based on running with the ball in hand. In its most common form, a game is played between two teams of 15 players each, using an oval-shaped ball on a rectangular field called a pitch. The field has H-shaped goalposts at both ends. The SVNS,[1][2] known as the for sponsorship reasons, is an annual series of international rugby sevens tournaments run by World Rugby featuring national sevens teams. Organised for the first time in the 1999–2000 season as the IRB World Sevens Series,[3] the competition was formed to promote an elite-level of international rugby sevens and develop the game into a viable commercial product. A fly-half (number 10) is usually the first player to receive the ball from the scrum-half following a breakdown, line-out or scrum. Therefore, they must be decisive with what actions to take. They must possess leadership and communicate effectively with the back line.[58] Good fly-halves are calm, clear thinking and have the vision to direct effective attacking plays.[59] Fly-halves need good passing and kicking skills. Often the fly-half is the best kicker in the team and needs to be able to execute attacking kicks such as up-and-unders, grubbers and chip kicks as well as being able to kick for territory.[58] Many fly-halves are also the team's goal kickers.
Clive Myr. Obasi
🏴🏴🏴🏴🏴🏴🏴🏴🏴🏴🏴🏴🏴🏴🏴🏴🏴🏴🇸🇱🇸🇱🇸🇱🇸🇱🇸🇱🇸🇱🇸🇱🇸🇱🇸🇱🇸🇱🇸🇱🇸🇱🇸🇱🇸🇱🇸🇱🇸🇱🇸🇱🇸🇱
8 notes
·
View notes
Text
Open Field Election Year Pattern Rears Its Head

Looks like we’re getting that mean reversion correction we’ve been talking about. Election years have historically been bullish with above average performance in June, July, and August. But, over the past few months, we’ve warned that the market has gotten well ahead of itself and ahead of all the average election year patterns.
After the usual midyear NASDAQ rally tech stocks have been prone to mid-July selloffs. And “Hot July” markets for DJIA have notoriously preceded market declines. Now August appears to be ditching its election year bullishness for its usual seasonal weakness.
All this on the backdrop of President Biden bowing out 2 weeks ago, a more heightened geopolitical arena, some awful earnings and a weak jobs report have cranked up recession fears and market volatility. This is the volatility we warned of. Expect it to continue for the next few months.
While the market is likely overreacting, this sort of pullback is overdue and likely not over. August-October seasonal weakness is clearly in play and the action over the past two weeks brings our Open Field Election Year Pattern back in play as well. This does not necessarily mean we are heading into the red for the year, but it does suggest the market is likely to struggle over the next few months with a correction low in late October just ahead of the election.
13 notes
·
View notes
Text
Shifting Averages
Price crossovers can be combined to trade within the larger trend. The longer moving common sets the tone for the bigger trend and the shorter shifting common is used to generate the indicators. One would search for bullish value crosses only when prices are already above the longer shifting common. For Breakout trading , if value is above the 200-day transferring common, chartists would only give attention to alerts when worth strikes above the 50-day shifting average. The calculation is extra advanced, as it applies more weighting to the latest prices. A shifting average is commonly used with time collection data to clean out short-term fluctuations and highlight longer-term developments or cycles. The threshold between short-term and long-term depends on the applying, and the parameters of the moving common will be set accordingly. It can be utilized in economics to look at gross domestic product, employment or other macroeconomic time series. Mathematically, a shifting common is a type of convolution and so it may be seen for example of a low-pass filter used in signal processing. When used with non-time sequence knowledge, a shifting common filters greater frequency elements with none particular connection to time, although usually some sort of ordering is implied.
A bullish cross occurs when the 5-day EMA moves above the 35-day EMA on above-average quantity.
One attribute of the SMA is that if the data has a periodic fluctuation, then applying an SMA of that interval will get rid of that variation .
Flash is an advanced trading algorithm that combines three powerful indicators to...
In basic, a transfer towards the higher band suggests the asset is turning into overbought, while a transfer near the lower band suggests the asset is becoming oversold.
With IG, you'll be able to entry transferring averages on our charts, as properly as different technical tools like Bollinger bands and RSI.
A shifting common simplifies worth data by smoothing it out and creating one flowing line. Exponential transferring averages react quicker to cost changes than simple transferring averages. In some cases, this can be good, and in others, it could trigger false alerts. Moving averages with a shorter look-back period will also respond quicker to cost modifications than a mean with a longer look-back period . The 50-day simple moving average, which is certainly one of three main transferring averages, is broadly utilized by traders and analysts to determine support and resistance levels for a range of securities.
Palantir Technologies Inc (pltr) Just Flashed Golden Cross Sign: Do You Buy?
To create a moving common, each day we’ll drop the last day in the time-frame and add today’s. When a brief interval SMA crosses above a long interval SMA, you might need to go lengthy. You may wish to go brief when the short-term SMA crosses again beneath the long-term SMA. When costs cross above the SMA, you may want to go long or cowl short; once they cross below the SMA, you might want to go brief or exit lengthy.
youtube
If the traces are running in parallel, this means a robust development. If the ribbon is expanding , this means the development is coming to an finish. If the ribbon is contracting , this will indicate the beginning of a model new trend. Another choice which boils down to the trader’s preference is which kind of Moving Average to make use of. While all of the various varieties of Moving Averages are rather comparable, they do have some variations that the dealer should pay consideration to. For example, the EMA has a lot much less lag than the SMA and subsequently turns faster than the SMA.
What Does A Shifting Common Chart Inform You?
Average Vs Weighted AverageIn Excel, the words common and weighted average are totally different. A weighted average, on the opposite hand, is a mean calculated in the same means but with a weight multiplied with each knowledge set. Since it isn't a one-size-fits-all phenomenon, completely different gamers out there use totally different versions of it for various purposes. Some use transferring common trading strategy, some simply want to perceive the trend of the market, and a few analysts use to hold out a detailed evaluation.
By default, 20 periods are used to calculate the Simple Moving Average. However, since P&F transferring averages are double smoothed, a shorter moving common may be most popular when inserting this overlay on a P&F chart. If you're taking the two Moving Averages setup that was discussed within the earlier section and add in the third element of worth, there is one other kind of setup known as a Price Crossover. With a Price Crossover you start with two Moving Averages of various term lengths .
youtube
This indicator not solely tracks the EMA and ATR but also plots these levels as help and resistance traces,... The only distinction here is that it makes use of solely closing numbers, whether inventory prices or balances of accounts and so on. So, the first step is to collect the information of the closing numbers after which divide that number by the period in question, which could probably be from day 1 to day 30, etc.
#Chart patterns#Price action trading#Trading basics#Technical analysis#Candlestick patterns#Support and resistance#Trend lines#Breakout trading#Reversal patterns#Continuation patterns#Fibonacci retracements#Moving averages#Trading strategies#Bullish engulfing pattern#Bearish engulfing pattern#Head and shoulders pattern#Double top pattern#Triple bottom pattern#Cup and handle pattern#Ascending triangle pattern#Descending triangle pattern#Wedge pattern#Harami pattern#Doji candlestick#Morning star pattern#Evening star pattern#Trading psychology#Risk management#Entry and exit points#Backtesting strategies
1 note
·
View note