#Uptrend
Explore tagged Tumblr posts
Visit Tumblr Blog
Explore Tumblr blogs with no restrictions, modern design and the best experience.
Last Seen Tumblr Blogs


Fun Fact
Post activity is at the highest at 4:00 pm EDT; notes peak at 10:00 pm EDT.
Text
Stocks Rejected
Stocks got rejected on Friday. After getting DeepSeek-ed on Monday, stocks managed to crawl up the 10 day MA into Friday. But ran into resistance at the 6100 level on Friday. Stocks are currently in a daily uptrend. A bullish break out above the 6100 resistance level will indicate a continuation of its daily uptrend and signal a cycle band buy signal. However, looking at the chart– there are…
3 notes
·
View notes
Text
These are the 3 main types of liquidity that can be found in the market. They appear on every time frame and if we are able to identify where liquidity is resting , we will understand where price is going.
For more join us:-
#forex#forex education#forex expert advisor#forexmentor#forex broker#forex indicators#forex market#forexsignals#forexmastery#crypto#cryptomarket#cryptocurrency#blockchain#altcoin#bitcoin#global market#market analysis#uptrend#money management#make money online#earn money online
1 note
·
View note
Text
10 Candlestick Patterns for Effective Trading
Candlestick patterns are a powerful tool for traders to analyze price movements and predict future market behavior. Developed in Japan over 300 years ago, these patterns are widely used in modern technical analysis. This article will explore ten essential candlestick patterns that can help traders make informed decisions and enhance their trading strategies. What are Candlestick…
#Bearish Patterns#Bullish Patterns#Candlestick Patterns#Downtrend#Entry and Exit Points#Forex#Forex Traders#Forex Trading#Market Reversal#Price Movements#Risk Management#Stop-Loss#Take-Profit#Technical Analysis#Trading Psychology#Trading Strategies#Trading Strategy#Trend Direction#Trend Identification#Uptrend
1 note
·
View note
Video
youtube
🚀 Long EMA trading strategy EMA + Signals 10 SEC 🔍
0 notes
Text
Unexpected Twist: Ripple's Revelation as Federal Contractor Spurs Downturn in XRP Price
In a surprising twist, Ripple, a prominent player in the cryptocurrency space, has unveiled its status as a federal contractor in a recent job opening. This unexpected revelation has sparked questions and speculation within the crypto community, potentially signaling a shift in Ripple's regulatory dynamics. Against the backdrop of ongoing legal battles with the Securities and Exchange Commission (SEC), this newfound affiliation adds complexity to Ripple's narrative and raises pertinent questions about its evolving relationships with governmental entities.
XRP Market Performance and Regulatory Uncertainties:
As XRP, the sixth-largest cryptocurrency, faces a current trading price of $0.5757, questions arise about its short-term performance. Despite a 0.70% increase over the past seven days, there's a notable 9.95% decrease in the 24-hour trading volume, suggesting a shifting market sentiment. The revelation of Ripple's federal contractor status adds an extra layer of uncertainty, prompting investors to closely monitor key metrics and indicators for potential shifts in market dynamics.
Legal Battles and Global CBDC Collaborations:
Ripple's prolonged legal struggles, particularly with the SEC, have been a focal point, providing insights into the regulatory landscape for cryptocurrencies. Recent reports indicate an expansion of Ripple's collaboration with over a dozen governments worldwide, contributing to the development of Central Bank Digital Currencies (CBDCs). While Ripple's Europe head emphasizes global collaboration for CBDCs, the disclosure as a federal contractor raises questions about the company's intricate relationships with regulatory bodies, adding further complexity to its narrative.
XRP Price Analysis and Technical Indicators:
Turning to XRP's price analysis, the cryptocurrency faces a downturn, invalidating a recent uptrend. The 4-hour chart reveals a micro-uptrend, with XRP attempting to breach a crucial resistance level at $0.5847, unbreached for the last 14 days. Technical indicators, including the Relative Strength Index (RSI) and Moving Average Convergence Divergence (MACD), exhibit slight bearish signals. A potential dip to $0.560 is anticipated if this sentiment persists. However, bullish cues from the broader market may influence XRP's recovery, potentially propelling it beyond $0.600.
Conclusion:
In the midst of regulatory revelations and market uncertainties, Ripple's disclosure as a federal contractor adds a new dimension to its narrative. As XRP navigates this period of complexity, influenced by both regulatory dynamics and market trends, investors are advised to remain vigilant, closely monitoring technical indicators and developments to make informed decisions in this evolving landscape.
#Ripple#XRP#federal contractor#subcontractor#regulatory dynamics#SEC#legal battles#XRP price#resistance level#technical analysis#market dynamics#price analysis#RSI#MACD#uptrend#Cryptotale
0 notes
Text
Bitcoin Hits Highest Weekly Close of 2023, Signaling Positive Uptrend
In a highly anticipated move, Bitcoin (BTC) has achieved a remarkable feat, recording the highest weekly close of 2023. This milestone holds great significance for both market insiders and savvy investors, signaling a positive change in the cryptocurrency landscape. By forming a "higher high" on its weekly chart, Bitcoin has indicated a clear uptrend, breaking free from a rangebound trading pattern.
1. The Significance of a Higher High

A "higher high" on a chart is a classic pattern of technical analysis that indicates an uptrend. For Bitcoin, this achievement on the weekly chart is the first of its kind in 2023, representing a pivotal turning point. It brings about a shift in the prevailing narrative, offering encouragement to market participants and laying the foundation for a potential uptrend continuation.
2. Implications of the Milestone
This new development carries several implications that can shape the cryptocurrency market's future trajectory. 2.1 Stimulating Fresh Liquidity and Investment Inflows Bitcoin's higher high acts as a vital bullish signal capable of stimulating fresh liquidity and attracting new investment inflows. Technical traders and investors, always vigilant for signs of potential breakouts and trend reversals, are likely to interpret this positively. The achievement of a higher high encourages them to consider initiating or increasing their Bitcoin positions, thereby generating additional demand. 2.2 Changing Market Sentiment Achieving a higher high on the weekly chart also impacts broader market sentiment. Bitcoin's resilience and robustness amidst the uncertainties prevailing in the cryptocurrency landscape become apparent. This demonstration of strength from the leading digital asset has the potential to boost the morale of the entire market, creating a ripple effect across various cryptocurrencies.
3. Exercising Caution Amidst Market Volatility
While the recent milestone signifies a positive shift, it is important to approach the market with caution and avoid unnecessary risks. History has shown us that significant price movements can quickly change direction, highlighting the need for prudent decision-making. Evaluating risk factors and implementing proper risk management strategies is crucial to safeguarding investments.
Conclusion
Bitcoin's achievement of the highest weekly close in 2023 marks a significant turning point in the cryptocurrency market. The "higher high" on its weekly chart indicates a clear uptrend, contributing to increased liquidity and investor confidence. However, caution remains essential, as market volatility can alter the landscape swiftly. By staying informed, evaluating risks, and exercising prudent decision-making, market participants can navigate the ever-changing cryptocurrency market effectively. For more articles visit: Cryptotechnews24 Source: u.today
Latest Posts
Read the full article
#Bitcoin#caution#CryptoNews#higherhigh#highestweeklyclose#investmentinflows#liquidity#marketsentiment#marketvolatility#milestone#technicalanalysis#uptrend
0 notes
Text
Basic technical analysis for trading.

👩🎓 🧑🎓 "Technical analysis" is a method of studying stock behavior by analyzing charts to forecast future price trends. Technical analysts examine stock behavior based on price and trading volume (or trading value), considering them as important sources of information for technical analysis.
💥However, the strategies used in technical analysis are not formulated without principles. In fact, they are based on three concepts or beliefs:
1. Price Behavior Reflects All Information: According to this concept, the price of a stock reflects all relevant information. Economic, political, and other changes that impact supply and demand in the stock market will affect the price. Since the price is determined by the interaction of supply and demand, positive changes lead to increased demand surpassing supply (greater buying pressure than selling pressure), resulting in price increases. Conversely, negative changes lead to increased supply surpassing demand (greater selling pressure than buying pressure), leading to price declines.
👩🎓 🧑🎓 However, technical analysts primarily focus on price and volume data for analysis. This approach narrows the scope of study compared to fundamental analysis, which delves into the causes behind price changes. While analyzing fundamentals, the driving forces behind changes in supply and demand are thoroughly examined. Both approaches aim to solve the problem of determining the direction of stock prices, although they differ in their analytical models.
0 notes
Text
Stocks Crossed The Line
Stocks closed above the 50 day MA on Monday. We discussed on Saturday that close above the 50 day MA will shift the odds that stocks are in a new intermediate cycle. Stocks also closed above the upper daily cycle band. Closing above the upper daily cycle band ends the daily downtrend and begins a daily uptrend. Closing above the upper daily cycle band also signals that the ICL has been set. —…

View On WordPress
2 notes
·
View notes
Text
Ringgit extends uptrend now against greenback in early trade
The Malaysian ringgit strengthened slightly against the US dollar on Friday, trading at 4.4600/4700 compared to 4.4610/4650 on Thursday. This follows robust US labor market data, which supports a measured monetary policy easing by the Federal Reserve, and pressure on the European Central Bank for rate cuts. The ringgit also gained against major currencies like the British pound and euro but…
0 notes
Text
Relative Vigor Index Explained
The Relative Vigor Index (RVI) is a momentum oscillator used in technical analysis to measure the strength of a trend. Developed by John Ehlers, the RVI is based on the concept that prices tend to close higher than they open in an uptrend and lower than they open in a downtrend. This article will delve into the RVI, explaining its calculation, interpretation, and how it can be effectively used in…
#Crossovers#Divergence#Downtrend#Entry and Exit Points#EUR/USD#Forex#Forex Traders#Forex Trading#MACD#Market Trends#Moving Average#Moving Average Convergence Divergence#Price Movements#Relative Strength#Risk Management#RSI#Signal Line#Stop-Loss#Technical Analysis#Trading Signals#Trading Strategies#Trend Direction#Uptrend#USD/JPY#Volatility
0 notes
Text
Uptrend Ecom: Your Path to E-commerce Success
Dive into the future of investing with Uptrend Ecom! Explore a groundbreaking platform by RSG Solution LLC that’s revolutionizing the e-commerce market. Enjoy effortless investment through full automation, expert management, and dedicated support.

Ride the wave of explosive e-commerce growth without the hassle. With Uptrend Ecom’s money-back guarantee, it’s a risk-free opportunity to tap into virtual marketplaces like Etsy. Unleash the potential of online shopping in your investment portfolio.
Don’t miss out on this seamless, convenient, and secure investment experience. Learn more now and embrace the future of wealth-building with Uptrend Ecom!
Also Read: Biden's Student Loan Forgiveness Revolution: Dive into the SAVE Plan
0 notes
Text
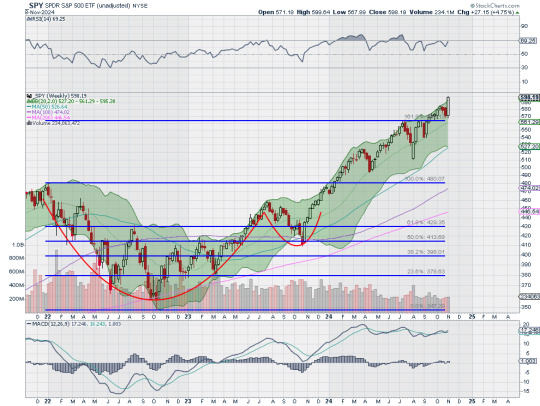
What to expect from the stock market this week

Last week, the review of the macro market indicators saw with October in the books and heading into the election and FOMC meeting, equity markets experienced a Halloween spooking. Elsewhere looked for Gold ($GLD) to continue its uptrend while Crude Oil ($USO) consolidated at the bottom of a broad range. The US Dollar Index ($DXY) looked to consolidate in its uptrend while US Treasuries ($TLT) pulled back in their consolidation. The Shanghai Composite ($ASHR) looked to continue the short term move higher while Emerging Markets ($EEM) pulled back in their uptrend.
The Volatility Index ($VXX) looked to remain at a neutral level, above the base established this year, and was likely to stay there at least until after the election. This might make for choppy light trading for equity markets to start next week. Their charts looked strong on the longer timeframe though. On the shorter timeframe both the $QQQ and $SPY had reset momentum measures lower and could reverse or turn bearish, likely a couple of days’ time would tell. The $IWM did not seem concerned about an election or Fed policy, churning sideways.
The week saw major movements happen following the election. It played out with Gold pulling back from its high Wednesday before a partial recovery while Crude Oil found some strength and moved higher in a choppy range. The US Dollar jumped to a 4 month high while Treasuries fell back to a 5½ month low Wednesday before a recovery. The Shanghai Composite continued the move to the upside while Emerging Markets chopped in a wide range.
Volatility crashed down to the low end of the range since August. This put a stiff breeze at the backs of equities and they started to move up Tuesday and then accelerated Wednesday through the end of the week. This resulted in the SPY and QQQ printing a new all-time highs Wednesday, Thursday and Friday and the IWM gapping up to a 1 year high. What does this mean for the coming week? Let’s look at some charts.

The SPY came into the week at the 50 day SMA on the daily chart in a pullback from the top. It had a gap left open from the end of the week. It held there on Monday and then started higher Tuesday, into the gap. It gapped up Wednesday to finish at a new all-time high and leaving an island below. It followed that up with new all-time highs Thursday and Friday. The Bollinger Bands® are open to the upside. The RSI is rising deep in the bullish zone with the MACD positive and rising.
The weekly chart shows a strong, long bullish candle rising from the 161.8% extension of the retracement of the 2022 drop. The 200% extension is now within view at 614 above. The RSI is rising near overbought territory in the bullish zone with the MACD drifting up and positive. There is no resistance above 599.60. Support lower sits at 585 and 580 then 574.50 and 571.50 before 565.50 and 556.50. Uptrend.
With the Presidential Election and November FOMC meeting in the rearview mirror, equity markets showed jubilation as they vaulted higher. Elsewhere look for Gold to in its uptrend while Crude Oil consolidates in a broad range. The US Dollar Index continues to move to the upside while US Treasuries consolidate in their pullback. The Shanghai Composite looks to continue the move higher while Emerging Markets chop in their short term uptrend.
The Volatility Index looks to remain low and drifting lower following the election making it easier for equity markets to continue higher. Their charts look strong on both timeframes, especially the SPY and QQQ. The IWM has now joined the party, a stone’s throw away from making its first new all-time high in 2 years. Use this information as you prepare for the coming week and trad’em well.
Join the Premium Users and you can view the Full Version with 20 detailed charts and analysis: Macro Week in Review/Preview November 8, 2024
44 notes
·
View notes
Text
The Democrats complained for MONTHS that the economy was the best ever - the BEST! But as we look across the global economy today, there's very real evidence that we're treading on thin ice. Beneath the surface of macroeconomic data lie unsettling signals pointing to a fragile and vulnerable economic landscape.from Eurodollar University
Job markets are cooling, consumer resilience is fading, and global demand is faltering in key sectors. Central banks, once steadfast on inflation control, are now cutting rates more aggressively than anticipated. Together, these indicators paint a picture of a world economy struggling to maintain stability, with potential downturns lurking in multiple directions. Below, we break down the key data points and industry insights that underscore this precarious economic moment.
Labor Market Weakness:
Declining Job Openings: Job openings tumbled by over 400,000 in September 2024 to 7.44 million, the lowest since January 2021. This signals weakening demand for workers.
Low Hiring Rate: While slightly up for three months, the hiring rate remains depressed at around 5.5 million in September 2024, far below healthier levels.
Declining Quits Rate: The quits rate fell to around 3 million, similar to 2015 levels, suggesting workers are hesitant to leave their jobs due to a perceived lack of opportunities.
Rising Layoffs: Layoffs and discharges rose above 1.8 million in September 2024, the highest since January 2023, signaling a potential uptrend in job losses.
Private Payroll Weakness: Private payrolls were under 100,000 in every month except September since May, even reaching close to zero in August (revised).
Weak October Payrolls: A meager increase of 12,000 jobs in October 2024, with private payrolls down 28,000.
Declining Hours Worked: The hours worked index has been flat for four months (since May 2024). The average workweek fell back to a cycle low of 34.2 hours.
Anecdotes:
Bartenders, waiters, and waitresses report declining tips, foot traffic, and overall lower restaurant sales. Some have had their hours cut despite base pay raises, forcing them to seek additional jobs.
Nissan cutting production of North American models by 30% due to lower sales and rising inventories. Similar struggles reported by Ford and Stellantis.
German auto parts maker Schaeffler AG cutting 4,700 jobs in Europe due to lower automotive production and general industrial weakness.
Expert Quotes:
Ryan Sweet (Oxford Economics): While a prior job openings increase was encouraging, he emphasizes the importance of consistent improvement and close monitoring of the quits and layoff rates.
Elizabeth Renter (NerdWallet): Observes that employers are hesitant to hire and workers are reluctant to leave their current jobs.
12 notes
·
View notes
Text
its caturday and i dont remember if i poemed yesterday
or not
the daily isnt always - lately
for the record - morning +kitty (good and always) = morning kitty poeming - everything else is gravy - we mean that i hope u real eyes meta for ick lee - it could also be an on top cherry
progressing on to murder birdsong - weather - (hint its sf summer = gray and not warm specially when its windy which is often)
yah we kinda looked at the world in the big picture and too much fuckery - little picture samesame
cant shake the old af feeling tho maybe on an uptrend that lasts more than a minnit
magic and music memory fumes and sometimes a spark
"fear is the mindkiller...little death" - f herbert
like that sorta
then the cha cha cha
a tangent
anyway
hallelujah
23 notes
·
View notes
Text
Stock Market Outlook - December 8 2024
Stock Market Outlook entering the Week of December 8th = Uptrend ADX Directional Indicators: Uptrend On Balance Volume Indicator: Uptrend Institutional Activity (Price & Volume): Uptrend ANALYSIS The stock market outlook remains in an uptrend as investors look forward to the annual “Santa Claus rally”. The S&P500 ( $SPX ) rose 1.5%. The index sits ~4% above the 50-day moving average and ~11%…

View On WordPress
6 notes
·
View notes
Text
By: Stephen Johnson
Published: Apr 9, 2021
A recent meta-analysis overviewed 75 studies on children’s gender-related toy preferences.
The results found that “gender-related toy preferences may be considered a well-established finding.”
It’s a controversial topic: Some people argue that these preferences stem from social pressure, while others say they’re at least partly rooted in biology.
There’s more gender equality in Western societies today than in the past. Inequalities still exist, of course, but research has consistently shown an uptrend in women joining and rising within the workforce, obtaining degrees, and earning more money. The social expectations of men and women also seemed to have changed; this is harder to measure empirically, but it seems safe to say that our ideas about gender roles are more fluid today than they were, in say, the 1950s.
So, have these changes affected a crucial part of children’s development: play? More specifically, as gender roles have become more fluid, have children’s preferences toward gender-typed toys become more fluid, too?
The short answer seems to be no. For decades, studies have shown that boys and girls generally prefer playing with toys typically associated with their biological sex: toy trucks for boys and dolls for girls, to give a rough example.
These results have remained remarkably stable over the past 50 years, according to a 2020 meta-analysis of research on gender differences in toy preferences. Published in Archives of Sexual Behavior and titled “The Magnitude of Children’s Gender‐Related Toy Interests Has Remained Stable Over 50 Years of Research,” the analysis examined 75 previous studies, 113 effect sizes, and a range of toy preference measurements.
The authors, Jac T. M. Davis and Melissa Hines, found “a broad consistency of results across the large body of research on children’s gender-related toy preferences: children showed large and reliable preferences for toys that were related to their own gender. Thus, according to our review, gender-related toy preferences may be considered a well-established finding.”
A letter to the editor in the same journal sought to challenge these findings in a separate analysis, which concluded that children actually spend less time playing with gender-typical toys these days.
The authors of that analysis speculated that the reason for this decline “might reflect social pressures in recent times for children to be less gender-typical in their behavior.” In other words, the decline stems from parents wanting to be more in line with progressive ideas about gender fluidity.
However, Davis and Hines disagreed, proposing that the supposed decline appeared in the analysis only because of the specific methodology employed by the researchers. What’s more, they noted that toy advertisers have been using more gender stereotypes to boost sales in recent decades—a finding that potentially complicates the claim that social pressures are causing kids to spend less time playing with gender-typical toys.
Davis and Hines concluded:
“It may be tempting to think that social changes over time might be reducing children’s play with gender-related toys, given arguments that play with a broader set of toys would be beneficial for both boys and girls. Unfortunately, however, broad change in the social roles of men and women do not seem to have influenced children’s toy choices, perhaps because they have been counteracted by stronger marketing of different toys to girls and boys over recent time. If society wants girls and boys to play with the full range of toys, more targeted action is probably required.”
Why are we so concerned about which toys kids play with?
But does society really want kids to play with less gender-typical toys? Some research suggests the answer is yes. A 2017 survey from Pew Research Center found that a majority of Americans considered it a “somewhat or very good thing” to steer kids toward toys and activities traditionally associated with the opposite gender (though respondents were less enthusiastic about doing so for boys than girls).
Encouraging kids to play with a wider range of toys could yield benefits. For example, a 2020 study published in Frontiers in Human Neuroscience found that when both boys and girls play with dolls, they experience heightened activation within brain regions associated with empathy and perspective-taking.
But no matter what society wants, it’s worth noting that there seem to be some biological drivers behind children’s preferences for gender-typical toys.
For example, studies have shown that babies tend to prefer toys oriented to their own gender, a finding that suggests their preference is innate because they’re in the pre-socialization stage of development. Supporting that argument are studies showing that baby monkeys also display gender-typical toy preferences.
Still, it’s easy to see how social pressures might affect kids’ toy preferences as they grow up. So, the question of why kids prefer the toys that they do likely boils down to a familiar answer: a tangled mix of environmental and biological factors.
“It would be extreme to claim zero influence of biology on gender differences in toy choices, and the research community is still divided on how important biology and social factors are,” Davis told Big Think.
--
Abstract
Sex differences in children's toy preferences are thought by many to arise from gender socialization. However, evidence from patients with endocrine disorders suggests that biological factors during early development (e.g., levels of androgens) are influential. In this study, we found that vervet monkeys (Cercopithecus aethiops sabaeus) show sex differences in toy preferences similar to those documented previously in children. The percent of contact time with toys typically preferred by boys (a car and a ball) was greater in male vervets (n=33) than in female vervets (n=30) (P<.05), whereas the percent of contact time with toys typically preferred by girls (a doll and a pot) was greater in female vervets than in male vervets (P<.01). In contrast, contact time with toys preferred equally by boys and girls (a picture book and a stuffed dog) was comparable in male and female vervets. The results suggest that sexually differentiated object preferences arose early in human evolution, prior to the emergence of a distinct hominid lineage. This implies that sexually dimorphic preferences for features (e.g., color, shape, movement) may have evolved from differential selection pressures based on the different behavioral roles of males and females, and that evolved object feature preferences may contribute to present day sexually dimorphic toy preferences in children.
-
Abstract
Socialization processes, parents, or peers encouraging play with gender specific toys are thought to be the primary force shaping sex differences in toy preference. A contrast in view is that toy preferences reflect biologically determined preferences for specific activities facilitated by specific toys. Sex differences in juvenile activities, such as rough and tumble play, peer preferences, and infant interest, share similarities in humans and monkeys. Thus if activity preferences shape toy preferences, male and female monkeys may show toy preferences similar to those seen in boys and girls. We compared the interactions of 34 rhesus monkeys, living within a 135 monkey troop, with human wheeled toys and plush toys. Male monkeys, like boys, showed consistent and strong preferences for wheeled toys, while female monkeys, like girls, showed greater variability in preferences. Thus, the magnitude of preference for wheeled over plush toys differed significantly between males and females. The similarities to human findings demonstrate that such preferences can develop without explicit gendered socialization. We offer the hypothesis that toy preferences reflect hormonally influenced behavioral and cognitive biases which are sculpted by social processes into the sex differences seen in monkeys and humans.
-
Parents of young children will tell you that boys like different toys than girls; they are intrigued by Bob the Builder, Transformers of all kinds, trucks, police cars, front loaders, bikes, skate boards, and wagons. Girls too like bikes, cars and Legos, but also play with stuffed animals and dolls, toys that boys find less appealing for active play. Is this difference in toy preference due exclusively to socialization by parents, other children, and the media, or are there basic perception/action differences between males and females that make some toys a better “fit” for or more attractive to one sex than another? In this issue, Hassett et al. (2008) provide evidence that male and female rhesus monkeys (Macaca mulatta) of all ages and ranks show preferences for wheeled and plush toys that resemble the preferences shown by human children in many studies of toy choice. This cross-species demonstration of male–female differences in toy choice strongly supports and extends prior work with humans (e.g., Berenbaum and Hines, 1992; Campbell et al., 2000; Pasterski et al., 2005; Serbin et al., 2001) and vervet monkeys (Alexander and Hines, 2002) showing that sexually dimorphic toy preferences reflect basic neurobiological differences between males and females and are not caused solely by socialization, as has been suggested by cognitive-social theories of gender role behavior (Caldera et al., 1989; Carter and Levy, 1988; Pomerleau et al., 1990; Roopnarine, 1986).
-
Abstract
Sex differences in children's toy play are robust and similar across cultures [1,2]. They include girls tending to play more with dolls and boys more with wheeled toys and pretend weaponry. This pattern is explained by socialization by elders and peers, male rejection of opposite-sex behavior and innate sex differences in activity preferences that are facilitated by specific toys [1]. Evidence for biological factors is controversial but mounting. For instance, girls who have been exposed to high fetal androgen levels are known to make relatively masculine toy choices [3]. Also, when presented with sex-stereotyped human toys, captive female monkeys play more with typically feminine toys, whereas male monkeys play more with masculine toys [1]. In human and nonhuman primates, juvenile females demonstrate a greater interest in infants, and males in rough-and-tumble play. This sex difference in activity preferences parallels adult behavior and may contribute to differences in toy play [1]. Here, we present the first evidence of sex differences in use of play objects in a wild primate, in chimpanzees (Pan troglodytes). We find that juveniles tend to carry sticks in a manner suggestive of rudimentary doll play and, as in children and captive monkeys, this behavior is more common in females than in males.
==
So, it turns out boys and girls are real and different, not merely "social constructs." Shocking, I know.
This is an imaginary "problem."
Our primate relatives have no plausible mechanism for social constructivism, yet exhibit the same sex-based tendencies, behaviors and preferences.
The people who believe that children are different due to social engineering believe it because they want to socially engineer children. They think it's all brainwashing, and they want to be the ones doing the brainwashing. Because they're also covert evolution-deniers.
It's just as okay to be sex-typical as it is to be non-conforming.
#Stephen Johnson#sex differences#social constructivism#social construct#human biology#evolutionary psychology#evolution#sex typical#gendered toys#religion is a mental illness
6 notes
·
View notes