#$SPY
Explore tagged Tumblr posts
Visit Tumblr Blog
Explore Tumblr blogs with no restrictions, modern design and the best experience.
Last Seen Tumblr Blogs


Fun Fact
130K people were victims of a chain letter scam that affected Tumblr in May 2011.
Text
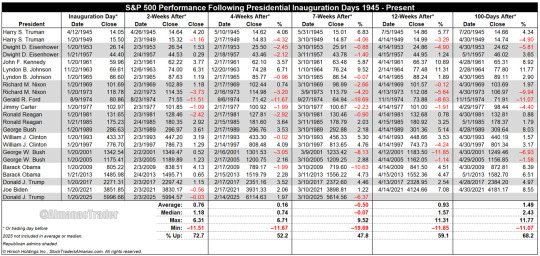
4th Worst Post Inaugural S&P 500 Performance since WWII
Click here to view table full size…
President Trump’s fast and furious pace of change to kick off his second term has created a great deal of uncertainty. Historically, the market has not performed well during periods of uncertainty. Monday, March 10, marked the seven weeks since Inauguration Day and as of the close S&P 500 was down 6.37%, its fourth worst post inaugural performance since 1945. Presidents Obama (2009), W. Bush (2001) and Ford (1974) suffered greater declines through the seventh week.
In the above table we have included the S&P 500’s performance every Inauguration Day since April 12, 1945, when Truman became President following the death of FDR. We also included November 1963, when Johnson took over after JFK was assassinated and Ford in August 1974, following Nixon’s resignation. We use the close on Inauguration Day or the day before when it landed on a holiday like this year. Republican Administrations are shaded in grey.
Seven weeks may be an odd data point to consider but it is consistent with the current time frame. Looking out to 12-Weeks After and 100-Days After, we see an improvement in S&P 500 performance with average, median and frequency of gains improving. Should the market find support, a rebound would be consistent with past post inaugural performance.
157 notes
·
View notes
Text
What to expect from the stock market this week

Last week, the review of the macro market indicators saw with October in the books and heading into the election and FOMC meeting, equity markets experienced a Halloween spooking. Elsewhere looked for Gold ($GLD) to continue its uptrend while Crude Oil ($USO) consolidated at the bottom of a broad range. The US Dollar Index ($DXY) looked to consolidate in its uptrend while US Treasuries ($TLT) pulled back in their consolidation. The Shanghai Composite ($ASHR) looked to continue the short term move higher while Emerging Markets ($EEM) pulled back in their uptrend.
The Volatility Index ($VXX) looked to remain at a neutral level, above the base established this year, and was likely to stay there at least until after the election. This might make for choppy light trading for equity markets to start next week. Their charts looked strong on the longer timeframe though. On the shorter timeframe both the $QQQ and $SPY had reset momentum measures lower and could reverse or turn bearish, likely a couple of days’ time would tell. The $IWM did not seem concerned about an election or Fed policy, churning sideways.
The week saw major movements happen following the election. It played out with Gold pulling back from its high Wednesday before a partial recovery while Crude Oil found some strength and moved higher in a choppy range. The US Dollar jumped to a 4 month high while Treasuries fell back to a 5½ month low Wednesday before a recovery. The Shanghai Composite continued the move to the upside while Emerging Markets chopped in a wide range.
Volatility crashed down to the low end of the range since August. This put a stiff breeze at the backs of equities and they started to move up Tuesday and then accelerated Wednesday through the end of the week. This resulted in the SPY and QQQ printing a new all-time highs Wednesday, Thursday and Friday and the IWM gapping up to a 1 year high. What does this mean for the coming week? Let’s look at some charts.

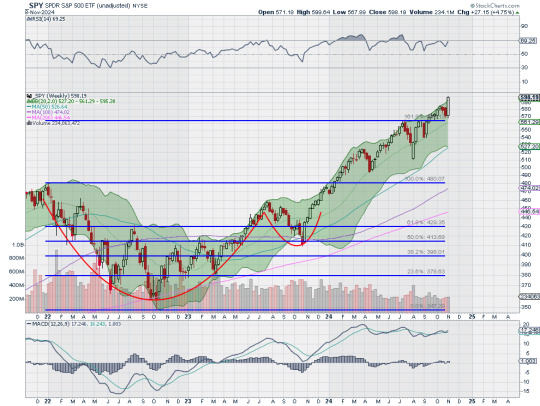
The SPY came into the week at the 50 day SMA on the daily chart in a pullback from the top. It had a gap left open from the end of the week. It held there on Monday and then started higher Tuesday, into the gap. It gapped up Wednesday to finish at a new all-time high and leaving an island below. It followed that up with new all-time highs Thursday and Friday. The Bollinger Bands® are open to the upside. The RSI is rising deep in the bullish zone with the MACD positive and rising.
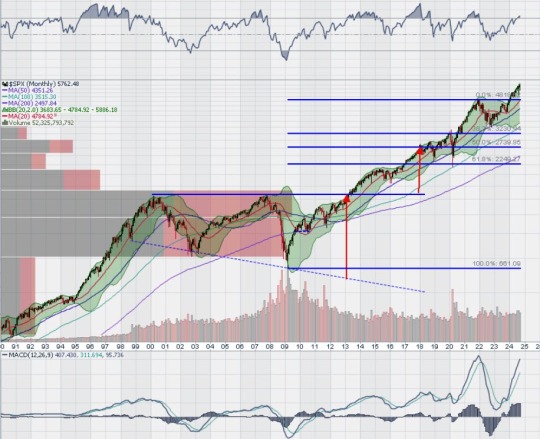
The weekly chart shows a strong, long bullish candle rising from the 161.8% extension of the retracement of the 2022 drop. The 200% extension is now within view at 614 above. The RSI is rising near overbought territory in the bullish zone with the MACD drifting up and positive. There is no resistance above 599.60. Support lower sits at 585 and 580 then 574.50 and 571.50 before 565.50 and 556.50. Uptrend.
With the Presidential Election and November FOMC meeting in the rearview mirror, equity markets showed jubilation as they vaulted higher. Elsewhere look for Gold to in its uptrend while Crude Oil consolidates in a broad range. The US Dollar Index continues to move to the upside while US Treasuries consolidate in their pullback. The Shanghai Composite looks to continue the move higher while Emerging Markets chop in their short term uptrend.
The Volatility Index looks to remain low and drifting lower following the election making it easier for equity markets to continue higher. Their charts look strong on both timeframes, especially the SPY and QQQ. The IWM has now joined the party, a stone’s throw away from making its first new all-time high in 2 years. Use this information as you prepare for the coming week and trad’em well.
Join the Premium Users and you can view the Full Version with 20 detailed charts and analysis: Macro Week in Review/Preview November 8, 2024
44 notes
·
View notes
Text
as a child there's nothing cooler than a kid who gets subjected to evil experiments and gains special abilities. it's even cooler if these abilities also cause unfathomable suffering to use/against others. children love stories like this.
#I'm talking about max ride flatmate is watching spy x family#reminiscing on my multiple stories and ocs about this like truly#I think this might not be as universal as i think but if you liked max ride it probably was. my main oc as a tiny child was#a girl who grew up to be an unethical scientist who loved experimenting on humans and children. she could turn into a flying purple wolf bt#maximum ride
40K notes
·
View notes
Text
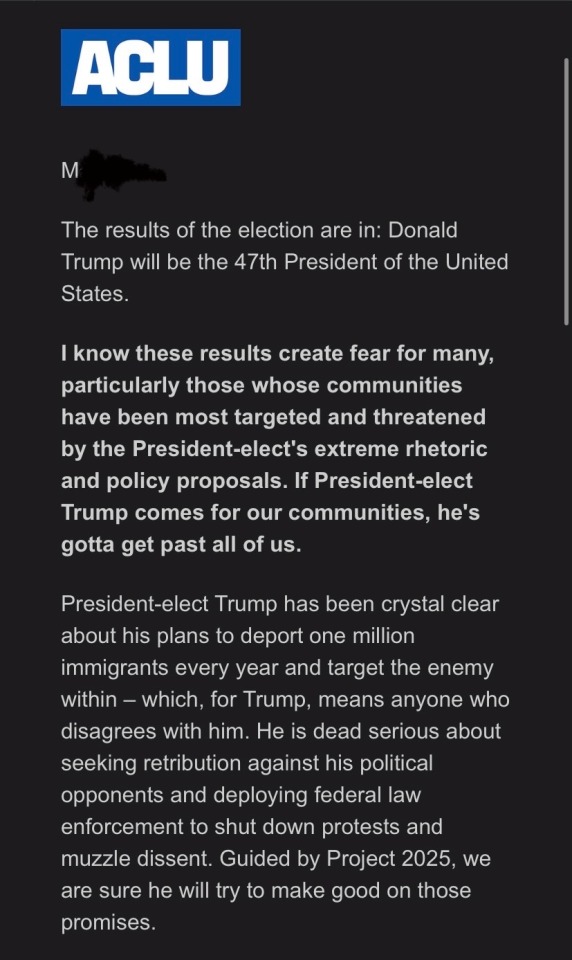
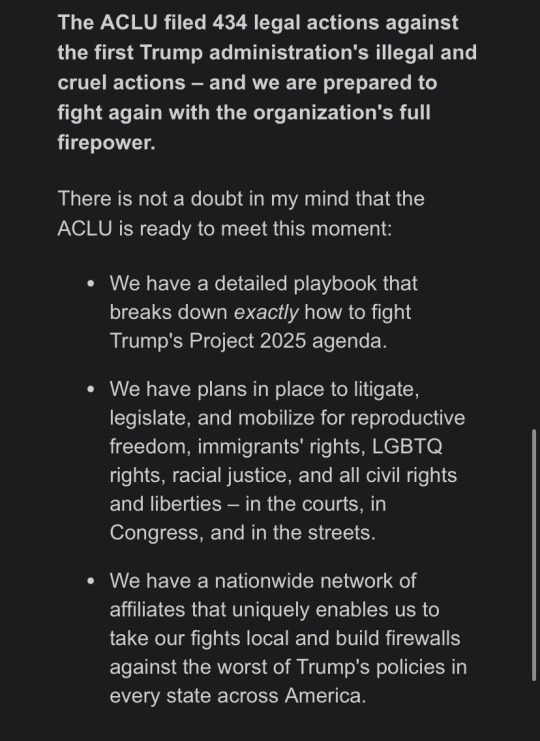
A Pragmatic and surprisingly comforting perspective about the Trump 2nd Presidency from the ACLU
***Apologies if this is how you found out the 2024 election results***
Blacked out part is my name.


I’m not going to let this make me give up. It’s disheartening, and today I will wallow, probably tomorrow too
AND
I will continue to do my part in my community to spread the activism and promote change for the world I want to live in. I want to change the world AND help with the dishes.
And I won’t let an orange pit stain be what stops me from trying to be better.
A link to donate to the ACLU if able and inclined. I know I am
#us politics#donald trump#election 2024#aclu#a promise to myself#how is this comforting you May ask#bc we are not fighting alone or uninformed#we have good and strong groups in our corners defending what we believe in#it’s not over yet#we have to try and pushback#added Alt image descriptions since this is leaving containment#happy to see many engaging with this to either donate time or money or both#really warms the cold heart of mine#wow this broke containment#overall it’s been pretty nice seeing people engaging with it ready to roll up their sleeves and get to work#they did the travel ban right at the beginning of the previous presidency too#also every major civil battle in the last century#brown V board of education- the one that desegregated schools#loving V Virginia- legalized interracial marriage#roe V wade- legalized abortion#United States V Nixon- watergate scandal WHICH LIMITED US PRESIDENTAL POWER#Edwards v. Aguillard- helped allow schools to teach evolution#Planned Parenthood v. Casey- another abortion case#ACLU v. NSA- to stop the NSA spying on wikipedia users#Ingersoll v. Arlene's Flowers- fought to stop LGBTQ discrimination from businesses#Obergefell v. Hodges- case that legalized gay marriage#literally WAY MORE GUYS#so don’t fall into dispair! these are literally one of the good ones!
26K notes
·
View notes
Text

i can't resist the cute trends ✨️
#my art#spy x family#spy x family fanart#fanart#art#anime#digital art#animeart#loid forger#yor forger#twiyor#art trend#archie comics#i'm so excited to draw anything again
12K notes
·
View notes
Text

Getting ready for the party 💃
#it's been a minute since I've done sxf art#i've realised that drawing children is trickier than I thought - I think I've made her look older than a toddler but oh well#anyway I headcanon loid did her hair and yor took a dozen of pictures#wait did they have portable cameras in their time huh#can't wait for the new season this year#spy x family#sxf#loid forger#anya forger#o0kawaii0o
10K notes
·
View notes
Text

Anaïs Nin, from a novel titled "A Spy in the House of Love," published in 1954
23K notes
·
View notes
Text


15K notes
·
View notes
Text
#tumblr polls#one piece#chainsaw man#jujutsu kaisen#yu yu hakusho#dungeon meshi#my hero academia#spy x family#black clover#jojo bizarre adventure
35K notes
·
View notes
Text


how do you compete with an angel? become one yourself
#twiyor#tw blood#sxf#spy x family#comic#my art#long post#yor forger#loid forger#thorn princess#edit: changed caption to be deep teehee
19K notes
·
View notes
Text


✧ soaring high above, watching over you ✧
#spy x family#yor forger#anya forger#sxf#long time no spyfam! I come bearing bittersweet comics and overtime work for dr. forger
10K notes
·
View notes
Text
Halloween Trading Strategy Treat Begins Next Week

Next week provides a special short-term seasonal opportunity, one of the most consistent of the year. The last 4 trading days of October and the first 3 trading days of November have a stellar record the last 30 years. From the tables below:
DJIA: Up 24 of last 30 years, average gain 1.95%, median gain 1.39%. S&P 500: Up 25 of last 30 years, average gain 1.96%, median gain 1.61%. NASDAQ: Up 25 of last 30 years, average gain 2.43%, median gain 2.29%. Russell 2000: Up 23 of last 30 years, average gain 2.34%, median gain 2.56%.
Many refer to our Best Six Months Tactical Seasonal Switching Strategy as the Halloween Indicator or Halloween Strategy and of course “Sell in May”. These catch phrases highlight our discovery that was first published in 1986 in the 1987 Stock Trader’s Almanac that most of the market’s gains have been made from October 31 to April 30, while the market, on average, tends to go sideways to down from May through October.
Since issuing our Seasonal MACD Buy signal for DJIA, S&P 500, NASDAQ, and Russell 2000, on October 11, 2024, we have been moving into new long trades targeting seasonal strength in various sectors of the market via ETFs and a basket of new stock ideas. The above 7-day span is one specific period of strength during the “Best Months.” Plenty of time remains to take advantage of seasonal strength.


24 notes
·
View notes
Text
What to expect from the stock market this week
Last week, the review of the macro market indicators saw with the inflation reports behind us, equity markets showed strength with the SPY ending at an all-time high. Elsewhere looked for Gold ($GLD) to continue its uptrend while Crude Oil ($USO) consolidated in a broad range. The US Dollar Index ($DXY) continued to move to the upside while US Treasuries ($TLT) consolidated in their downtrend. The Shanghai Composite ($ASHR) looked to reverse lower while Emerging Markets ($EEM) consolidate the start of an uptrend.
The Volatility Index ($VXX) looked to remain low making the path easier for equity markets to the upside. Their charts looked strong, especially the $SPY and $QQQ on the longer timeframe. On the shorter timeframe both the QQQ and SPY were now ready to resume the move higher. The $IWM looked a bit less powerful but was holding near resistance, a good show of relative strength for the small caps.
The week played out with Gold chugging higher and ending at a new all-time high while Crude Oil fell back in the broad consolidation. The US Dollar met resistance at a lower high at the end of the week while Treasuries printed a Dead Cat Bounce after finding support Monday. The Shanghai Composite continued lower toward the September month end gap while Emerging Markets turned consolidation into a falling wedge.
Volatility drifted down to the lowest close of the month. This gave equities some breathing room and they rose to to start the week with the SPY printing a new all-time high Monday. All gave back some gains midweek before recovering to finish the week strong. This left the SPY back at the high, the QQQ near the October high and the IWM holding at nearly 3 year highs. What does this mean for the coming week? Let’s look at some charts.
SPY Daily, $SPY

The SPY came into the week at a new all-time high. It started off on the right foot making another one on Monday but ended out of the Bollinger Bands® on the daily chart. That led to a pullback on Tuesday and small reversal higher on Wednesday. Thursday broke higher as well with a gap up at the open, but it did not hold and then another gap up Friday held with the SPY ending at a new all-time high. The RSI is rising in the bullish zone with the MACD positive and climbing as those Bollinger Bands point higher.
The weekly chart shows a 6th consecutive move higher as it makes some separation from the 161.8% extension of the retracement of the 2022 drop. The RSI is making a higher high, negating a possible momentum divergence with the MACD crossed up and rising. There is resistance at 585 above. Support comes at 580 and 574.50 then 571.50 and 565.50 before 561.50 and 556.50. Uptrend.
SPY Weekly, $SPY

With the October Options Expiration in the books, equity markets showed some strength battling against a narrative of slower Fed cuts. Elsewhere look for Gold to continue its uptrend while Crude Oil drops in consolidation. The US Dollar Index may reverse the short term uptrend while US Treasuries pullback in consolidation. The Shanghai Composite looks to drop back from its spike while Emerging Markets stall in their move higher.
The Volatility Index looks to remain low making the path easier for equity markets to the upside. Their charts look strong, especially on the longer timeframe. On the shorter timeframe the SPY is leading the way higher with the QQQ slowly battling back to its high and the IWM poking its head up perhaps to make another attempt at a run higher. Use this information as you prepare for the coming week and trad’em well.
Join the Premium Users and you can view the Full Version with 20 detailed charts and analysis: Macro Week in Review/Preview October 18, 2024
48 notes
·
View notes
Text

TF2 will always have a special place in my heart
#tf2#team fortress 2#tf2 medic#tf2 heavy#tf2 sniper#tf2 spy#tf2 soldier#tf2 scout#tf2 engineer#tf2 demoman#tf2 pyro#valve#art#my art#the only reason why i made a steam account long ago
11K notes
·
View notes
Text


Thanks Valve, I’m crying
#tf2#team fortress 2#tf2 spoilers#sobbing#tf2 sniper#tf2 scout#tf2 medic#tf2 spy#tf2 heavy#tf2 engineer#tf2 pyro#tf2 demoman#tf2 soldier#actually where’s pyro is this photo
10K notes
·
View notes