#usa inflation data
Text
US inflation rate hits 2-year low | World Business Watch|good news for us government|
#us inflation#usa#usa news#usa latest news#us#usa inflation data#usa inflation data news#usa inflation data latest news#usa inflation latest news#usa inflation news#usa inflation news today#usa inflation#usa july inflation data#usa july inflation news#usa july inflation down#usa july inflation#dow jones#dow jones future
0 notes
Text
Sex Differences in Serial/Mass Murder
I recently received an ask about a specific female serial killer, which I will be answering soon, but I wanted to make a separate post about serial/mass murder statistics for those who'd like a more generic discussion (rather than about a specific person).
For terminology: serial murder refers to the killings of multiple people over separate events while mass murder refers to the killing of many people within a single event. The line between these can be blurred in some cases (e.g., if a man shoots and kills his family before going on a "rampage" and killing many unrelated individuals is that serial or mass murder?), but that this the rough delineation between the two.
---
Serial Murder
Professionals working at Radford University and Florida Gulf Coast University (FGCU) have developed an incredibly interesting Serial Killer Database [1]. It is likely the most (although not completely) comprehensive database of serial killers in existence. They have defined serial murder as "the unlawful killing of two or more victims by the same offenders in separate event".
There is an important note to their research: it can only identify known serial killers for which some record has been kept. (I'll explicate why this is important to keep in mind later. But, first some stats:)
They found:
Women make up only ~10% of all (identified) serial killers in history
The percentage of (identified) female serial killers has decreased over time and is lower in the USA compared to other countries
"Financial gain is the primary motive for women serial killers whereas enjoyment is the primary motive for men" (Also discussed in [2]).
"Male serial killers are much more likely that female serial killers to torture victims, mutilate the body after death, and engage in overkill ... [and] more likely to engage in necrophilia"
However, this data is likely skewed towards an over-estimation of female serial killers. As mentioned before, this data base includes only serial killers that have been identified and recorded. As a result:
The number of identified serial killers is much higher for recent modern times (i.e., 20th and 21st centuries) than for all the rest of history combined. (Specifically, there are only 250 recorded serial killers, out of 5752, before 1900). It is unlikely that serial killers are simply a modern phenomenon. Instead, it's most likely that (1) detection methods have been improved over time, such as the advent of modern forensics, (2) record keeping has been improved over time, or (3) both detection and record keep have improved over time.
The above supposition is supported by the difference in serial killer frequency between the USA and other countries. According to the report, ~64% of all serial killers are in the USA. They note, however, that "caution should be taken in reviewing this table as the number of serial killers by country is a function of the number of actual killers, the number caught, and the number reported by police or the media". It is again unlikely that the USA truly houses 64% of the world's serial killers, and more likely that better detection methods and record keeping has skewed the results towards the USA.
As a result of this, however, the percentage of female serial killers is likely inflated by this report. Female serial killers are less likely to kill strangers (a type of serial killing that is often detected and the killer often identified by modern forensics). They are also more likely to have visible benefits (i.e., the financial gain) than male serial killers, potentially providing a clearer link to their crimes prior to modern forensic methods.
In fact, the raw number of female serial killers has remained relatively stable over the recorded time periods (excepting a spike in frequency that was mirrored in the male serial killer statistics). This suggests that, rather than fewer/a smaller proportion of female serial killers being identified over time, the number/proportion of male serial killers identified has been increasing. This is reflected in the decreasing percentage of female serial killers over time.
To obtain a better estimate of the true proportion prevalence of female serial killers I calculated the proportion within restricted frames. Women make up:
~9% of all identified serial killers after 1900
~7.5% of all identified serial killers after 1900 in the USA
~7% of all identified serial killers over the last 50 years (since 1970)
~6% of all identified serial killers over the last 50 years (since 1970) in the USA
Given this, it's likely that the true proportion of female serial killers is closer to 6-7%.
For the interested, this review [2] and this article [3] elucidate the differences between female and male serial killers.
---
Mass Murder
I have previously made a few posts about the connection between domestic violence and mass shootings, but I'll expand on mass shooting statistics here with some interesting new sources.
First, the U.S. Department of Homeland Security has recently released a first of its kind report on "Mass Attacks in Public Spaces" [4]. The inclusion criteria they used was somewhat restrictive (only for 2016-2020, in the USA, harmed three or more people, in public locations). Despite this, the data is high quality, and carefully analyzed. Importantly, they found that 96% of the attackers were male.
Further, they found "nearly half of the attackers were found to have had a history of domestic violence, misogynistic behaviors, or both." (It is also possible -- even likely -- that, given the minimal attention paid to misogynistic biases by mass violence task forces, that other attackers had an undocumented history of domestic violence/misogynistic behaviors.)
Other studies with slightly different inclusion criteria find similar results:
Looking at public shootings with four or more victims in the USA between 1966 and 2017, found men were the attackers in 96% of shootings. [5] (Importantly, this analysis excludes familicides and mass shootings connected to organized crime/gang violence. Both of these types of crimes are also male dominated.)
"Familicide is almost exclusively a crime perpetrated by men." [6] (A hard statistic for this crime is difficult to pin down, it's certainly >95%, but many sources put it either at or extremely close to 100%.)
Another analysis looking at public shootings with four or more victims in the USA between 1976 and 2018, found 98% of shooters were male. [7] This source demonstrates the issue with restricting analysis to only public shootings, as over 80% of mass shootings during this time period were not public.
A final source [8] documents various tools attempting to track mass shootings and the differences between them. In summary, they find men were the shooter in 98% of incidents.
---
Ultimately, this indicates that in addition to accounting for at least 90% of all "normal" homicide perpetrators (post with data and [9] which indicates that the global proportion is closer to 95%), men also make up >90% of serial killers and >95% of mass murderers.
References below the cut:
Aamodt, M. G., Leary, T., & Girimurugan, S. (2023). Radford/FGCU Annual Report on Serial Killer Statistics: 2023 Radford, VA: Radford University.
Miller, L. (2014). Serial killers: I. Subtypes, patterns, and motives. Aggression and Violent Behavior, 19(1), 1–11. https://doi.org/10.1016/j.avb.2013.11.002
Gurian, E. A. (2017). Reframing serial murder within empirical research: Offending and adjudication patterns of male, female, and partnered serial killers. International Journal of Offender Therapy and Comparative Criminology, 61(5), 544–560. https://doi.org/10.1177/0306624X15598572
National Threat Assessment Center. (2023). Mass Attacks in Public Spaces: 2016 - 2020. U.S. Secret Service, Department of Homeland Security.
Capellan, J. A., Johnson, J., Porter, J. R., & Martin, C. (2019). Disaggregating mass public shootings: A comparative analysis of disgruntled employee, school, ideologically motivated, and rampage shooters. Journal of Forensic Sciences, 64(3), 814–823. https://doi.org/10.1111/1556-4029.13985
Karlsson, L. C., Antfolk, J., Putkonen, H., Amon, S., Da Silva Guerreiro, J., De Vogel, V., Flynn, S., & Weizmann-Henelius, G. (2021). Familicide: A systematic literature review. Trauma, Violence, & Abuse, 22(1), 83–98. https://doi.org/10.1177/1524838018821955
Duwe, G. (2020). Patterns and prevalence of lethal mass violence. Criminology & Public Policy, 19(1), 17–35. https://doi.org/10.1111/1745-9133.12478
Smart, R., & Schell, T. L. (2021). Mass shootings in the united states. Mass Shootings in the United States. https://www.rand.org/research/gun-policy/analysis/essays/mass-shootings.html
Homicide and Gender. (2015). UNODC United Nations Office on Drugs and Crime.
47 notes
·
View notes
Text
Brazil's real slips to near 1-week low in thin Latam holiday trade

Brazil's real slipped to a near one-week low against a muted dollar in thin trading volume, dragging the Latin American currencies index, while investors awaited a key U.S. inflation test for more clues on the Federal Reserve's policy outlook.
The MSCI index tracking Latam currencies .MILA00000CUS fell 0.2%, on track for only slight gains this quarter, losing steam following the previous quarter's near 6% jump, with the dollar index =USD set for a strong quarterly advance, owing to doubts over U.S. rate cuts this year.
"Some Fed members believe that rate cuts can be delayed and that perhaps only two are needed. This puts renewed downward pressure on all Latam and EM which now face a bit of central bank policy divergence after committing to slashing borrowing costs," said Juan Perez, director of trading at Monex USA.
All eyes will be on the Fed's preferred inflation gauge, the so-called core personal consumption expenditures (PCE) price index data, due on Friday. Any negative surprises could further blur the U.S. rate cuts picture.
Continue reading.
10 notes
·
View notes
Photo
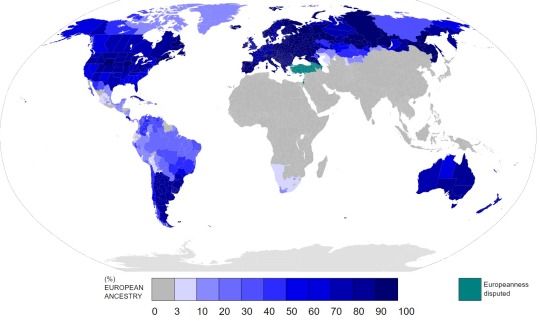
Map of percentage of people with European* ancestry, largely based in Ethnic self identification in censuses and in a broad ethnoreligious approach.
The very concept of "European peoples" is contested. "Europe" itself is not a geographical accurate term, given the fact that the borders between Europe and (specially) Asia are historical, cultural and political more than physical. Read more here: https://en.wikipedia.org/wiki/Boundaries_between_continents#Europe_and_Asia
In the latest version of this map I'm considering all ethnic groups with an European homeland since at least several centuries as "Europeans". So all North Caucasus peoples, Bosniaks, Albanians are considered Europeans.
Georgia, Armenia, Azerbaijan, Turkey, Cyprus and Israel are shaded in turquoise due to lack of consensus in their "Europeanness".
Some groups in the Ural/Volga border as the Nenets and the Kalmyk peoples are not considered Europeans due to their strong historical ties to Siberia and Mongolia, but this is debatable.
West Afroasian Christians as Egyptian Copts and Arab Christians are not considered European.
Mixed race people: different criteria so explanations are given. Mixed race people are often counted separately in many censuses and follow the one drop rule (one drop of non European blood means that people is out of the European ancestry group and into the Mixed ancestry or even African/Asian group). Whenever this is the case, I just follow the census country criterion. For example, the USA follow the one-drop rule, so African-Americans with 20% African ancestry and 80% European would count as 0% European ancestry in this map). Given the fact "Mestizo" and "Colored" are separate categories in many censuses (in Latin America or South Africa) from "White" or "European", I'm considering those 0% European ancestry despite the fact those people probably have European ancestry, because of lack of genetic data (the answer to questions like "are Mestizos 10% European or 90%?" is really hard to find in many countries, so I'm being conservative). Other issue can be found in how people identify themselves in Latin American and other mixed-race countries: a 80% Amerindian 20% European mixed race population self identified as "White", "Caucasoid" or "European" is counted as 100% European ancestry in this map. So numbers are sometimes inflated, and sometimes reduced to some point. Obviously no massive DNA analysis are performed in censuses so we rely on the information they gather based in self identification and this map has to be read in that way. Anyway, I'm not using the one-drop rule, but the genetic admixture rule, in some cases when the census is not explicit about this and I have to take a decission AND I happen to have genetic precise data: for example, mixed Asian-European groups in Russia (like Mari people) are counted as (for example) 30 to 70% European ancestry following genetic studies on Mongoloid admixture (which I managed to find) in every Eurasian ethnic group . Also check the sources for more information, a lot of data is gathered from the European Diaspora article so I'm not deeply following every link, but just assuming that data is acceptable and accurate in a broad sense. Ask the original editors of this article for further information. Anyway, numbers and percentages probably don't change so much after all these calculus, so the map is correct in general (maybe take a +-10% error in Eurasia and +-20/30% in Latin America, where ancestries are much more mixed). In Chile, lack of self identification ancestry in censuses led me to search genetic data as well.
This is NOT a map of the White race, just an "European ancestry" map. Thats the reason North African, Middle Eastern and Indo-Iranian peoples majority territories are not shaded. Anyway, some countries don't specify the origin of "White people" in their censuses so I'm taking "Caucasian" and "White" self identified people in censuses mostly in countries in the Americas as having "European ancestry", so Lebanese ancestry people in Colombia or Morocco ancestry people in the USA are counted as "European ancestry" peoples in this map because of lack of data. Despite of that, numbers and percentages wouldn't be so different considering those details and I encourage everyone who is reading this to do the math and realize these facts.
To sum it up all, generally conservative criteria are taken: the geographical criterion (Middle Eastern Christians and Indo-Iranians are not considered European because their historical roots are in zones of the Asian continent) or the census one-drop-rule criterion (Mixed race peoples with lack of genetic data are not considered European). With other and broader criteria, the map would be completely different and it could be redrawn.
Kurds, Iranians and Kazakhs are not considered here Europeans as ethnic groups that are related or belong to Asian territories.
Source base map: File:Blank_Map_World_Secondary_Political_Divisions.svg
My original sources were a mixture between data in the article ( https://en.wikipedia.org/wiki/European_diaspora ) where the map is, and in countries where the information is detailed enough are taking numbers from censuses from the Russian Wikipedia for all the provinces, oblasts, autonomous regions, etc(see below), censuses from the USA 2010 (numbers listed in https://www.census.gov\/prod/cen2010/briefs/c2010br-05.pdf https://en.wikipedia.org/wiki/White_American ), Australian 2011 census http://www.abs.gov.au/census , and Canada (numbers listed in https://en.wikipedia.org/wiki/Demographics_of_Canada ), and taking into account the number of non-European migrants in the countries of the EU https://en.wikipedia.org/wiki/Immigration_to_Europe .
Kazakhstan: Each province was searched, I went to the russian article where ethnic compositions are given (in Russian). For example, the Akmola region: https://en.wikipedia.org/wiki/Regions_of_Kazakhstan https://ru.wikipedia.org/wiki/%D0%90%D0%BA%D0%BC%D0%BE%D0%BB%D0%B8%D0%BD%D1%81%D0%BA%D0%B0%D1%8F_%D0%BE%D0%B1%D0%BB%D0%B0%D1%81%D1%82%D1%8C Same with the rest (take all the provinces, look for them in the Russian wikipedia, etc): https://ru.wikipedia.org/wiki/%D0%90%D0%BA%D1%82%D1%8E%D0%B1%D0%B8%D0%BD%D1%81%D0%BA%D0%B0%D1%8F_%D0%BE%D0%B1%D0%BB%D0%B0%D1%81%D1%82%D1%8C https://ru.wikipedia.org/wiki/%D0%90%D0%BB%D0%BC%D0%B0%D1%82%D0%B8%D0%BD%D1%81%D0%BA%D0%B0%D1%8F_%D0%BE%D0%B1%D0%BB%D0%B0%D1%81%D1%82%D1%8C I continued with the rest. Russia: http://pop-stat.mashke.org/russia-ethnic2002.htm Brazil: File:People_of_European_Ancestry_in_Brazil.png
Bosnia-Herzegovina: https://en.wikipedia.org/wiki/Religion_in_Bosnia_and_Herzegovina
Kosovo: https://en.wikipedia.org/wiki/Demographics_of_Kosovo#Religion
Albania:
https://en.wikipedia.org/wiki/Religion_in_Albania
Venezuela: https://en.wikipedia.org/wiki/Venezuelan_of_European_descent#White_Venezuelan_population_by_Venezuelan_state
Colombia: https://es.wikipedia.org/wiki/Etnograf%C3%ADa_de_Colombia#Blancos
This numbers are for "blancos+mestizos", as Brazil and Venezuela separate White and Mixed peoples in separate categories, I do the same here correcting this numbers using a 0,43 coefficient according to "The 2018 census reported that the "non-ethnic population", consisting of whites and mestizos (those of mixed white European and Amerindian ancestry, including almost all of the urban business and political elite), constituted 86 percent of the national population. The 87 percent figure is subdivided into 47 percent mestizo and 40 percent white " https://en.wikipedia.org/wiki/Race_and_ethnicity_in_Colombia#cite_note-3
Mexico: Censo de 1921 http://www.inegi.org.mx/prod_Serv/contenidos/espanol/bvinegi/productos/censos/poblacion/1921/EUM/RCGH21I.pdf
Quite old but good approximation, mixed race people is excluded as in Brazil, Venezuela and Colombia due to lack of genetic data. Modern Mexican censuses do not provide ancestry data.
Bolivia: http://bolivia.unfpa.org/sites/default/files/Censo_Poblacion_1900_T2.pdf
Old Census but the last one including ethnic selfidentification, probably numbers are not so different today.
Cuba: http://www.one.cu/publicaciones/cepde/cpv2012/20131107resumenadelantado/tablas/4.pdf
Peru: http://espejodelperu.com.pe/Poblacion-del-Peru/index.htm
guided by http://www.forosperu.net/temas/composicion-etnica-y-racial-del-peru-por-departamentos-actualizado.210657/
Ecuador: http://www.ecuadorencifras.gob.ec/resultados/
Chile: http://www.scielo.cl/scielo.php?script=sci_arttext&pid=S0034-98872014000300001&lng=en&nrm=iso&tlng=en
Turkey: https://en.wikipedia.org/wiki/Demographics_of_Turkey
Azerbaijan: https://en.wikipedia.org/wiki/Ethnic_minorities_in_Azerbaijan
Argentina:
https://www.researchgate.net/publication/317552097_Admixture_in_Argentina?_iepl%5BviewId%5D=7mgiM9aS1rLkhmJH6Fx6jHsg&_iepl%5BprofilePublicationItemVariant%5D=default&_iepl%5Bcontexts%5D%5B0%5D=prfpi&_iepl%5BtargetEntityId%5D=PB%3A317552097&_iepl%5BinteractionType%5D=publicationTitle
167 notes
·
View notes
Text
AMay 17 Facebook post (direct link, archive link) shows a black and white image of several members of Congress gathered together.
The post criticized Republicans for "attacks on the poor and the sick with the threat of catastrophic debt default," then made a claim about former President Donald Trump:
"Trump increased that debt far more than any president in history," the post says in part. "Under Trump, Republicans − and Democrats − had no objection to raising the debt ceiling three times."
House Minority Leader Hakeem Jeffries shared a similar claim on Twitter that garnered over 11,000 likes. A version of that post was posted on Facebook by the left-wing account Occupy Democrats and shared more than 900 times.
Our rating: False
The total federal debt increased more under the Obama administration in terms of raw dollars than any other president, according to government data. Experts say it is difficult to determine how much debt one president is responsible for since spending and policies can carry over from one administration to the next.
Obama incurred more debt than any other president
The post comes after weeks of standstill between President Joe Biden and House Speaker Kevin McCarthy over the issue of raising the debt ceiling, which limits how much the government can borrow, as USA TODAY reported.
But contrary to the post’s claim, the total federal debt increased more under former President Barack Obama than it did under the Trump administration, according to David Primo, a political science and business administration professor at the University of Rochester.
There are different ways of measuring debt, experts said.
Using Treasury Department data, the total public debt, which includes intragovernmental holdings and public debt, increased by approximately $7.8 trillion from the start of Trump’s presidency on Jan. 20, 2017, to when he left office on Jan. 19, 2021. Under Obama, however, the public debt increased by about $9.3 trillion from when he was inaugurated on Jan. 20, 2009, to when he left office on Jan. 19, 2017.
Some experts look at debt accumulated each fiscal year, which starts Oct. 1 of a given calendar year and ends Sept. 30 of the next year, according to Primo. That yields similar results.
Fact check: No, Trump is not required to register as a sex offender after E. Jean Carroll case
At the end of fiscal year 2016 − three months before Trump took office − the debt was about $19.5 trillion, according to historical fiscal year debt data from the Office of Management and Budget. That number increased to about $26.9 trillion at the end of fiscal year 2020 three months before Trump left office, marking a $7.4 trillion increase.
However, at the end of fiscal year 2008 before Obama took office, the debt was about $10 trillion and increased to about $19.5 trillion at the end of fiscal year 2016 before Obama left office, netting approximately a $9.5 trillion increase, according to the data.
There are caveats to these comparisons: Trump was only in office for four years while Obama was in office for eight years. The data for the federal fiscal year overlaps. And in both cases, the debt is measured using the nominal amount added each year, so it doesn't account for inflation.
Some economists believe the debt-to-GDP ratio is a better metric for gauging debt increase because the nominal levels of debt do not matter as much as how much debt the nation has as a share of its output, Primo said. Which president ranks first in this category would depend on the method of calculation used but Trump would not have the highest figures regardless, Primo said.
"In the post-WWII era, the increases in debt as a percentage of GDP were highest during and right after WWII," Primo said. "In the modern era, it’s still not Trump."
Experts say it is hard to blame any one president on rising debt
There are several reasons why it is difficult to cast the blame for increasing debt on any one president, experts said.
Debt increases are due to policies jointly agreed to by Congress and the president, so Congress bears some responsibility, according to Primo.
For instance, Obama signed into law a 2009 stimulus package passed by Congress, which extended former President George W. Bush’s tax cuts, and a tax extenders omnibus bill at the end of 2015, according to the Committee for a Responsible Federal Budget. Both policies worsened debt.
Fact check: Post wrongly claims new House reimbursement policy circumvents Constitution
When Trump was in office, he signed into law the 2017 Tax Cuts and Jobs Act, which lowered statutory tax rates on all taxable income levels and made debt soar, according to the Tax Policy Center and ProPublica.
“The country takes on debt anytime its outlays exceed its revenues,” Primo said. “This can occur due to one-time expenses such as the COVID-19 relief package or to structural changes to the budget, such as tax cuts or the creation of new government programs. In the long run, the biggest drivers of debt increases will be due to entitlements such as Medicare and Social Security.”
All presidents also inherit spending from previous administrations, noted William Hoagland, senior vice president of the Bipartisan Policy Center.
For instance, the Affordable Care Act implemented under Obama carried over to Trump’s presidency. The act expands the Medicaid program and provides health insurance to low-income consumers.
USA TODAY reached out to the social media users who shared the claim for comment but did not immediately receive a response.
The Associated Press and PolitiFact also debunked the claim.
Our fact-check sources:
David Primo, May 23-30, Email exchange with USA TODAY
William Hoagland, May 23-30, Email exchange with USA TODAY
Steve Ellis, May 24-26 Email exchange with USA TODAY
Treasury Department, accessed May 26, Debt to the Penny
Office of Management and Budget, accessed May 26, Federal debt data
Committee for a Responsible Federal Budget, July 25, 2016, Has President Obama Doubled the National Debt?
Tax Policy Center, accessed May 30, Briefing Book
ProPublica, Jan. 14, 2021, Donald Trump Built a National Debt So Big (Even Before the Pandemic) That It’ll Weigh Down the Economy for Years
Associated Press, May 18, FACT FOCUS: Who’s to blame for the national debt? It’s more complicated than one culprit
22 notes
·
View notes
Text
It's never good news for Joe.

June 27, 2024
To hear the mainstream media tell it, Joe Biden is universally disliked and a terrible president. Check out these headlines. From the National Review: "The only problem Joe Biden has is that people think he’s a bad president." New York Magazine: "Why do so many Americans think Biden is doing a bad job?" The Hill: "Biden’s worst-case economic scenario is unfolding at the worst possible time." And the ever-reliable Washington Post: "The 10 worst things President Biden did in 2023."
Maybe the reason many Americans think Biden is doing a bad job is because the media keep telling them that many Americans think Biden is doing a bad job. The reality, however, is quite a bit different.
From all-time highs in the stock market to record job growth (more people are working than at any time in American history) to the lowest inflation rate in years (around 3%) and the lowest unemployment rate (including for minorities) in half a century, America is stronger and more prosperous under Biden’s presidency.
And following the massive spike in crime under Donald Trump's maladministration, the data now show that, with crime rates near 50-year lows, President Biden has restored law and order. Here's a recent comment from MSNBC's Chris Hayes: "One of the most seismic stories of the past few years is the rise and fall of what you might call the 'Trump Crime Wave.'"
In addition, President Biden has made investments to rebuild our infrastructure, passed legislation to curb climate change, and brought about historic expansions of benefits for veterans. He's also repaired America's standing in the world after years of Trump snuggling up to dictators and destroying our alliances, while foreign leaders laughed at his fecklessness.
Still, the media continue to ignore these successes, insisting instead that Biden is old and unpopular. Plus, as Marvin Kalb of the Brookings Institute observes,
What we have all noticed is that as Biden’s poll numbers collapsed, negative coverage of him rose, leading in turn to still lower poll numbers, which have only further darkened his political prospects.
In a misguided compulsion to “balance” their justifiably negative coverage of Trump with unjustifiably negative stories about Biden, the media persistently paint anything Biden does in the worst possible light. When Biden made a slip-up in reading the teleprompter during a speech at a trade union conference, USA Today found this a "personally embarrassing incident" and proof that Americans should be concerned about his fitness for office. Why was it bad for Biden? Because everything always is.
2 notes
·
View notes
Note
Congratulations that you got the ticket to the Taylor swift concert. I am so happy for you.
Actually, this the reason why I wanted to send you an ask before seeing that post. There is some usa tiktoker who are saying things like:
"How dare she do that for Latin America, she should make them cheap for us too"
Or
Seeing comment from people from Latin America begging American to let them have a chance at seeing her in a concert and that even if the prices of those concert seem cheap to them, in reality they are not and still you would have people say "I don't care, if I can afforade it, damn well I m booking a flight to Mexico for her concert, I don't care"
I am curious to hear an opinion of local.
Hi love! I'm thankful for the opportunity, I've been a Swiftie since 2014 and this is my very first chance to see her. I'm thankful that my family can afford it for me and did the sacrifice for me. Because, maybe this is surprising for people from other countries but despite the tickets being "affordable" for us, Argentinians, its A BUNCH OF MONEY.
I understand that not everybody understand the situation, the COMPLEX economical and social situation of Argentina and it's ok. We are not the center of the universe and I do not expect all Americans to understand. TO CLARIFIED, this is not a personal attack TO ANYONE, not you, not those swifites, NOONE. This is just me, explaining how it feels FOR ME.
I'll be quick, being angry at Taylor for what she did about the prices in Latin-American is not even the minimum amount of research and sadly... highly privileged. First of all, lets start with numbers. Argentinian average salary in dollars per month is ....200$ -300$ dollars...USA is 6k$.... The tickets were around from 50 dollars more on less to 300$....an entire to 1/4 of a salary here. If she would have charged the same considering that our income is not ever CLOSE to an USA one... no one would have been able to pay it. Plus the 50$ tickets were behind the scenario, basically you would just listen to the music.
Second, the costs of the scenario, the background people, technicians etc. who will work in the stadium won't charge the same as American's staff because... simply Argentinian salaries are way lower. So the whole "cost" for her would be lower.
Third, Argentinian ticket system was just ... better. For buying you did not only need an Argentinian ID but also that ID had to be correlated to the owner of the card who was going to pay and the data of the account had to correlate to the email of the owner of the card. Basically... you needed to be Argentinian and be the owner so the reselling would be way harder. I'm sorry about all the American Swifties who suffered the insane thing that Ticketmaster was, Allaccess had to process 2 MILLION of people in queue in less than 10 HOURS and yet it worked, slowly but it did.
Finally, this is a little more personal point of view.... Argentina has over 8% of MONTHLY INFLATION... the inflation that countries who are saying to be in "a crisis" have the annual inflation that Argentina has in A MONTH. We have over 100% of ANNUAL inflation. Last huge devaluation a month ago, Supermarkets closed because they refused to sell because the prices were going up so fast that it was better not selling that selling cheap. I'm sorry that our tickets are cheaper, I'm sorry that this may be the only happiness we can have in a country were our salaries value 10% less each month. Coming from a person who had to cut half of the food tray's I was given by university to save for dinner so I could study and help my family. I'm moving aboard to be able to send money home and help my mom to finally rest and not overwork herself.
This is nothing against you or any swifties. But this is literally the meme of "Everything is for you... this tiny little thing... is for me. I'm sorry that you're not the main focus right now, just let me have this for this time,"
11 notes
·
View notes
Text
So the situation is looking bad, not as drastic but still bad as shit, just, what are we going to do
How can anyone think that selling our resources and our public stuff is going to be beneficial for the country? How could anyone think that giving less money to universities is going to be beneficial for the country? How could anyone think that inflating the cost of the dollar is beneficial for the country?
And on top of that it's the fear for our rights, four our land, the fight for less contamination is the worst and now we have people that will rule that don't believe in climate change, and will try to sell every resource and green place we have, the vice-president already said she thinks parks are a scam (parks as protected pieces of nature), the president said he thinks HUMAN RIGHTS are a scam
We have fascists as our government, I'm so worried, I am so fucking scared
We should have laws against people denying the crimes of the dictatorship, instead we have people who think THE DATA FROM ACTUAL USA AT TWO YEARS OF THE DICTATORSHIP is false ON OUR PRESIDENCY
2 notes
·
View notes
Text
To many these are just seemingly meaningless numbers, but as AEW’s Jim Ross explained on the Grilling JR podcast, these numbers are what attracts significant advertisers:
“That’s why everybody lives and dies on the 18-49 ratings,” Ross said. “A lot of people don’t understand why that number is so important to cultivate and monitor. That’s what the networks sell, their ad sales target 18-49-year-old people. That’s why the 18-49 number is so important for all advertisers.”
It's been like this for 70 years, guys. CW was always the weirdo since the Netflix deal because of the licensing games that are now defunct.
Before we jump into TV ratings, it’s important to know the different ways channels make money. While all these services gain revenue through various means, the main difference is that broadcast networks and cable (TNT, AMC, USA, etc.) profit by selling advertising space during programming while premium cable and streamers rely on subscriptions. All channels use viewer analytics to decide if a TV show is profitable and worth keeping on their schedules, but how the data is gathered and parsed depends on the platform. (...) Adults ages 18-49 are known as the key demographic because advertisers believe they have the most disposable income and least brand loyalty, which may make them more susceptible to advertising.
Even if their top partners and presidents hadn't said 18-49, which they HAVE, anyone that knows anything about the industry AT ALL would goddamn KNOW the second they said they're going to make it a profitable network like its competitors, that they were going to require 18-49. Everything else is bitter fan delusions, self consolation, and pipe dreams. It's rocking back and forth, telling themselves it'll be okay, and that after all their years of untouched privilege protected by Pedowitz's licensing game, that somehow, the world is going to conform to protect them here, too.
And. lmao no. They may COMPROMISE on something like 18-54 to give Walker a renancel but if you think they're gonna fight to keep the audience that literally makes them shit for money, you're nuts. And scaling it 18-54 actually greatly devalues the 18-49 in result, but tries to give a leg up to the past-key-demo viewership and inflate its value in exchange, so it STILL devalues that slot vs an 18-49 performer. People get older, not younger. Those people just get further and further away from demo each year. The idea of stringing Walker out beyond the generosity of a renancel is genuinely funny. They're already stretching to try to include 54. And in 2 years those people will be 56 and the 49 year olds IN demo are gonna be 51. What are they gonna do, keep compromising on their profit to keep Jared Padalecki and his 20 twitter stans happy?
8 notes
·
View notes
Text
Sunday, June 25, 2023
The World’s Empty Office Buildings Have Become a Debt Time Bomb
(Bloomberg) In New York and London, owners of gleaming office towers are walking away from their debt rather than pouring good money after bad. The landlords of downtown San Francisco’s largest mall have abandoned it. A new Hong Kong skyscraper is only a quarter leased. The creeping rot inside commercial real estate is like a dark seam running through the global economy. Even as stock markets rally and investors are hopeful that the fastest interest-rate increases in a generation will ebb, the trouble in property is set to play out for years. After a long buying binge fueled by cheap debt, owners and lenders are grappling with changes in how and where people work, shop and live in the wake of the pandemic. At the same time, higher interest rates are making it more expensive to buy or refinance buildings. A tipping point is coming: In the US alone, about $1.4 trillion of commercial real estate loans are due this year and next, according to the Mortgage Bankers Association. When the deadline arrives, owners facing large principal payments may prefer to default instead of borrowing again to pay the bill.
Inflation, health costs, partisan cooperation among the nation’s top problems
(Pew Research Center) Inflation remains the top concern for Republicans in the U.S., with 77% saying it’s a very big problem. Gun violence is the top issue for Democrats: 81% rank it as a very big problem. When it comes to policy, more Americans agree with the Republican Party than the Democratic Party on the economy, crime and immigration, while the Democratic Party holds the edge on abortion, health care and climate change.
The Brown Bag Lady serves meals and dignity to L.A.’s homeless
(USA Today) A Los Angeles woman, known affectionately as the Brown Bag Lady, is serving the city’s unhoused population with enticing meals and a sprinkle of inspiration for dessert. Jacqueline Norvell started cooking meals for people on L.A.’s Skid Row about 10 years ago in her two-bedroom apartment after getting some extra money from her Christmas pay check. She bought several turkeys and prepared all the fixings for about 70 people, driving to one of L.A.’s most high-risk areas to hand out the meals. “We just parked on a corner,” said Norvell. “And we were swarmed.” She says people were grateful and she realized the significant demand. Norvell’s been cooking tasty creations ever since. Norvell garnishes each dish with love and some words of encouragement. In addition to the nourishment, each bag or box has an inspirational quote. “We’ve got to help each other out,” she said. “We have to.”
Facing Brutal Heat, the Texas Electric Grid Has an Ally: Solar Power
(NYT) Strafed by powerful storms and superheated by a dome of hot air, Texas has been enduring a dangerous early heat wave this week that has broken temperature records and strained the state’s independent power grid. But the lights and air conditioning have stayed on across the state, in large part because of an unlikely new reality in the nation’s premier oil and gas state: Texas is fast becoming a leader in solar power. The amount of solar energy generated in Texas has doubled since the start of last year. And it is set to roughly double again by the end of next year, according to data from the Electric Reliability Council of Texas. “Solar is producing 15 percent of total energy right now,” Joshua Rhodes, a research scientist at the University of Texas at Austin, said on a sweltering day in the state capital last week, when a larger-than-usual share of power was coming from the sun. So far this year, about 7 percent of the electric power used in Texas has come from solar, and 31 percent from wind. The state’s increasing reliance on renewable energy has caused some Texas lawmakers, mindful of the reliable production and revenues from oil and gas, to worry. “It’s definitely ruffling some feathers,” Dr. Rhodes said.
Guatemalans are fed up with corruption ahead of an election that may draw many protest votes
(AP) As Guatemala prepares to elect a new president Sunday, its citizens are fed up with government corruption, on edge about crime and struggling with poverty and malnutrition—all of which drives tens of thousands out of the country each year. And for many disillusioned voters—especially those who supported three candidates who were blocked from running this year—the leading contenders at the close of campaigning Friday seem like the least likely to drive the needed changes. Guatemala’s problems are not new or unusual for the region, but their persistence is generating voter frustration. As many as 13% of eligible voters plan to cast null votes Sunday, according to a poll published by the Prensa Libre newspaper. Some of voters’ cynicism could be the result of years of unfulfilled promises and what has been seen as a weakening of democratic institutions. “The levels of democracy fell substantially, so the (next) president is going to inherit a country whose institutions are quite damaged,” said Lucas Perelló, a political scientist at Marist College in New York and expert on Central America. “We see high levels of corruption and not necessarily the political will to confront or reduce those levels.”
Chile official warns of ‘worst front in a decade’ after floods, evacuations
(Reuters) Days of heavy rainfall have swollen Chile’s rivers causing floods that blocked off roads and prompted evacuation in the center of the country, amid what has been described as the worst weather front in a decade. The flooding has led authorities to declare a “red alert” and order preventive evacuations in various towns in the south of Santiago. “This is the worst weather front we have had in 10 years,” Santiago metropolitan area governor Claudio Orego said.
Crisis in Russia
(NYT/AP) A long-running feud over the invasion of Ukraine between the Russian military and Yevgeny Prigozhin, the head of Russia’s private Wagner military group, escalated into an open confrontation. Prigozhin accused Russia of attacking his soldiers and appeared to challenge one of President Vladimir Putin’s main justifications for the war, and Russian generals in turn accused him of trying to mount a coup against Putin. Prighozin claimed he had control of Russia’s southern military headquarters in the city of Rostov-on-Don, near the front lines of the war in Ukraine where his fighters had been operating. Video showed him entering the headquarters’ courtyard. Signs of active fighting were also visible near the western Russian city of Voronezh, and convoys of Wagner troops were spotted heading toward Moscow. The Russian military scrambled to defend Russia’s capital. Then the greatest challenge to Russian President Vladimir Putin in his more than two decades in power fizzled out after Prigozhin abruptly reached a deal with the Kremlin to go into exile and sounded the retreat. Under the deal announced Saturday by Kremlin spokesman Dmitry Peskov, Prigozhin will go to neighboring Belarus. Charges against him of mounting an armed rebellion will be dropped. The government also said it would not prosecute Wagner fighters who took part, while those who did not join in were to be offered contracts by the Defense Ministry. Prigozhin ordered his troops back to their field camps in Ukraine, where they have been fighting alongside Russian regular soldiers.
In Myanmar, Birthday Wishes for Aung San Suu Kyi Lead to a Wave of Arrests
(NYT) In military-ruled Myanmar, there seemed to be a new criminal offense this week: wearing a flower in one’s hair on June 19. Pro-democracy activists say more than 130 people, most of them women, have been arrested for participating in a “flower strike” marking the birthday of Daw Aung San Suu Kyi, the civilian leader who was ousted by Myanmar’s military in a February 2021 coup. Imprisoned by the junta since then, she turned 78 on Monday. The protest—a clear, if unspoken, rebuke of the junta—drew nationwide support, and many shops were reported to have sold all their flowers. Most of the arrests occurred on Monday, but they continued through the week as the military tracked down participants and supporters. In some cities and towns, soldiers seized women in the streets for holding a flower or wearing one in their hair. Some were beaten, witnesses said. The police have also been rounding up people who took to Facebook to post a birthday greeting or a photo of themselves with a flower. Phil Robertson, the deputy Asia director for Human Rights Watch, called the campaign the latest example of the “paranoia and intolerance” of Myanmar’s military rulers.
Sweltering Beijingers turn to bean soup and cushion fans to combat heat
(Washington Post) China’s national weather forecaster issued an unconventional outlook this week: “Hot, really hot, extremely hot [melting smiley face],” it wrote Tuesday night on Weibo, China’s answer to Twitter. It was imprecise, but it wasn’t wrong. The temperature in Beijing hit 106 degrees Fahrenheit on Thursday, a public holiday for the Dragon Boat Festival. It was the highest June recording since 1961. Visiting the Great Wall was “like being in an oven,” said Lin Yun-chan, a Taiwanese graduate student on her first trip to Beijing. The heat wave is almost the only thing anyone can talk about. Much of the online discussion revolves around food. People are sharing advice about the most hydrating snacks for the hot weather: mung bean soup and sour plum drink are popular options. Entrepreneurs looked for ways to capitalize on the heat wave: One promoted a seat-cushion fan designed to combat a sweaty butt, while tourism companies touted trips to the south of the country, which is usually hotter but currently less so.
Your next medical treatment could be a healthier diet
(WSJ) Food and insurance companies are exploring ways to link health coverage to diets, increasingly positioning food as a preventive measure to protect human health and treat disease. Insurance companies and startups are developing meals tailored to help treat existing medical conditions, industry executives said, while promoting nutritious diets as a way to help ward off diet-related disease and health problems. “We know that for adults, around 45% of those who die from heart disease, Type 2 diabetes, stroke, that poor nutrition is a major contributing factor,” said Gail Boudreaux, chief executive of insurance provider Elevance Health speaking at The Wall Street Journal Global Food Forum. “Healthy food is a real opportunity.”
2 notes
·
View notes
Note
heyo i am a stats freak and got the "how is this index actually calculated?" kind of autism and noticed numbeo in your latest couple of posts so just a heads up - their data is crowd-sourced and largely not accurate! it's great at giving you a vague idea as to cost of living but it falls pretty flat in terms of more granular info like groceries and house prices. also the cost of living calculator doesn't take the purchasing power of an average salary into account, as far as i know it just compares it to new york.
if you ever want to study the relationships between quality of life and geographical location (for research or, yknow, moving out lol) then numbeo does offer a qol index which gives you a way better idea of how "good" a place is to live in, and can be used as a proxy to better estimate the actual cost and quality of living there. but it's still kind of a mess. for example, their "safety" measurement is basically irrelevant, since it's based of an arbitrary test that people online can fill out (and yes, people have flooded the dataset with negative reviews of cities inflating their crime rates. sometimes for fun sometimes for some Very Racist Reasons). the metric for healthcare is based on a form people can fill out (again, 100% anonymously, 100% online, 100% with no verification) and it combines the scores to form a "healthcare rating" - what goes into that "healthcare rating" is very subjective and largely not something a patient could even know. "friendliness and courtesy of the staff"? this doesn't even vary from hospital to hospital, this shit varies from department to department. there is no fucking way a statement like "the medical staff in all of Turin, Italy is very unfriendly" has any merit. a score for "equipment for modern diagnosis and treatment"??? compared to what? does the average patient filling out some online survey know anything about state of the art medical equipment so that they can compare it to what they've been treated with????? (the answer is no). ok, sorry, i'm just rambling now, but damn this actually is just yelp for cities and not much else.
in a brief flash of self-awareness, i've decided not to go into detail on that horrible image by geo.universe on instagram (the one where nearly all of europe is a green LOWER cost of living than the us). it'd be another unhinged rant about how they don't have a source and how you can't possibly average out a cost of living for the entire usa, where housing prices range all the way from "five bucks and a warm smile for seven acres of land in some rural state" to "$1mil and a kidney for an almost-human-sized cage in NYC".
ANYWAY jesus christ what i wanted to get to is that if you're ever considering comparing "costs" (financial and otherwise) when moving out please refer to better indices (like EIU's where-to-be-born index or CIW though they have plenty of flaws too) and remember to always compare costs (this time just financial) of living against the MEDIAN net income!!! averages are almost meaningless because of weird ghouls who make billions of dollars and act as the number-inflating Spiders Georg of money.
i'm so sorry if you read all of this. take it as psychological whump or something. it's been a long day and i had a bird fly directly into my window today and it woke me up after i tried to take a nap. i hope the bird is fine because i sur
Hey friend thanks for letting me know! I’ll check out the other metrics you mentioned (although I’m not exactly sure what CIW is? Is it Canadian index of well being or smth else?) and yeah I hope the bird is ok <333 also how do you best find like, the average cost of living/purchasing power of places? Is there a decent scale or metric or do you really just have to do a fuckton of research for everything? Cause I’m definitely willing to put in serious work and research once I have it narrowed down to a few places and once emigrating becomes a serious possible option but rn it’s just very off in the distance planning and I’m just trying to think about what would even be the best options to consider
1 note
·
View note
Text
Well Water Tank Market Share 2024 by Applications and Forecast to 2032
"Well Water Tank Market Dynamics: Growth, Trends, and Future Outlook 2024-2032"
The Well Water Tank market is expected to experience substantial growth from 2024 to 2032, fuelled by technological advancements, the expansion of digital marketing, and an increasing emphasis on data-driven decision-making. This report provides an in-depth analysis of market dynamics, focusing on key players, product types, applications, and regional growth trends. While challenges such as economic fluctuations and regulatory changes may arise, the market presents ample opportunities for innovation and strategic partnerships.
Get a sample PDF of the report at - https://www.themarketintelligence.com/enquiry/request-sample-pdf/1659
Who are the largest manufacturers of Well Water Tank Market worldwide?
Wessels Company (USA)
GRUNDFOS (Denmark)
Amtrol (USA)
Swan Group (USA)
Pentair (Ireland)
A.O. Smith (USA) (China)
The report covers a research period from 2019 to 2030, featuring extensive quantitative analysis alongside comprehensive qualitative insights. It provides an overview of the global Well Water Tank market, highlighting key metrics such as sales, revenue, and growth rate. Furthermore, the report offers segmented market analysis by region, product type, and downstream industry, giving readers a clear and detailed understanding of the market's distribution from multiple perspectives.
Get Sample Copy of Well Water Tank Market Report
Well Water Tank Market Dynamics Covers:
Well Water Tank market dynamics covers the analysis of the forces that influence the behaviours and prices in a market. These dynamics include various elements such as supply and demand fluctuations, competitor actions, market trends, and economic models, all of which contribute to the overall landscape of a given market.
Components of Market Dynamics:
Supply and Demand: The core of market dynamics lies in the relationship between supply and demand.
Market Positioning: This involves understanding where a product fits among competitors and what makes it unique.
Competitive Analysis: Analysing competitors' strengths, weaknesses, and market positions helps businesses identify opportunities and threats.
Well Water Tank market dynamics involves analysing various factors that influence market behaviours and prices. It helps businesses stay competitive, adapt to changes, optimize resources, and develop better products.
Inquire or Share Your Questions If Any Before the Purchasing This Report – https://www.themarketintelligence.com/checkout-page/1659
What are the factors driving the growth of the Well Water Tank Market?
Well Water Tank Market Segmented by Types:
Steel Water Tanks
Composite Water Tanks.
Well Water Tank Market Segmented by Applications:
Home Use
Commercial Use.
Regional Segmentation:
North America (United States, Canada and Mexico)
Europe (Germany, UK, France, Italy, Russia and Turkey etc.)
Asia-Pacific (China, Japan, Korea, India, Australia, Indonesia, Thailand, Philippines, Malaysia and Vietnam)
South America (Brazil, Argentina, Columbia etc.)
Middle East and Africa (Saudi Arabia, UAE, Egypt, Nigeria and South Africa)
Browse Full Report at: https://www.themarketintelligence.com/market-reports/well-water-tank-market-1659
Key Takeaways from the Global Well Water Tank Market Report:
Market Size Estimates: Estimation of the Well Water Tank market size in terms of value and sales volume from 2018 to 2028.
Market Trends and Dynamics: Analysis of Well Water Tank market drivers, opportunities, challenges, and risks.
Macro-economy and Regional Conflict: Impact of global inflation and the Russia-Ukraine conflict on the Well Water Tank market.
Segment Market Analysis: Well Water Tank market value and sales volume by type and application from 2018 to 2028.
Regional Market Analysis: Current situations and prospects of the Well Water Tank market in North America, Asia Pacific, Europe, Latin America, the Middle East, and Africa.
Country-level Studies on the Well Water Tank Market: Revenue and sales volume data for major countries within each region.
Well Water Tank Market Competitive Landscape and Major Players: Analysis of 10-15 leading market players, including sales, price, revenue, gross margin, product profile, and application.
Trade Flow: Import and export volumes of the Well Water Tank market in key regions.
Well Water Tank Industry Value Chain: Overview of raw materials and suppliers, manufacturing processes, distributors, and downstream customers in the Well Water Tank market.
Well Water Tank Industry News, Policies, and Regulations: Updates on relevant industry news, policies, and regulations.
Reasons to Purchase This Report:
Comprehensive Analysis: Gain access to extensive quantitative and qualitative analysis covering a research period from 2019 to 2030.
Market Overview: Understand the global Well Water Tank market through detailed metrics on sales, revenue, and growth rates.
Segmented Insights: Benefit from segmented market analysis by region, product type, and downstream industry for a nuanced understanding of market distribution.
Competitive Landscape: Stay ahead with insights into the competitive landscape, including key players and their market strategies.
Future Prospects: Make informed decisions with projections and future market prospects.
Regional Analysis: Gain insights into regional growth trends and market status.
Emerging Trends: Identify and understand emerging market trends and opportunities.
Strategic Planning: Utilize the report’s insights for strategic planning and market positioning.
0 notes
Text
Forex Trading
Forex trading, or foreign exchange trading, involves buying and selling currencies to profit from changes in exchange rates. Here’s a detailed guide to get you started:
1. Understanding Forex Trading
Currency Pairs: Forex trading always involves trading one currency for another. Currencies are quoted in pairs (e.g., EUR/USD, GBP/JPY). The first currency is the base currency, and the second is the quote currency.
Pips: The smallest unit of movement in a currency pair’s exchange rate. For most pairs, a pip is 0.0001.
Leverage: Allows you to control a large position with a relatively small amount of money. While leverage can amplify profits, it also increases risk.
2. Setting Up Your Forex Trading
Choose a Reliable Broker: Select a forex broker that offers a user-friendly trading platform, competitive spreads, and good customer service. Look for brokers with a solid reputation and proper regulatory oversight (e.g., regulated by the Financial Conduct Authority (FCA) or the Commodity Futures Trading Commission (CFTC)).
Open a Trading Account: After selecting a broker, open a trading account. Many brokers offer demo accounts where you can practice trading without real money.
Deposit Funds: Fund your trading account with an amount you’re comfortable with. Remember, forex trading can be risky, so only invest money you can afford to lose.
3. Develop a Trading Strategy
Technical Analysis: Uses historical price data and charts to forecast future price movements. Key tools include indicators (like Moving Averages, RSI, MACD) and chart patterns (like head and shoulders, flags).
Fundamental Analysis: Involves analyzing economic indicators, news events, and other factors that might impact currency values. Key indicators include GDP, interest rates, inflation, and employment data.
Risk Management: Set stop-loss and take-profit orders to manage risk and protect your capital. Determine how much you’re willing to risk on each trade.
4. Executing Trades
Place Orders: Use your broker’s trading platform to place trades. You can choose from various order types, such as market orders, limit orders, and stop orders.
Monitor and Adjust: Keep track of your trades and the market conditions. Adjust your strategies and positions as needed based on market movements and your trading plan.
5. Continuous Learning and Improvement
Stay Informed: Follow financial news, economic reports, and market analyses to stay up-to-date with factors affecting currency markets.
Review and Reflect: Regularly review your trades to understand what worked and what didn’t. Learning from past trades helps improve your strategy.
Adapt: Forex markets are dynamic and can change quickly. Be ready to adapt your strategies to new market conditions.
6. Avoiding Common Pitfalls
Overleveraging: Using high leverage can lead to significant losses. Start with lower leverage until you gain more experience.
Emotional Trading: Avoid making decisions based on emotions. Stick to your trading plan and strategy.
Lack of Research: Ensure you conduct thorough research and analysis before making trading decisions.
Resources for Learning Forex Trading
Books: “Trading in the Zone” by Mark Douglas, “Currency Trading for Dummies” by Brian Dolan and Kathleen Brooks.
Online Courses: Platforms like Coursera, Udemy, and Babypips offer courses on forex trading.
Websites: Follow financial news on websites like Bloomberg, CNBC, and Reuters.
business, forex, art, usbiz, usa art, fine art, trading, forex trading
1 note
·
View note
Text
American Inflation Vs Recession
Equities is having a rout after worse than expected consumption and payroll numbers in the USA. Is a recession on the cards? No one knows.
The Fed is trying to tame inflation without killing the macroeconomy and the latest data continues to add to the evidence and confidence that inflation is approaching their long run 2% target. Apparently, many traders are also unwinding their carry trades.

The SPY also gapped down to open at $510 and price explored upwards to $523 and closed at $517 (which was also the day's VWAP I think) on Monday. There is still a daily trading gap between $525 and $528 which we may see being explored today.
The current level of ~$515 has been well accepted over many months in 2024 so maybe we will see it hold and selling and buying come into equilibrium. Only time will tell if this is the case over the next few days and weeks.
The next level down would be $500, which is the 200 day SMA as well as a key psychological level.
I think there will be volatility as the market awaits further information about the macroeconomy and inflation and carry trades are unwinded but it is really not doomsday at all.
0 notes
Text
2-Ethylhexanol Prices Trend | Pricing | Database | Index | News | Chart

North America
In the first quarter of 2024, the North American 2-Ethylhexanol (2-EH) market exhibited a bullish trend, with prices increasing by approximately 30%. This surge was driven by cost-side support, as major oxo-alcohol producers like Eastman Chemicals and OQ Chemicals implemented multiple price hikes throughout the quarter.
Improved weather conditions from mid-February boosted the downstream construction and automotive sectors, supporting 2-EH prices. Following the Arctic Blast in January, the US construction sector showed significant improvement. Automotive sales in the US also soared, increasing by 31%, which fueled demand from the downstream plasticizer industry. The construction sector's growth, driven by upturns in residential construction, commercial building, and civil engineering activities, further bolstered the market.
As the home-buying season approached, existing inventories of 2-EH faced increasing pressure. Stable mortgage rates contributed to a positive outlook among prospective homebuyers, adding further strain on the downstream plasticizer sector. Midway through the quarter, supply conditions became uncertain when OQ Chemicals declared a force majeure at its Oberhausen site in Germany, threatening 2-EH supply dynamics. Additionally, operational disruptions at several plants in Texas, including LyondellBasell in Corpus Christi, Shell Chemical in Deer Park, Dow Chemical in Freeport, and Enterprise Product in Mount Belvieu, led to a shortage in feedstock Propylene (Refinery Grade), subsequently increasing 2-EH prices.
Get Real Time Prices for 2-Ethylhexanol (2-EH): https://www.chemanalyst.com/Pricing-data/2-ethyl-hexanol-2-eh-8
Asia
The Asian 2-EH market faced a bearish situation throughout the first quarter of 2024, primarily due to reduced demand from the downstream plasticizer industry. This decline was largely attributed to the underperformance of the Chinese construction sector, where investment sentiments remained low. The end of the peak festive season, the Chinese Lunar New Year, led to destocking activities that increased product supply, compelling prices to fall. Challenging weather conditions in Shandong further slowed product circulation.
Price hikes initiated by major oxo-alcohol producers like OQ Chemicals and Eastman Chemicals had no significant effect on Asian prices. Low demand from the crisis-stricken Chinese construction industry, where many projects were postponed or halted, prompted a 20% price drop by the end of the quarter. Midway through the quarter, supply conditions were uncertain as OQ Chemicals declared a force majeure at its Oberhausen site, impacting 2-EH supply dynamics.
Europe
In the first quarter of 2024, European 2-EH prices inflated by over 50%. This increase was largely due to the ongoing crisis in the Red Sea, which led to a shortage of feedstock Propylene. Plant shutdowns in Europe and the USA, from where Europe imports Propylene, exacerbated this shortage. On February 27, 2024, OQ Chemicals declared a force majeure at their Oberhausen site in Germany, further restricting 2-EH supply.
Feedstock Propylene prices increased by approximately 35%, driving up production costs. However, demand from the European 2-EH market remained weak, particularly in the construction sector. All segments of the construction industry—housebuilding, commercial construction, and civil engineering—experienced significant contractions. The housebuilding segment, in particular, dragged down the sector as house prices and permits continued to decline. The only support for 2-EH demand came from the secondary automotive sector, which saw substantial improvements towards the end of the quarter.
Get Real Time Prices for 2-Ethylhexanol (2-EH): https://www.chemanalyst.com/Pricing-data/2-ethyl-hexanol-2-eh-8
Contact Us:
ChemAnalyst
GmbH - S-01, 2.floor, Subbelrather Straße,
15a Cologne, 50823, Germany
Call: +49-221-6505-8833
Email: [email protected]
Website: https://www.chemanalyst.com
#2-Ethylhexanol#2-Ethylhexanol Price#2-Ethylhexanol Prices#2-Ethylhexanol News#2-Ethylhexanol Market#2-Ethylhexanol Pricing
0 notes
Text
The Benefits of Outsourcing Mobile App Development to India
Let’s start this blog off with a pretty simple question- Why do we need Mobile Apps? We can’t delve into why we should be outsourcing mobile app development , or the benefits of hiring Indian app developers, without first discussing this question.
Mobile apps are simple. They are intuitive, user-friendly, and a lot of them are positively addictive. Companies have noticed how helpful these apps have become, from reaching a wide audience, brand awareness, and improving engagement, to eventually driving sales.
Businesses have thus turned toward mobile apps for scaling up their operations, and to bring them prospective customers. Unfortunately, a lot of businesses do not have a team that would be able to ideate, implement & develop, test, and launch the mobile apps. They also lack the time and budget to hire in-house teams to work around such a project.
Benefits Of Outsourcing Mobile App Development
To put it simply- hiring mobile app developers in India is convenient, inexpensive, and provides a guarantee of app quality. Why? Because of the following reasons of course!
1. Cost Effectiveness:
As discussed previously, in-house teams inflate development costs by factoring in expenses of recruiting, software architecture consulting, and any other training-related costs. Indian mobile app developers provide quality apps and cost-effective app development, making it a strong contender among developers from various countries. Lower costs of living and numerous outsourcing options in India have made way for significant cost savings in software development.
2. Dependable (Timely Delivery) & Quality App Development
Indian app development companies have built their reputations around providing dedicated app development services and timely project delivery. Quality assurance in Indian app development is something they are particularly concerned with. Top mobile app development companies commit to excellence and adhere to industry best practices and global standards.
3. Highly Skilled Developers
A report by the Progressive Policy Institute (PPI) cites that India will overtake the USA as the world’s largest developer population center by 2024. Its large talent pool of developers has a strong sense of accountability and ownership and builds both native (iOS & Android) and cross-platform apps faster and more efficiently. It is pretty crucial that your mobile app is usable and performs well across countries, so the impact of skilled Indian developers on global markets is established.
4. Utilizing Latest Tech & Tools
India’s emphasis on continuous learning and improvement allows developers to be informed and well-equipped with the best mobile app development technologies and tools. The demands of the world are ever-growing, thus it is essential that developers need their wits about them. Indian developers have access to and are well-versed in technologies like artificial intelligence, machine learning, IoT, blockchain, and big data, to name a few.
5. Flexible Engagement, Communication & Time Zones:
One might think otherwise, but there are a lot of advantages of time zone differences in outsourcing to India. And with the added advantage of the fact that India has one of the largest English-speaking populations in the world, managing work becomes simpler and more efficient. App development companies in India utilize various communication strategies for offshore development and outsource their developers and teams to work alongside the client’s work schedules. Thus projects get completed at a much faster pace. And you can choose between the various engagement models that are offered by Indian app development companies.
6. IT-Friendly Policies
India has a flourishing IT sector, with a skilled workforce and government policies. This makes it an appealing option for foreign companies looking to outsource mobile app development. There are various benefits like data security, control over cybercrime, and continuous project support which is backed by government policies. Despite the privacy concerns, India provides a safe and dependable environment for app development.
7. Numerous Outsourcing Options
Indian companies have understood the importance of IT outsourcing, and are deciding to somehow bridge the demand gap. And since a lot of businesses have sprung up on that action, foreign companies have a lot of options to choose their team/ developer from. The Agile development in offshore settings further makes sure of the adaptability and smooth project implementation.
8. Domain Expertise
By hiring Indian mobile app developers, you can get guaranteed insights into the domain they are working in, as app development and IT outsourcing companies work across diverse verticals, procuring the know-how of the industry. So when they craft industry-specific products, it will be easier with the knowledge of challenges and requirements the industry poses.
Medium, an online publishing platform, notes that US developers earn three times more than their Indian counterparts. But be assured that Indian developers aren’t underpaid and overworked, there is just a high disparity in the cost of living between the two nations.

Conclusion
Outsourcing mobile app development is not just helpful, but it’s highly beneficial for your business. It can be briefly defined in a few words: Cost-efficient, skilled developer pool, safe and quality development. Keep in mind the challenges in outsourcing before you choose to hire developers in India from reputed companies.
Originally Published Soft Suave Technology on 04 July 2024.
#hire mobile app developers#mobile app development#hire app developer#hire remote app developers#outsourcing#outsourcing mobile app development
0 notes
Last Seen Blogs

the-blue-paladin
Razzle Dazzle

sagittariuskittyworld
I just wants fun!

sagekarneval
보고싶어

are-toto
ARETOTO

caledfych
cal's fic dumping ground