#power bi dataflows
Explore tagged Tumblr posts
Visit Tumblr Blog
Explore Tumblr blogs with no restrictions, modern design and the best experience.
Last Seen Tumblr Blogs


Fun Fact
There are dozens of funny blogs to kill time on Tumblr.
Text
[Fabric] Integración de datos al OneLake
Ya viste todos los videos con lo que Fabric puede hacer y queres comenzar por algo. Ya leiste nuestro post sobre Onelake y como funciona. Lo siguiente es la ingesta de datos.
En este artículos vamos a ver muchas formas y opciones que pueden ser usadas para añadir datos a onelake. No vamos a ver la profundidad de como usar cada método, sino una introducción a ellos que nos permita elegir. Para que cada quien haga una instrospección de la forma deseada.
Si aún tenes dudas sobre como funciona el Onelake o que es todo eso que apareció cuando intentaste crear uno, pasa por este post para informarte.
Ingesta de datos
Agregar datos al Onelake no es una tarea difícil pero si analítica puesto que no se debe tomar a la ligera por la gran cantidad de formas disponibles. Algunas serán a puro click click click, otras con más o menos flexibilidad en transformaciones de datos, otras con muchos conectores o tal vez con versatilidad de destino. Cada forma tiene su ventaja y posibilidad, incluso puede que haya varias con la que ya tengan familiaridad.
Antes de iniciar los métodos repasemos que para usar nuestro Onelake primero hay que crear una Lakehouse dentro de un Workspace. Ese Lakehouse (almacenado en onelake) tiene dos carpetas fundamentales, Files y Tables. En Files encontrabamos el tradicional filesystem donde podemos construir una estructura de carpetas y archivos de datos organizados por medallones. En Tables esta nuestro spark catalog, el metastore que puede ser leído por endpoint.

Nuestra ingesta de datos tendrá como destino una de estos dos espacios. Files o Tables.
Métodos
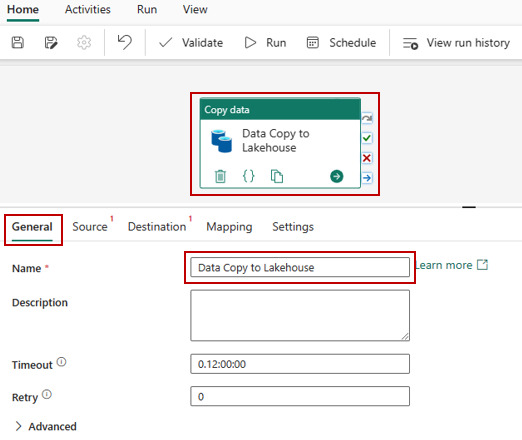
Data Factory Pipelines (dentro de Fabric o Azure): la herramienta clásica de Azure podría ser usada como siempre lo fue para este escenario. Sin embargo, hay que admitir que usarla dentro de Fabric tiene sus ventajas. El servicio tiene para crear "Pipelines". Como ventaja no sería necesario hacer configurationes como linked services, con delimitar la forma de conexión al origen y seleccionar destino bastaría. Por defecto sugiere como destino a Lakehouse y Warehouse dentro de Fabric. Podemos comodamente usar su actividad estrella "Copy Data". Al momento de determinar el destino podremos tambien elegir si serán archivos en Files y de que extensión (csv, parquet, etc). Así mismo si determinamos almacenarlo en Tables, automáticamente guardará una delta table.
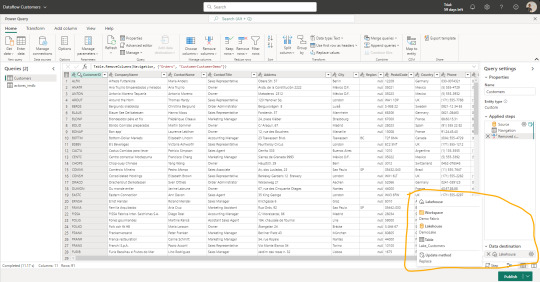
Data Factory Dataflows Gen2: una nueva incorporación al servicio de Data Factory dentro de Fabric son los Dataflows de Power Query online. A diferencia de su primera versión esta nueva generación tiene fuertes prestaciones de staging para mejor procesamiento, transformación y merge de datos junto a la determinación del destino. Así mismo, la selección del destino nos permite determinar si lo que vamos a ingestar debería reemplazar la tabla destino existente o hacer un append que agregue filas debajo. Como ventaja esta forma tiene la mayor cantidad de conectores de origen y capacidades de transformación de datos. Su gran desventaja por el momento es que solo puede ingestar dentro de "Tables" de Lakehouse bajo formato delta table. Mientras este preview también crea unos elementos de staging en el workspace que no deberíamos tocar. En un futuro serán caja negra y no los veremos.
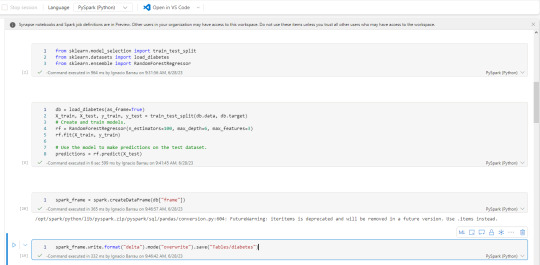
Notebooks: el hecho de tener un path a nuestro onelake, path al filesystem con permisos de escritura, hace que nuestro almacenamiento pueda ser accedido por código. El caso más frecuente para trabajarlo sería con databricks que, indudablemente, se convirtió en la capa de procesamiento más popular de todas. Hay artículos oficiales de la integración. En caso de querer usar los notebooks de fabric también son muy buenos y cómodos. Éstos tienen ventajas como clickear en files o tablas que nos genere código de lectura automáticamente. También tiene integrada la herramienta Data Wrangler de transformación de datos. Además cuenta con una muy interesante integración con Visual Studio code que pienso podría integrarse a GitHub copilot.
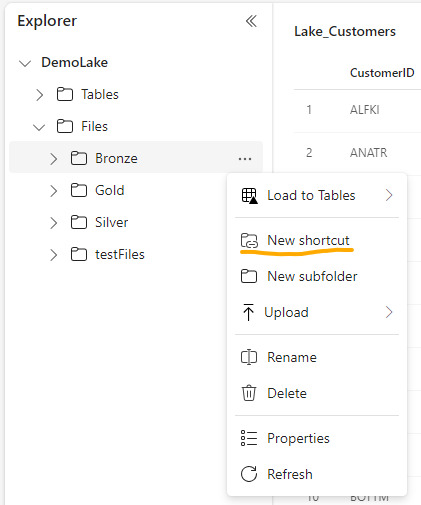
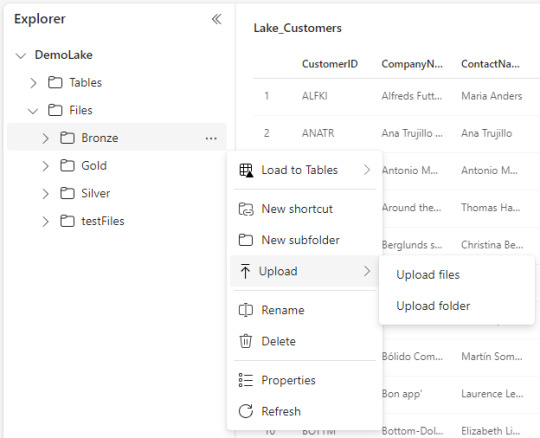
Shortcuts (accesos directos): esta nueva opción permite a los usuarios hacer referencia a datos sin copiarlos. Genera un puntero a archivos de datos de otro lakehouse del onelake, ADLS Gen2 o AWS S3 para tenerlo disponible como lectura en nuestro Lakehouse. Nos ayuda a reducir los data silos evitando replicación de datos, sino punteros de lectura para generar nuevas tablas transformadas o simplemente lectura para construcción de un modelo o lo que fuere. Basta con clickear en donde lo queremos (tables o files) y agregarlo.
Upload manual: con la vista en el explorador de archivos (Files) como si fuera un Azure Storage explorer. Tenemos la clásica posibilidad de simplemente agregar archivos locales manualmente. Esta posibilidad solo estaría disponible para el apartado de Files.
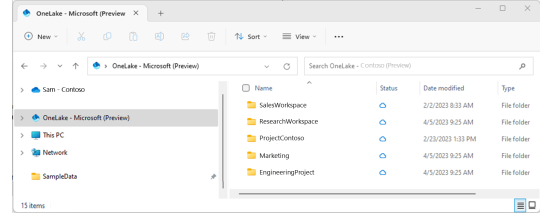
Explorador de archivos Onelake (file explorer): una de las opciones más atractivas en mi opinión es este cliente para windows. Es incontable la cantidad de soluciones de datos que conllevan ingresos manuales de hojas de cálculo de distintas marcas en distintas nubes. Todas son complicadas de obtener y depositar en lake. Esta opción solucionaría ese problema y daría una velocidad impensada. El cliente de windows nos permite sincronizar un workspace/lakehouse que hayan compartido con nosotros como si fuera un Onedrive o Sharepoint. Nunca hubo una ingesta más simple para usuarios de negocio como ésta que a su vez nos permita ya tener disponible y cómodamente habilitado el RAW del archivo para trabajarlo en Fabric. Usuarios de negocio o ajenos a la tecnología podrían trabajar con su excel cómodos locales y los expertos en data tenerlo a mano. Link al cliente.
Conclusión
Como pudieron apreciar tenemos muchas formas de dar inicio a la carga del onelake. Seguramente van a aparecer más formas de cargarlo. Hoy yo elegí destacar éstas que son las que vinieron sugeridas e integradas a la solución de Fabic porque también serán las formas que tendrán integrados Copilot cuando llegue el momento. Seguramente los pipelines y notebooks de Fabric serán sumamente poderosos el día que integren copilot para repensar si estamos haciendo esas operaciones en otra parte. Espero que les haya servido y pronto comiencen a probar esta tecnología.
#fabric#fabric tutorial#fabric tips#fabric training#data fabric#data engineer#data engineering#microsoft fabric#fabric argentina#fabric jujuy#fabric cordoba#ladataweb#power query#power query online#powerbi#power bi#power bi dataflows#data factory#data factory data flows#power bi service
0 notes
Text
Mastering Dataflow Gen2 In Microsoft Fabric (part 2)
Data transformations are an important part of any #Lakehouse project, and with #Dataflow Gen2 In Microsoft Fabric, you can start building your transformation pipelines without much training, using an easy graphical interface. In this tutorial, I explain how to apply aggregations,de-duplications and pivoting/unpivoting transformations in Dataflow Gen2. Check out here:https://youtu.be/0upqIqKlpDk
0 notes
Text
Datanets for AI Development: A Guide to Selecting the Right Data Architecture
Discover the key considerations for selecting the right data architecture for AI development in our guide to Datanets.

In the world of AI development, data is the cornerstone. From training machine learning models to powering predictive analytics, high-quality and well-structured data is essential for building intelligent AI systems. However, as the volume and variety of data continue to grow, businesses face the challenge of selecting the right data architecture one that not only supports efficient data collection, processing, and storage, but also aligns with AI development goals.
Datanets the interconnected networks of data sources and storage systems play a crucial role in modern AI projects. These data architectures streamline data access, integration, and analysis, making it easier to extract valuable insights and build scalable AI models.
This guide will walk you through datanets for AI development and help you make informed decisions when selecting the ideal data architecture for your AI-driven projects.
What Are Datanets in AI Development?
Datanets refer to interconnected data sources, data storage systems, data pipelines, and data integration tools that work together to collect, process, store, and analyze large volumes of data efficiently. These data networks facilitate data flow across multiple platforms—whether cloud-based environments or on-premises systems—making it possible to access diverse datasets in real-time for AI model training and predictive analysis.
In AI development, datanets help in centralizing and streamlining data processes, which is vital for developing machine learning models, optimizing algorithms, and extracting actionable insights.
Key Components of a DataNet for AI
A datanet consists of several key components that work together to create a robust data architecture for AI development. These components include:
Data Sources: Structured (databases, spreadsheets), unstructured (images, videos, audio), and semi-structured (JSON, XML)
Data Storage: Cloud storage (AWS S3, Azure Blob Storage), distributed storage systems (HDFS, BigQuery)
Data Processing: Data pipelines (Apache Kafka, AWS Data Pipeline), data streaming (Apache Flink, Google Dataflow)
Data Integration Tools: ETL (Extract, Transform, Load) tools (Talend, Informatica), data integration platforms (Fivetran, Apache NiFi)
Data Analytics and Visualization: Data analysis tools (Tableau, Power BI), AI models (TensorFlow, PyTorch)
Benefits of Using Datanets in AI Development
Datanets offer several benefits that are critical for successful AI development. These advantages help businesses streamline data workflows, increase data accessibility, and improve model performance:
Efficient Data Flow: Datanets enable seamless data movement across multiple sources and systems, ensuring smooth data integration.
Scalability: Datanets are designed to scale with the growing data needs of AI projects, handling large volumes of data efficiently.
Real-Time Data Access: Datanets provide real-time data access for machine learning models, allowing instantaneous data analysis and decision-making.
Enhanced Data Quality: Datanets include data cleaning and transformation processes, which help improve data accuracy and model training quality.
Cost Efficiency: Datanets optimize data storage and processing, reducing the need for excessive human intervention and expensive infrastructure.
Collaboration: Datanets enable collaboration between teams by sharing datasets across different departments or geographical locations.
Factors to Consider When Selecting the Right Data Architecture
When selecting the right data architecture for AI development, several key factors must be taken into account to ensure the data net is optimized for AI. Here are the most important considerations:
Data Volume and Variety: AI models thrive on large and diverse datasets. The data architecture must handle big data, multi-source integration, and real-time data updates.
Data Integration and Accessibility: The data architecture should facilitate easy data access across multiple systems and applications—whether cloud-based, on-premises, or hybrid.
Scalability and Performance: An ideal data architecture should scale with growing data demands while ensuring high performance in processing and storage.
Security and Compliance: Data security and regulatory compliance (GDPR, CCPA, HIPAA) are critical factors in selecting a data architecture for AI-driven insights.
Data Quality and Cleaning: Data quality is essential for accurate model training. A good data architecture should incorporate data cleaning and transformation tools.
Best Practices for Designing a DataNet for AI Development
Designing an efficient DataNet for AI development involves best practices that ensure data flow optimization and model accuracy. Here are some key strategies:
Use a Centralized Data Repository: Create a central hub where all data is stored and accessible.
Implement Data Pipelines: Build data pipelines to automate data ingestion, transformation, and processing.
Leverage Cloud Infrastructure: Utilize cloud-based storage and computing for scalability and cost efficiency.
Ensure Data Quality Control: Incorporate data cleaning tools and validation processes to improve data accuracy.
Optimize for Real-Time Access: Design your data architecture for real-time data access and analysis.
Monitor Data Usage: Regularly monitor data access, integrity, and usage to ensure compliance and performance.
The Future of Data Architecture in AI Development
As AI technology advances, data architecture will continue to evolve. Future trends will focus on more decentralized data ecosystems, enhanced data interoperability, and increased use of AI-driven data insights. The integration of blockchain with AI for data security and trust will also gain prominence.
Conclusion
Selecting the right data architecture—using datanets—is crucial for successful AI development. It ensures efficient data integration, scalability, security, and accuracy in model training. By following best practices, addressing common challenges, and considering key factors, businesses can create a robust data architecture that supports their AI projects and drives business success.
As AI technologies evolve, datanets will remain a key component in scalable data management and intelligent decision-making. Whether it’s collecting large datasets, integrating data sources, or optimizing workflows, a well-designed DataNet is the foundation for leveraging AI to its fullest potential.
1 note
·
View note
Text

Unlock the Power of Your Data: 7 Secrets Microsoft Power BI Consultants Don’t Want You to Know
Have you ever felt like you're sitting on a goldmine of data, but all you have is a rusty shovel and a faded map? That's the reality for many businesses today. They're swimming in information, yet struggle to extract the insights that could propel them forward. Microsoft Power BI offers the promise of transforming raw numbers into actionable intelligence. But what if we told you there are some hidden strategies, the kind that often remain locked away within the toolkits of seasoned consultants?
7 Secrets Microsoft Power BI Consultants Don’t Want You to Know
1. The Art of the Data Model: It’s More Than Just Connecting Tables
2. Embrace DAX Like a Native Speaker
3. Storytelling Over Graphs: Crafting Compelling Narratives
4. Performance Optimization: The Devil is in the Details
5. Power Query: Your Secret Weapon for Data Munging
6. Go Beyond the Dashboard: Interactive Exploration
7. The Power of Community: Never Stop Learning
This isn't about throwing shade at the excellent work Microsoft Power BI consultants do—rather, it’s about empowering you to take control and maximize your Power BI investment. Here are 7 secrets they might not explicitly spell out, designed to help you unlock the full potential of your data:
1. The Art of the Data Model: It’s More Than Just Connecting Tables
Many users focus solely on creating visualizations, neglecting the backbone of any great Power BI report: the data model. A poorly structured model, while seemingly functional at first, can lead to performance issues, inaccurate calculations, and general frustration down the line. Secret: spend ample time designing your model carefully, understand your relationships, and think about the most efficient way to join your tables. Learn how to leverage DAX functions like CALCULATE properly for optimized measures.
2. Embrace DAX Like a Native Speaker
DAX (Data Analysis Expressions) is the language of Power BI, and while many beginner tutorials cover the basics, true mastery is required to unlock advanced analysis. Don’t just rely on the built-in calculation tools. Secret: invest in learning DAX properly. Understand context, filter propagation, and the power of functions like FILTER, ALL, and EARLIER. This will dramatically improve the performance of your reports and allow you to perform more complex analysis.
3. Storytelling Over Graphs: Crafting Compelling Narratives
Visualizations are powerful, but ultimately, they are just tools to communicate insights. The goal shouldn't be about creating the most visually stimulating chart, but about crafting a cohesive data story. Secret: before building reports, think about the main messages you want to convey. Guide the reader through your data. Think of your reports as a visual presentation that unfolds a story. Don't just throw graphs onto a page; create a flow. Consider using tooltips and drill downs to add detail without overwhelming the user.
4. Performance Optimization: The Devil is in the Details
Slow loading reports are a common source of headache. Secret: look under the hood. Are your datasets too large? Are you using the most efficient data types? Are your measures optimized for performance? Consider using storage mode that best matches your data requirements: import for fast load times or DirectQuery when live data is needed.
Read More: Discover How Power BI Consulting Can Change Everything
5. Power Query: Your Secret Weapon for Data Munging
Power Query is often seen as an add-on, but it should be a key part of your Power BI workflow. Secret: Don’t import messy data directly. Instead, use Power Query to clean, transform, and shape your data before it ever hits your model. This will not only prevent headaches down the line, but also significantly reduce your data model size and improve overall performance. For optimal data management, consider Microsoft power bi services such as dataflows.
6. Go Beyond the Dashboard: Interactive Exploration
While dashboards are great for at-a-glance information, Microsoft power bi expert users know that the real magic happens when users can dive deep and explore the data themselves. Secret: implement interactive features like slicers, cross-filtering, and drill-throughs to empower users to explore the data on their own terms. This will make insights more personalized and valuable.
7. The Power of Community: Never Stop Learning
Power BI is constantly evolving, and staying on top of the latest features can be challenging. Secret: engage with the Power BI community. There are countless forums, blogs, and online resources where you can learn from others, troubleshoot issues, and stay up-to-date on the newest features. A Microsoft Power BI consultant may not always tell you the easiest way is through collective learning. Leverage the Power BI community.
Conclusion:
Power BI is an incredibly powerful business intelligence tool, but only if you know how to use it effectively. By embracing these 7 secrets (which many consultants might not explicitly disclose), you can unlock hidden insights and drive more informed decisions.
Are you looking to fully leverage the power of your data with Microsoft Power BI? If you need help transforming your data into actionable insights, consider partnering with a team of experts. Inkey Solutions, for instance, offers comprehensive Microsoft Power BI consulting services, helping businesses of all sizes implement and optimize their data analytics strategies. Contact us today to discuss how we can assist you in achieving your business goals through the power of data.
#How much does a Power BI consultant cost#Power BI technique#Best uses for Power BI#Power BI tips and tricks for end users#Things to know about Power BI#What can you do with Power BI#Power BI cool features#Power BI create help page#Microsoft Power BI consulting#Microsoft power bi services#Microsoft power bi consultant#Microsoft power bi expert#Inkey Solutions
0 notes
Text
The Future of Power BI: Emerging Trends and Predictions for 2025

As data-driven decision-making becomes the backbone of modern businesses, Power BI stands at the forefront of business intelligence tools that transform raw data into actionable insights. Power BI’s evolution is making it indispensable for companies aiming to gain a competitive edge through data analytics. Here, GVT Academy explores the exciting trends and future predictions for Power BI in 2025, highlighting how our Power BI course equips learners to thrive in this fast-changing landscape.
1. Advanced AI and Machine Learning Features in Power BI
In 2025, Power BI will become increasingly AI-integrated, allowing users to gain deeper insights with minimal manual analysis. AI capabilities, such as automated machine learning models, natural language queries, and AI-powered insights, are anticipated to expand. These advancements will allow Power BI users to forecast trends, uncover complex patterns, and identify anomalies with unprecedented ease.
For businesses, this means the ability to make data-driven predictions faster and more accurately. For Power BI practitioners, the demand will grow for skills in AI and machine learning to leverage these tools effectively. At GVT Academy, our Power BI course emphasizes AI integration, ensuring students understand how to apply these predictive tools to real-world scenarios.
2. Real-Time Data Processing and Advanced Streaming Analytics
With the digital landscape constantly evolving, the importance of real-time data analytics is paramount. By 2025, Power BI’s capabilities for handling real-time data and advanced streaming analytics will be more robust and flexible. Companies will rely on Power BI to monitor real-time data streams across industries such as retail, healthcare, and finance. From tracking inventory and monitoring patient health metrics to analyzing financial transactions as they happen, real-time capabilities will drive fast, informed decisions.
GVT Academy’s Power BI course delves into setting up real-time dashboards, configuring dataflows, and using direct query options. Our course ensures that students gain hands-on experience in creating live dashboards, preparing them for in-demand roles in dynamic industries.
3. Seamless Cloud Integration and Enhanced Data Connectivity
By 2025, Power BI will likely strengthen its integration with cloud platforms, especially within the Microsoft ecosystem, including Azure and Microsoft 365. Enhanced connectivity to third-party data sources will streamline cross-platform data analytics, reducing the need for time-consuming data migration. This trend positions Power BI as a unifying analytics platform, helping organizations break down data silos and gain a comprehensive view of their operations.
At GVT Academy, we equip students with a deep understanding of Power BI’s connectivity tools, teaching them how to connect and transform data from various sources into a unified dashboard. This capability is essential for those working in environments with diverse data sources and cloud-based infrastructures.
4. Enhanced Focus on Secure Data Management and Compliance
As data privacy regulations tighten globally, the importance of robust data governance and security within Power BI will continue to grow. By 2025, we anticipate Power BI introducing more advanced security features, including data encryption, enhanced access controls, and compliance monitoring tools. These measures will make Power BI a trusted tool for industries that deal with sensitive data, such as healthcare, finance, and government.
GVT Academy’s Power BI course covers essential data governance practices, including setting up row-level security, managing permissions, and understanding compliance requirements. This ensures our graduates are prepared to build secure and compliant reports, a crucial skill for Power BI professionals in regulated industries.
5. User-Friendly Enhancements for Self-Service Analytics
The democratization of data is a key trend, and by 2025, Power BI will likely offer even more user-friendly tools that empower non-technical users. Enhancements in visual customization, natural language queries, and template-driven reporting will make Power BI accessible to all team members, not just data professionals. Self-service analytics will enable employees at all levels to make data-informed decisions, which drives organizational agility and innovation.
At GVT Academy, we understand the importance of accessibility. Our Power BI course includes a focus on self-service analytics, enabling students to build intuitive, user-friendly dashboards that even non-technical users can navigate with ease.
Why Choose GVT Academy’s Power BI Course?
GVT Academy’s Power BI course is designed to keep pace with the latest industry trends, providing a well-rounded curriculum that prepares students for a future in data analytics. Our instructors bring industry expertise, and our practical, hands-on approach ensures students graduate with the skills to build impactful, secure, and future-ready Power BI solutions.
Enrolling in GVT Academy’s Power BI course gives you a solid foundation in today’s Power BI environment and a forward-looking skillset for 2025 and beyond.
0 notes
Text
Optimizing Power BI Dashboards for Real-Time Data Insights
Today, having access to real-time data is crucial for organizations to stay ahead of the competition. Power BI, a powerful business intelligence tool, allows businesses to create dynamic, real-time dashboards that provide immediate insights for informed decision-making. But how can you ensure your Power BI dashboards are optimized for real-time data insights? Let’s explore some key strategies.
1. Enable Real-Time Data Feeds
You'll need to integrate live data sources to get started with real-time data in Power BI. Power BI supports streaming datasets, which allow data to be pushed into the dashboard in real time. Ensure your data sources are properly configured for live streaming, such as APIs, IoT devices, or real-time databases. Power BI provides three types of real-time datasets:
Push datasets
Streaming datasets
PubNub datasets
Each serves different use cases, so selecting the appropriate one is key to a smooth real-time experience.
2. Utilize DirectQuery for Up-to-Date Data
When real-time reporting is critical, leveraging DirectQuery mode in Power BI can be a game-changer. DirectQuery allows Power BI to pull data directly from your database without needing to import it. This ensures that the data displayed in your dashboard is always up-to-date. However, ensure your data source can handle the performance load that comes with querying large datasets directly.
3. Set Up Data Alerts for Timely Notifications
Data alerts in Power BI enable you to monitor important metrics automatically. When certain thresholds are met or exceeded, Power BI can trigger alerts, notifying stakeholders in real time. These alerts can be set up on tiles pinned from reports with gauge, KPI, and card visuals. By configuring alerts, you ensure immediate attention is given to critical changes in your data, enabling faster response times.
4. Optimize Dashboard Performance
To make real-time insights more actionable, ensure your dashboards are optimized for performance. Consider the following best practices:
Limit visual complexity: Use fewer visuals to reduce rendering time.
Use aggregation: Rather than showing detailed data, use summarized views for quicker insights.
Leverage custom visuals: If native visuals are slow, explore Power BI’s marketplace for optimized custom visuals.
5. Utilize Power BI Dataflows for Data Preparation
Data preparation can sometimes be the bottleneck in providing real-time insights. Power BI Dataflows help streamline the ETL (Extract, Transform, Load) process by automating data transformations and ensuring that only clean, structured data is used in dashboards. This reduces the time it takes for data to be available in the dashboard, speeding up the entire pipeline.
6. Enable Row-Level Security (RLS) for Personalized Real-Time Insights
Real-time data can vary across different users in an organization. With Row-Level Security (RLS), you can control access to the data so that users only see information relevant to them. For example, sales teams can receive live updates on their specific region without seeing data from other territories, making real-time insights more personalized and relevant.
7. Monitor Data Latency
While real-time dashboards sound ideal, you should also monitor for data latency. Even with live datasets, there can be delays depending on your data source’s performance or how data is being processed. Ensure your data pipeline is optimized to reduce latency as much as possible. Implement caching mechanisms and optimize data refresh rates to keep latency low and insights truly real-time.
8. Embed Real-Time Dashboards into Apps
Embedding Power BI dashboards into your business applications can significantly enhance how your teams use real-time data. Whether it’s a customer support tool, sales management app, or project management system, embedding Power BI visuals ensures that decision-makers have the most recent data at their fingertips without leaving their workflow.
9. Regularly Update Data Sources and Models
Data sources evolve over time. Regularly update your data models, refresh connections, and ensure that the data you’re pulling in is still relevant. As your business needs change, it’s essential to refine and adjust your real-time data streams and visuals to reflect these shifts.
Conclusion
Optimizing Power BI dashboards for real-time data insights requires a combination of leveraging the right data connections, optimizing performance, and ensuring the dashboards are designed for quick interpretation. With the ability to access real-time data, businesses can improve their agility, make faster decisions, and stay ahead in an increasingly data-driven world.
By following these strategies, you can ensure that your Power BI dashboards are fully optimized to deliver the timely insights your organization needs to succeed.
0 notes
Text
What is a Power BI Course?
In the evolving landscape of data analytics and business intelligence, mastering data visualization tools is crucial. A Power BI certification course is designed to equip individuals with the skills needed to harness the full potential of Microsoft Power BI, a leading business analytics platform. Whether you're aiming to advance your career or make data-driven decisions within your organization, a Power BI developer course offers a comprehensive learning experience tailored to these objectives.
Overview of Power BI
Microsoft Power BI is a suite of business analytics tools that enables users to visualize and share insights from their data. It integrates seamlessly with various data sources, allowing the creation of interactive reports and dashboards. Power BI stands out for its user-friendly interface and powerful features, making it a valuable tool for both personal and professional use.
What You Will Learn in a Power BI Course
Introduction to Power BI:
Gain foundational knowledge of Power BI and its components, including Power BI Desktop, Power BI Service, and Power BI Mobile.
Learn about the platform’s architecture and its integration with other Microsoft products, such as Excel and Azure.
Data Preparation:
Discover how to connect to various data sources, including databases, cloud services, and spreadsheets.
Utilize Power Query for data cleaning, transformation, and shaping��skills crucial for any Power BI developer course.
Data Modeling:
Understand data modeling principles and how to create effective data models in Power BI.
Explore relationships between tables, data normalization, and creating calculated columns and measures.
Visualization Techniques:
Explore a range of visualization options available in Power BI, including charts, graphs, maps, and tables.
Learn to design and customize interactive dashboards and reports for effective data presentation.
DAX (Data Analysis Expressions):
Dive into DAX, the formula language used in Power BI for creating custom calculations and aggregations.
Gain hands-on experience with common DAX functions and formulas to enhance your data analysis capabilities.
Report Design and Sharing:
Learn best practices for designing user-friendly and visually appealing reports.
Understand how to publish reports to the Power BI service and share them securely with stakeholders.
Advanced Features:
Explore advanced features such as Power BI Dataflows for complex data preparation and integration.
Learn about Power BI’s integration with other tools and services, including AI-driven insights and data storytelling capabilities.
Who Should Take a Power BI Course?
Business Analysts: Professionals who need to analyze and visualize business data to provide actionable insights.
Data Analysts: Individuals responsible for preparing and presenting data in a meaningful way.
IT Professionals: Those looking to enhance their skill set with a powerful tool for data analysis and reporting.
Decision-Makers: Executives and managers who want to leverage data to drive strategic decisions.
Benefits of a Power BI Certification Course
Enhanced Data Skills: Develop the ability to create insightful reports and dashboards that drive business decisions.
Career Advancement: Gain a competitive edge with a Power BI certification course that showcases your expertise in a widely-used business intelligence tool.
Informed Decision-Making: Utilize data effectively to make informed business decisions and improve organizational performance.
Increased Productivity: Automate data reporting and streamline analytics processes, saving time and increasing efficiency.
Conclusion
A Power BI certification course provides valuable skills for anyone looking to leverage data for business insights. By mastering Power BI through a dedicated Power BI developer course, you can transform raw data into meaningful visualizations, streamline reporting processes, and make data-driven decisions that enhance your career or business. Investing in such a course is a step toward becoming proficient in one of the most powerful business intelligence tools available today.
0 notes
Text
Power BI Reporting: Empower Your Businesses with Latest Features
Power BI continues to be a leader in business intelligence, offering powerful tools for data analytics, visualization, and reporting. As organizations increasingly rely on data to make informed decisions, Power BI, backed by Microsoft’s robust Azure cloud analytics & business intelligence solutions, ensures businesses can harness data effectively. This blog explores the latest features of Power BI, its competitive advantages, and why it stands out among other BI platforms.

Latest Features of Power BI
DirectQuery for Power BI Datasets and Azure Analysis Services One of the most recent updates is the ability to create composite models by combining DirectQuery and imported data. This allows users to connect to Power BI datasets and Azure Analysis Services in real-time, enabling quicker decision-making while reducing the need for data duplication.
Enhanced Data Integration with Azure Synapse Analytics Power BI now integrates more seamlessly with Azure Synapse Analytics, allowing users to combine large-scale data processing capabilities with real-time analytics. This makes Power BI an invaluable tool for businesses looking to unify their data ecosystems under a single platform. As an Azure Synapse Analytics consulting service, this integration highlights Microsoft’s leadership in data management and analysis.
AI-Powered Analytics With AI features like automated insights, Power BI provides users with predictive analytics, allowing them to identify trends and potential business outcomes. This functionality bridges the gap between traditional analytics and AI, giving businesses a competitive edge.
Dataflow Enhancements Power BI's dataflows enable users to define ETL processes, share data across reports, and unify data from multiple sources. Recent updates have made dataflows more accessible, improving collaboration between teams and making it easier to build robust data models.
Paginated Reports The introduction of paginated reports brings pixel-perfect reporting to Power BI. It offers users flexibility in exporting reports to formats like PDF, providing more control over their reporting outputs.
Competitive Landscape: 7 Reasons Why Power BI is better
Power BI competes with a range of other BI tools, such as Tableau, QlikView, and Looker. Each of these platforms has unique strengths, but Power BI offers several compelling advantages.
Cost-Effective
Compared to competitors like Tableau, Power BI offers affordable licensing models. This makes it an attractive option for small to medium-sized businesses looking to implement enterprise-level business intelligence solutions without high upfront costs.
Integration with Microsoft Ecosystem
Power BI's tight integration with other Microsoft services—like Azure, Dynamics 365, and Office 365—gives it an edge over competitors. As a Microsoft partner for business intelligence, Power BI ensures seamless connectivity across different Microsoft tools, enabling businesses to easily access, manage, and visualize data.
Customization and Flexibility
Power BI's flexibility in building dashboards and reports allows businesses to customize their data analytics experience. While competitors like QlikView offer strong data modeling capabilities, Power BI provides a more intuitive and user-friendly interface, backed by a growing library of customizable visuals.
Cloud and On-Premise Solutions
While many competitors focus heavily on cloud solutions, Power BI offers both on-premise and cloud-based options. This allows businesses to choose the deployment strategy that best fits their needs, including leveraging business intelligence and data analytics services in hybrid environments.
Strong Support Services
Power BI offers extensive support through Power BI consulting partners and power analytics services. This network of Microsoft business intelligence partners provides expert guidance on optimizing Power BI deployments, ensuring businesses can extract maximum value from their data.
Advanced AI and Machine Learning Capabilities
Power BI is increasingly incorporating AI-driven insights. This positions it ahead of competitors like Tableau, particularly for companies seeking Microsoft competitive intelligence and advanced data analytics powered by machine learning models.
Scalable and Secure Platform
As businesses grow, so do their data needs. Power BI, especially when integrated with Azure Synapse, offers a scalable solution that ensures security and performance at an enterprise level. This makes Power BI ideal for businesses that need to handle large volumes of data while maintaining compliance.
Power BI for the Future
Power BI continues to evolve, bringing advanced data analytics and business intelligence consulting services to the forefront of decision-making. With the backing of Microsoft business intelligence expertise and support, businesses can easily implement and scale their analytics operations. Power BI offers unmatched flexibility, cost-efficiency, and integration with Microsoft’s vast ecosystem.
For businesses exploring Power BI support services or looking to streamline their data strategies, Power BI remains the go-to platform for both immediate analytics needs and future AI-driven insights.
At PreludeSys, we specialize in delivering comprehensive Power BI support services and tailored business intelligence consulting services to help organizations maximize the potential of their data. Our expertise spans Azure cloud analytics & business intelligence solutions, ensuring seamless integration and optimized performance for businesses at any stage of their digital transformation journey. Whether you need custom Power BI services, assistance with Azure Synapse Analytics consulting services, or advanced business intelligence and data analytics services, PreludeSys is your trusted Microsoft business intelligence partner.
#business intelligence#business intelligence services#power bi consultant#power bi services#business intelligence solutions#business intelligence consulting services
0 notes
Text
Top 10 Ways to Enhance Data Accuracy in Power BI Models

Power BI continues to evolve, offering new features and capabilities to enhance data modeling and analytics.
Staying ahead of the curve is crucial for leveraging the latest advancements to build more efficient and insightful data models.
Here are the top 10 trends in Power BI data modeling for 2024 that you should be aware of:
1. Enhanced Integration with AI and Machine Learning
Power BI is increasingly integrating with artificial intelligence (AI) and machine learning (ML) technologies. These advancements allow for predictive analytics and advanced data insights directly within your data models.
Impact: Enables data models to leverage AI-driven insights, enhancing forecasting, anomaly detection, and automated data enrichment.
Implementation: Use Power BI’s AI capabilities, such as AutoML and cognitive services, to integrate machine learning models and predictive analytics into your reports.
2. Improved Dataflow Capabilities
Dataflows in Power BI are becoming more sophisticated, allowing for advanced data transformations and preparation before loading into the data model. The new features focus on simplifying ETL processes and improving data pipeline management.
Impact: Streamlines data preparation, reduces redundancy, and enhances the efficiency of data transformation processes.
Implementation: Leverage the latest updates in Power Query Editor and dataflows to manage complex data preparation tasks more effectively.
3. Advanced Data Model Optimization
Power BI is introducing new tools and features for optimizing data models, including performance enhancements and improved data management capabilities.
These updates focus on reducing model size and increasing query performance.
Impact: Enhances the speed and responsiveness of reports, especially for large datasets.
Implementation: Utilize tools like Performance Analyzer and advanced DAX functions to optimize data models and improve performance.
4. Increased Support for Real-Time Data
The demand for real-time data access continues to grow, and Power BI is enhancing its support for real-time data streaming and DirectQuery.
This trend focuses on providing users with the most up-to-date information available.
Impact: Facilitates timely decision-making and operational efficiency by enabling real-time data updates and interactions.
Implementation: Implement DirectQuery and real-time data streaming to ensure your reports reflect the latest data changes.
5. Enhanced Data Security and Governance
Data security and governance are becoming more critical, with Power BI adding advanced features for managing data access and compliance. New capabilities include more granular control over data permissions and enhanced auditing features.
Impact: Improves data security, compliance, and governance by providing better control over data access and usage.
Implementation: Configure Row-Level Security (RLS) and use Power BI’s security features to manage data access and ensure compliance with regulations.
6. Expanded Data Source Connectivity
Power BI is continually expanding its list of supported data sources, including new connectors and enhanced integration with third-party services. This trend focuses on providing users with greater flexibility in connecting to diverse data sources.
Impact: Broadens the scope of data integration and analysis, making it easier to connect and combine data from various sources.
Implementation: Explore and utilize new connectors and data source options to integrate a wider range of data into your Power BI models.
7. Enhanced Visualizations and Reporting Features
Power BI is introducing new visualization types and reporting features to enhance data storytelling and user experience. These updates include more interactive and customizable visual elements.
Impact: Improves data presentation and makes it easier to convey insights through engaging and interactive visualizations.
Implementation: Experiment with the latest visualization options and reporting features to enhance the clarity and impact of your data presentations.
8. Increased Focus on User Experience
User experience is becoming a central focus in Power BI, with improvements aimed at making the platform more intuitive and user-friendly. New features are designed to simplify data modeling tasks and improve overall usability.
Impact: Enhances user adoption and productivity by providing a more seamless and accessible data modeling experience.
Implementation: Take advantage of the latest UI/UX enhancements in Power BI to streamline your workflow and improve the ease of use for your data models.
9. Growing Emphasis on Collaboration and Sharing
Collaboration and sharing features in Power BI are evolving, with new tools and functionalities designed to facilitate teamwork and data sharing. This trend focuses on improving the collaborative aspects of data modeling and reporting.
Impact: Supports better teamwork and data sharing by providing more robust collaboration tools and sharing options.
Implementation: Use Power BI’s collaboration features, such as shared datasets and report publishing, to enhance team collaboration and data accessibility.
10. Integration with Big Data and Cloud Platforms
Power BI is enhancing its integration with big data and cloud platforms, providing better support for handling large-scale data and cloud-based analytics. This trend focuses on enabling seamless integration with cloud services and big data environments.
Impact: Facilitates the analysis of large datasets and leverages cloud-based resources for scalable data modeling.
Implementation: Connect Power BI to big data platforms and cloud services to handle large volumes of data and utilize cloud-based analytics capabilities.
Conclusion
The trends in Power BI data modeling for 2024 reflect a significant shift towards more advanced, efficient, and user-centric features. By staying updated with these trends and integrating them into your data modeling practices, you can enhance the performance, functionality, and scalability of your Power BI solutions.
For more insights and guidance on optimizing your Power BI data models, visit PPN Solutions. Embrace these trends to ensure your data modeling practices are aligned with the latest advancements in the field.
0 notes
Text
What Is Power BI Training, And What Skills Will You Learn?
What Is Power BI Training, And What Skills Will You Learn?
At Power BI Training in Bangalore Near Learn, we specialize in providing top-notch Power BI training and resources to help individuals and organizations harness the power of data. Our blog covers a wide range of topics, from beginner tips and advanced techniques to real-time data analysis and integration with other business tools. Join our community to stay updated on the latest trends, innovations, and best practices in Power BI.
Overview of Power BI
In today’s rapidly evolving landscape of data analytics, staying ahead requires effective tools and skills. Microsoft’s Power BI has emerged as a powerful business intelligence tool designed to empower users with insights from data analysis. It can transform raw data into actionable insights. To use this tool appropriately, you need comprehensive Power BI Training in Bangalore
Components of Power BI
Power BI Desktop: A robust desktop application for data analysis and reporting.
Power BI Service: An online SaaS (Software as a Service) platform for viewing and sharing dashboards and reports.
Power BI Mobile Apps: Applications for Windows, iOS, and Android for accessing reports on the go.
Power BI Gateway: Facilitates secure data transfer between Power BI and on-premises sources.
Power BI Report Server: An on-premises solution for publishing Power BI reports.
Understanding Power BI Course in Bangalore
The primary goals of Power BI Training in Bangalore
Mastering Power BI Fundamentals: Understanding the core components and functionalities of Power BI.
Data Connectivity: Learning to connect Power BI to diverse data sources.
Dashboard and Report Creation: Developing skills to create interactive dashboards and reports.
Advanced Data Analysis: Proficiency in using DAX for complex calculations.
Collaboration and Sharing: Understanding how to share and collaborate on reports using Power BI Service.
Best Practices: Learning effective data visualization and report design principles.
Key Skills Acquired in Power BI Training Course Certification Bangalore
Best Power BI Training Course in Bangalore equips participants with essential skills for effective data analysis and reporting:
Data Connectivity and Integration: Connecting Power BI to various data sources and integrating data from multiple platforms.
Data Transformation and Cleaning: Using Power Query for shaping and cleaning data, handling missing values, duplicates, and errors.
Data Modelling: Organizing data into tables, defining relationships, and using DAX for creating calculated columns and measures.
Best Power BI Training in Bangalore are a crucial component of the Power BI ecosystem that can simplify data preparation and enable easier scalability compared to regular datasets. There are several ways they can be used and with proper knowledge, they can be set up quickly and provide greater control over data pipelines. In this blog post, we’ll explore what Power BI Dataflows are and provide a comprehensive guide on how to use them effectively.
Power BI, a leading premier business intelligence tool by Microsoft, makes data interactive and insightful. Users can interrogate data and see compelling insights Choosing to pursue a Power BI Training Course Certification with Power BI Training in Bangalore Near Learn is a strategic decision for anyone looking to advance their career in data analytics.
Their comprehensive training program, delivered by industry experts, ensures that you gain practical, hands-on experience with Power BI’s latest features. With their focused curriculum, real-time project work, and post-training support, you’ll be well-equipped to leverage Power BI for insightful data analysis and visualization. Join Power BI Training in Bangalore Near Learn to unlock new opportunities in the dynamic field of business intelligence and data analytics.

#power bi course in bangalore#power bi training and placement in bangalore#power bi training center bangalore#power bi course training bangalore
0 notes
Text
Unleashing the Power: A Guide to Creating Data Models in Power BI
Introduction:
In the dynamic world of data analytics, harnessing the power of cutting-edge tools is essential for gaining valuable insights. Power BI, Microsoft's business analytics service, stands out as a frontrunner in this arena.

In this blog, we will delve into the latest trends and best practices for creating a robust Data model in Power BI, empowering you to extract meaningful information from your data.
Understanding the Basics:
Before diving into the latest trends, it's crucial to grasp the fundamentals of data modeling in Power BI. A data model is a representation of your data that defines how data elements relate to each other. In Power BI, models consist of tables, relationships, and calculations.
Embracing Data Connectivity:
One of the latest trends in Power BI is the emphasis on diverse data connectivity options. The platform allows seamless integration with a variety of data sources, including cloud-based services, databases, and on-premises data. Stay updated on the latest connectors to ensure you can effortlessly access and integrate data from multiple sources.
Utilizing AI and Machine Learning:
The integration of artificial intelligence (AI) and machine learning (ML) capabilities within Power BI is a game-changer. Leverage features like AutoML to automate the machine learning model creation process. This enables users, even those without extensive data science expertise, to derive predictive insights and enhance decision-making.
Dataflows for Streamlined ETL:
Dataflows, a transformative concept in Power BI, allow users to create, transform, and load (ETL) data within the Power BI service. This trend simplifies the process of data preparation, making it more accessible for users. By creating reusable dataflows, you can ensure consistency and efficiency in data cleansing and transformation.
Dynamic Row-Level Security:
In an era where data security is paramount, dynamic row-level security is gaining prominence. This feature enables you to control access to data at a granular level based on user roles and filters. Implementing dynamic row-level security ensures that users only see the data relevant to their roles, enhancing data governance and compliance.
Advanced DAX Formulas:
The Data Analysis Expressions (DAX) language is at the heart of Power BI, and staying abreast of the latest DAX functions and formulas is essential. Recent updates include new time intelligence functions, improved handling of filter context, and enhanced support for data types. Mastering these advancements can elevate your data modeling capabilities.
Performance Optimization:
With the increasing volume of data, optimizing the performance of your Power BI reports is crucial. Trends in performance optimization include aggregations, which allow you to pre-calculate and store summarized data, reducing query times. Additionally, understanding and utilizing the performance analyzer tool can help identify bottlenecks in your reports.
Responsive Design for Mobile:
In an era where work is increasingly mobile, designing reports that are responsive and user-friendly on mobile devices is a key trend. Power BI offers features such as responsive slicers and mobile layout view to enhance the mobile user experience. Ensure that your data models and reports are optimized for accessibility on a variety of devices.
Conclusion:
Creating a robust data model in Power BI involves a combination of mastering the fundamentals and staying abreast of the latest trends. Embrace the power of diverse data connectivity, leverage AI and machine learning capabilities, and optimize performance for impactful insights. By staying informed and adopting these trends, you'll be well-equipped to unlock the full potential of Power BI in your data analytics journey.
0 notes
Text
[Fabric] Dataflows Gen2 destino "archivos" - Opción 1
La mayoría de las empresas que utilizan la nube para construir una arquitectura de datos, se están inclinando por una estructura lakehouse del estilo "medallón" (bronze, silver, gold). Fabric acompaña esta premisa permitiendo estructurar archivos en su Lakehouse.
Sin embargo, la herramienta de integración de datos de mayor conectividad, Dataflow gen2, no permite la inserción en este apartado de nuestro sistema de archivos, sino que su destino es un spark catalog. ¿Cómo podemos utilizar la herramienta para armar un flujo limpio que tenga nuestros datos crudos en bronze?
Para comprender mejor a que me refiero con "Tablas (Spark Catalog) y Archivos" de un Lakehouse y porque si hablamos de una arquitectura medallón estaríamos necesitando utilizar "Archivos". Les recomiendo leer este post anterior: [Fabric] ¿Por donde comienzo? OneLake intro
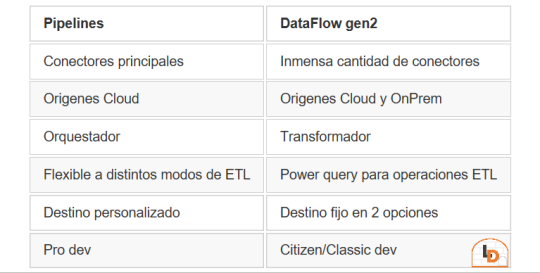
Fabric contiene un servicio llamado Data Factory que nos permite mover datos por el entorno. Este servicio tiene dos items o contenidos que fortalecen la solución. Por un lado Pipelines y por otro Dataflow Gen2. Veamos un poco una comparación teórica para conocerlos mejor.
NOTA: al momento de conectarnos a origenes on premise, leer las siguientes consideraciones: https://learn.microsoft.com/es-es/fabric/data-factory/gateway-considerations-output-destinations
Esta tabla nos ayudará a identificar mejor cuando operar con uno u otro. Normalmente, recomendaria que si van a usar una arquitectura de medallón, no duden en intentarlo con Pipelines dado que nos permite delimitar el destino y las transformaciones de los datos con mayor libertad. Sin embargo, Pipelines tiene limitada cantidad de conectores y aún no puede conectarse onpremise. Esto nos lleva a elegir Dataflow Gen2 que dificilmente exista un origen al que no pueda conectarse. Pero nos obliga a delimitar destino entre "Tablas" del Lakehouse (hive metastore o spark catalog) o directo al Warehouse.
He en este intermedio de herramientas el gris del conflicto. Si queremos construir una arquitectura medallón limpia y conectarnos a fuentes onpremise o que no existen en Pipelines, no es posible por defecto sino que es necesario pensar un approach.
NOTA: digo "limpia" porque no considero prudente que un lakehouse productivo tenga que mover datos crudos de nuestro Spark Catalog a Bronze para que vaya a Silver y vuelva limpio al Spark Catalog otra vez.
¿Cómo podemos conseguir esto?
La respuesta es bastante simple. Vamos a guiarnos del funcionamiento que Dataflow Gen2 tiene en su background y nos fortaleceremos con los shortcuts. Si leemos con detenimiento que hacen los Dataflows Gen2 por detrás en este artículo, podremos apreciar un almacenamiento intermedio de pre viaje a su destino. Esa es la premisa que nos ayudaría a delimitar un buen orden para nuestro proceso.
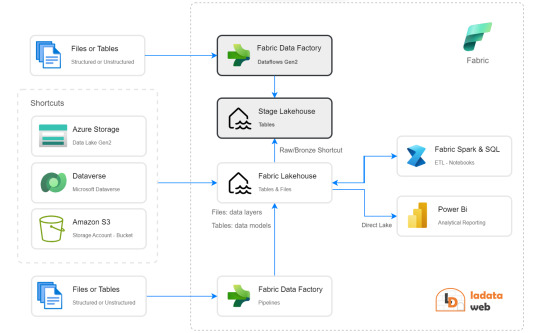
Creando un Lakehouse Stage (no es el que crea Fabric de caja negra por detrás sino uno creado por nosotros) que almacene los datos crudos provenientes del origen al destino de Tables. Nuestro Lakehouse definitivo o productivo haría un shortcut desde la capa Bronze a este apartado intermedio para crear este puntero a los datos crudos. De esta manera podemos trabajar sobre nuestro Lakehouse con un proceso limpio. Los notebooks conectados a trabajar en bronze para llevar a silver lo harían sin problema. Para cuando lleguemos a "Tables" (spark catalog o hive metastore), donde normalmente dejaríamos un modelo dimensional, tendríamos las tablas pertinentes a un modelo analítico bien estructurado.
Algunos ejemplos de orígenes de datos para los cuales esta arquitectura nos servirían son: Oracle, Teradata, SAP, orígenes onpremise, etc.
Espero que esto los ayude a delimitar el proceso de manera más limpia. Por lo menos hasta que Pipelines pueda controlarlo como lo hace Azure Data Factory hoy.
¿Otra forma?
Seguramente hay más, quien sabe, tal vez podamos mostrar un segundo approach más complejo de implementar, pero más caja negra para los usuarios en un próximo post.
#power bi#powerbi#ladataweb#fabric#microsoft fabric#fabric tips#fabric tutorial#fabric training#dataflow gen2#fabric data factory#data factory#data engineering
0 notes
Text
What is a Power BI Service Administrator?
A Power BI Service Administrator is a role or designation within the Power BI platform that entails significant administrative responsibilities and privileges. Power BI is a business intelligence tool offered by Microsoft, and the Power BI Service is the cloud-based component of the platform where users can publish, share, and collaborate on reports and dashboards. The role of a Power BI Service Administrator is essential for managing and maintaining the Power BI environment within an organization.
A Power BI Service Administrator is a critical role responsible for the effective management, governance, and security of the Power BI Service within an organization. They play a key role in ensuring that the platform is used efficiently, securely, and in compliance with organizational policies and regulations. Apart from it by obtaining Power BI Course, you can advance your career in Power BI. With this course, you can demonstrate your expertise in Power BI Desktop, Architecture, DAX, Service, Mobile Apps, Reports, many more fundamental concepts.
Power BI Service Administrators are responsible for a wide range of tasks and activities, including:
User Management: They oversee user access to the Power BI Service, including adding and removing users, assigning licenses, and managing security roles and permissions. This includes ensuring that only authorized users have access to sensitive data and reports.
Data Governance: Power BI Service Administrators play a critical role in data governance by defining data policies, implementing data classification and labeling, and monitoring data access and usage to ensure compliance with organizational and regulatory requirements.
Content Management: They manage the content published to the Power BI Service, including reports, dashboards, datasets, and dataflows. This includes organizing content into workspaces, setting up content refresh schedules, and ensuring the accuracy and reliability of data sources.
Security and Compliance: Administrators are responsible for enforcing security measures within the Power BI Service, including implementing Single Sign-On (SSO), enabling Multi-Factor Authentication (MFA), and configuring data loss prevention (DLP) policies to prevent data leakage.
Capacity Management: Power BI Service Administrators monitor and manage the capacity of the Power BI Service, ensuring that it can handle the data and usage demands of the organization. This may involve adjusting capacity settings, optimizing performance, and scaling resources as needed.
License Management: They manage the allocation and utilization of Power BI licenses, ensuring that the organization has the appropriate number and type of licenses to meet user needs.
Troubleshooting and Support: Administrators are responsible for diagnosing and resolving issues within the Power BI Service, providing support to users, and coordinating with Microsoft support if necessary.
Compliance and Auditing: They ensure that the Power BI environment complies with data protection regulations and industry standards. This includes auditing and logging user activities for compliance and security purposes.
Training and Adoption: Administrators may be involved in training users and promoting the adoption of Power BI best practices within the organization.
Integration: They may work on integrating Power BI with other tools and services within the organization's IT ecosystem, ensuring seamless data flow and analytics capabilities.
In summary, This role requires a deep understanding of Power BI capabilities, data management, security best practices, and a commitment to maintaining a high level of service for users and stakeholders.
0 notes
Text
Managing Multiple Workspaces and Business Processes
The proliferation of tools that support remote and flexible working is driving a need for workspaces that can accommodate multiple teams and projects. As a result, many organizations have more than one active workspace and managing these environments can be time-consuming and frustrating for users. The right way to plan for and manage multiple workspaces depends on the intent of the business processes and how the teams will collaborate in the future. Using this article as a guide, you can learn how to better organize your workspaces and business processes to make them easier to navigate, maintain, and use. AI-powered ERP
When deciding whether to use a single or multiple workspaces, consider the intent for collaboration as well as the type of content that will be created and managed. Depending on these factors, it may be best to create a narrowly defined workspace that is only intended for specific collaborative processes, such as creating or revising a specific document. Alternatively, it may be more useful to split up more complex processes into multiple workspaces. This allows the creation of more detailed ownership and management responsibilities for each workflow. It also helps to provide a more granular security model, allowing for fine-grained permissions on individual workspace items.
Each workspace is a distinct set of processes, cases, and data within the Process Workspace application. This approach provides a separation of data, processes, and people from the wider application, and helps to minimize data contamination across workspaces. In addition, each workspace is a dedicated database in MySQL and its files are located in a separate directory, making it easy to back up and restore the contents of a workspace independently of other workspaces.
A common practice is to separate data workspaces from reporting workspaces. A data workspace is primarily focused on storing and securing the contents of data items such as lakehouse tables, data pipelines, dataflows, and semantic models. A reporting workspace focuses more on downstream analytical activities, such as self-service BI. Reporting workspaces primarily (but not exclusively) include Power BI content.
In addition to the centralized storage and backup, the benefits of workspaces also include collaborative features such as document management and task tracking. This simplifies teamwork and enhances accountability by enabling all stakeholders to view project status at a glance. In addition, tools such as Asana help to simplify task assignment and progress monitoring, and can be used in combination with workspaces to further improve productivity.
If you have a large number of workspaces, it can become challenging to find the correct item when searching for a document or report. In this case, it is often necessary to implement naming conventions and other metadata to improve search results. Broadly defined workspaces can also run into technical limitations in terms of the number of items that can be stored and supported. Additionally, a broad workspace might require more work from an auditing perspective. Ultimately, it's best to limit the number of workspaces to those that are required by a business process and the organization's security requirements.
1 note
·
View note
Text
Data Analytics Tools: A Comprehensive Overview

Data analytics has become an integral part of decision-making processes in various industries. To effectively analyze and derive insights from data, businesses and professionals rely on a plethora of tools and software. In this comprehensive overview, we'll explore some of the most popular data analytics tools available today, categorizing them into different types based on their primary functions.
1. Data Collection and Integration:
a. Apache Nifi: An open-source data integration tool for collecting, transforming, and distributing data from various sources.
b. Talend: An integration tool that allows you to connect, access, and manage data from different sources.
c. Zapier: A workflow automation tool that connects various apps to automate data collection and transfer.
2. Data Cleaning and Preprocessing:
a. OpenRefine: A free, open-source tool for cleaning and transforming messy data.
b. Trifacta: Offers a user-friendly interface for data wrangling and cleaning.
c. DataWrangler: Developed by Stanford, it's a web-based tool for exploring and cleaning data.
3. Data Storage and Databases:
a. MySQL: An open-source relational database management system (RDBMS).
b. MongoDB: A NoSQL database that's particularly useful for handling unstructured data.
c. Amazon Redshift: A fully managed data warehouse service provided by AWS.
4. Data Analysis and Visualization:
a. Tableau: A popular data visualization tool that can connect to various data sources.
b. Power BI: Microsoft's business analytics service for creating interactive reports and dashboards.
c. QlikView/Qlik Sense: Tools for data visualization and business intelligence.
5. Statistical Analysis:
a. R: A programming language and software environment for statistical computing and graphics.
b. Python (with libraries like NumPy and SciPy): A versatile language for data analysis and statistics.
c. IBM SPSS: A statistical software suite used for advanced analytics and data analysis.
6. Machine Learning and Predictive Analytics:
a. Scikit-Learn: A Python library for machine learning.
b. TensorFlow: An open-source machine learning framework developed by Google.
c. RapidMiner: An integrated environment for machine learning, data mining, and predictive analytics.
7. Big Data and Distributed Computing:
a. Hadoop: An open-source framework for distributed storage and processing of big data.
b. Spark: An open-source, distributed computing system that can handle large datasets.
c. Amazon EMR: A cloud-native big data platform for processing and analyzing vast amounts of data.
8. Text and Sentiment Analysis:
a. NLTK (Natural Language Toolkit): A Python library for working with human language data.
b. IBM Watson NLU: Offers natural language understanding and sentiment analysis.
c. TextBlob: A simpler Python library for processing textual data.
9. Real-time Analytics:
a. Apache Kafka: A distributed streaming platform for building real-time data pipelines.
b. Apache Flink: An open-source stream processing framework.
c. Elasticsearch: A search and analytics engine that can provide real-time insights.
10. Cloud-Based Data Analytics:
a. Google Cloud Dataflow: A serverless data processing service on Google Cloud.
b. AWS Data Analytics: A suite of services for analytics on Amazon Web Services.
c. Microsoft Azure Data Analytics: A range of analytics services offered by Microsoft's Azure cloud platform.
Remember that the choice of a data analytics tool should be based on your specific needs, the size and nature of your data, and your proficiency with the tool. It's often beneficial to have a diverse skill set and the ability to use multiple tools for different aspects of the data analytics process.
#Data Analytics#Data Transformation#Data Analytics Tools#data visualization tool#database management system
0 notes
Text
How to create a Dataflow within the Power BI Service
In November 2018, Microsoft released Dataflows in public preview. Later on, in April 2019, Dataflows became generally available. Dataflows used to be available in Premium licenses only, but it is […] The post How to create a Dataflow within the Power BI Service appeared first on Datafloq. https://datafloq.com/read/learn-how-to-create-a-dataflow-within-the-power-bi-service/?utm_source=dlvr.it&utm_medium=tumblr
0 notes