#kaggle
Explore tagged Tumblr posts
Text

shoutout to free gpu resources by my bff kaggle

#best part is. i can probably even improve this even further! just have to work on avoiding overfitting#i am talking#coding#ml#kaggle
9 notes
·
View notes
Text
Tonight I am hunting down venomous and nonvenomous snake pictures that are under the creative commons of specific breeds in order to create one of the most advanced, in depth datasets of different venomous and nonvenomous snakes as well as a test set that will include snakes from both sides of all species. I love snakes a lot and really, all reptiles. It is definitely tedious work, as I have to make sure each picture is cleared before I can use it (ethically), but I am making a lot of progress! I have species such as the King Cobra, Inland Taipan, and Eyelash Pit Viper among just a few! Wikimedia Commons has been a huge help!
I'm super excited.
Hope your nights are going good. I am still not feeling good but jamming + virtual snake hunting is keeping me busy!
#programming#data science#data scientist#data analysis#neural networks#image processing#artificial intelligence#machine learning#snakes#snake#reptiles#reptile#herpetology#animals#biology#science#programming project#dataset#kaggle#coding
43 notes
·
View notes
Text
https://www.kaggle.com/datasets/paultimothymooney/recipenlg
This is a fun dataset if you know a little code! If not, you can still scroll through and maybe see a recipe you wanna try
You should be starting a recipe book. I don't give a shit if you're only 20-years-old. The modern web is rotting away bit by bit before our very eyes. You have no idea when that indie mom blog is going down or when Pinterest will remove that recipe. Copy it down in a notebook, physically or digitally. Save it somewhere only you can remove it. Trust me, looking for a recipe only to find out it's been wiped off the internet is so fucking sad. I've learned my lesson one too many times.
101K notes
·
View notes
Text
World University Rankings (2025)
youtube
0 notes
Text
Data Science and Artficial Intelligence Key concepts and Application
Introduction
In the modern world with constantly developing technology Data Science vs Artificial Intelligence are becoming more and more interrelated. While Data Science is concerned with mining data So AI takes it a step higher by building machines with the ability to learn, reason and even decide. The integration of these two disciplines is revolutionalising various industries throughout the world by bringing in optimised systems and strategies. As Data Science plays the role of creating the proper input by putting together clean and organized data, AI extends it by creating smart models that learn. Combined, they comprise the generation that embraces the future of innovation and development for countless opportunities in almost every industry.
What is Data Science?
Data Science is a multi-disciplinary field, which deals with the processing of data into meaningful information. It combines some methods from statistics, machine learning, as well as data engineering to work with data, make conclusions, and provide decision support. Some of the most used are python, R and SQL which assist in cleaning, processing and even visualization of data.
What is Artificial Intelligence?
Artificial Intelligence (AI) on the other hand is the reproduction of human intelligence methodologies by computer systems. It basically implies the ability of a machine to imitate functions that are normally associated with human cognition for instance, speech recognition, decision making and problem solving among others. Machine learning is one of the main branches of AI; others are natural language processing and computer vision that lie behind voice assistants and self-driving cars.
Fundamental Concepts of Data science and Artificial Intelligence
Core Differences Between Data Science and AI: Although Data Science and AI are related, they are two different fields although share some similarities. Data Science is about discovering information from data with the help of statistics, AI is about building machines that act like humans. Data Science mostly involves exploration, discovery and analysis of patterns and trends in data while AI also emulates decision-making in addition to analysis. AI also relies on models that are self-tuning and can become better with time unlike the conventional data analysis techniques.
Overlap Between Data Science and AI: The most apparent intersection of Data Science and AI is machine learning (ML). This is because ML models which are the key components of AI work using data which is gathered, purified and formatted by Data Scientists. Due to this, data science is associated with AI where the quality of data determines the success of the
Key Components of Data Science and Artificial Intelligence
Data Science Components:
Data Collection: The first step that is involved in this process is collection of raw data from sources such as databases, internet APIs or surveys.
Data Cleaning and Processing: This includes error correction, management of missing values, and data format transformation for further analysis.
Statistical Analysis and Visualization: Data Scientists employ statistical techniques to analyze the data and employ graphical interfaces such as Mat plot lib or Power BI to portray the results in a comprehendible manner.
Data Modeling and Interpretation: The last process is the modeling process which include creating models such as predictive models to yield information and make decisions.
AI Components:
Machine Learning Algorithms: They include supervised learning algorithms such as classification, regression learning algorithms, unsupervised learning algorithms including clustering and dimensionality reduction learning algorithms as well as reinforcement learning algorithms.
Natural Language Processing (NLP): NLP is an important component that helps AI systems understand and produce human language needed in functions such as voice recognition or translation.
Computer Vision: Image processing is a way that AI decode the visual information which may help in the implementation of features such as face identification, objects’ detection/ recognition, and radiography.
Robotics and Automation: Robots are capable of executing operations with the help of AI to make them operate independently whether in factories or usage in hospitals and several other houses.
Data Science: Applications and Use Cases
Business Intelligence and Analytics: Data Science helps make decisions as it gives business insights derived from data analytics. Banks and other companies incorporate predictive analytics into their business models to be able to predict market trends, manage the most effective ways of marketing as well as categorize customers. They are currently using big data analysis to understand the patterns of consumer behavior such that businesses can create innovative products and services.
Healthcare: It is also widely used in the field of healthcare where patient data analysis is paramount in the treatment processes through the formulation of individualized treatment plans. It also helps in medical research where it reviews clinical data, identifies the compatibility of drugs as well as ability to forecast diseases using epidemiology data.
Finance: Banks, making efficient use of various data types, use data science, for example, to detect credit card fraud, to assess credit risk for loans, and for algorithmic trading. Machine learning, with an ability of learning from previous data formerly processed, can predict a given transaction as fraudulent and, therefore, limit financial fraud. Besides, they create models that they use to predict the market and hence help in investment decisions.
E-commerce: E-commerce organizations leverage data science to develop customized shopping experiences based on user behavior. Such techniques allow developing valuable insights about demand and supply and applying them to inventory management.
Artificial Intelligence: Uses of applications and specific examples
Autonomous Vehicles: Self-driving automobiles employ AI in processing data coming from the different sensors, cameras and radar systems to compute environment. AI assist in real-time decisions making including identifying of barriers, pedestrian movements and traffic unpredictable scenes.
Healthcare: For example, some of the industries that AI is disrupting includes medical imaging, diagnostics, and even patient personalized treatment. The AI technologies help the doctors to identify the irregularities in the X-rays and the MRIs, diagnose diseases at the initial stage, and prescribe the right medications according to the patient’s genes.
Retail and Customer Service: AI helps the customers through the artificial intelligence in the form of chatbots and virtual assistances which respond to the customer queries and suggestions, ordering processes etc. The customer profiling systems used by AI-enabled applications based on the customer’s penchant to prescribe products that suit their tastes.
Manufacturing and Robotics: In the process of manufacturing, AI is applied in facilitating production processes to minimize the use of human resource and time wastage. AI is also used in the predictive maintenance whereby it studies data from the equipment to forecast when it will fail and when it should be taken for maintenance.
Data Science vs Artificial Intelligence
Focus and Objectives:
Data Science is mostly about analysis and deeper interpretation of the essence of a problem about data. It aims to utilize data for decision-making purposes.
AI is centered on designing machines that can smartly execute tasks including the ability to decide, learn, and solve problems.
Skill Sets:
For a Data Scientist, fundamental competencies are data management, data analysis, and programming knowledge of SQL, Python, and R but for an AI professional their competencies are in algorithm implementation, different machine learning approaches, and implementation of AI using toolkits such as Tensor flow and Pytorch among others.
Tools and Technologies:
Data Science: They include pandas, numpy, R, and Matplotlib for data manipulation and visualization.
AI: Accessible tools that are employed for the training and development of machine learning models include TensorFlow, Scikit-learn, and Keras.
Workflows and Methodologies:
Data Science: It involves analyzing and processing data by following key steps such as data collection, cleaning, inspection, visualization, and analysis to extract meaningful insights and inform decision-making.
AI: Typically, it encompasses model construction, model training, model validation, and model deployment with a data set of big data and compute power for deep learning.
The Convergence of Data Science and AI
How Data Science Enables AI: Data Science is the most important part and the base of all AI projects because AI profoundly relies on clean structured data for training the models. To be more precise, data scientists clean up and engineer large amounts of data to be ready for learning by artificial intelligence. This means that if data science is not well done within an organization then the ability of AI models to perform will be affected by poor quality data.
AI Enhancing Data Science: AI is simplifying many challenges in Data Science by applying it in various areas and being a tool in data preprocessing through cleaning data, feature selection, and other applications like anomaly detection. With the help of AI tools data scientists can manage and accomplish tasks more quickly and discover insights at a higher pace.
Future Trends in Data Science and AI
Integration of AI in Data Science Workflows: AI is being integrated into the Data Science process as a crucial enabler which is evident by the increasing use of AutoML systems that are capable of selecting the model, training as well and tuning it.
Evolving AI Applications: SI is transitioning from single-skill oriented to multiskilled machines, thus giving a more generalized system that will require much less human interaction. Others includeData privacy, bias, and accountability issues are emerging as ethical issues in the development of AI.
New Opportunities for Collaboration: This is because the two areas of Data Science and AI will continue to develop with increased integration across multiple disciplines. The teams will include data scientists, artificial intelligence engineers, and specific subject matter domain experts who will come together to work on intricate challenges and build intelligent solutions for sectors such as healthcare, finance, and education.
Conclusion
Even though Data Science and AI have to do with data and data processing, their objectives and approaches are not the same. Data Science is the process of drawing inferences or making decisions with the help of data and AI is about creating autonomous entities which can learn on their own. The future of both fields is however interrelated in the sense that an AI system will depend on the kind of data processed by data scientists. Data Science and AI require competent workers or specialists who are equipped with efficient knowledge in those industries. The demand for professionals in Data science and AI will rise as various companies across their kind embark on gainful research through advanced technology.
#DataScience#MachineLearning#ArtificialIntelligence#BigData#DeepLearning#DataAnalytics#DataVisualization#AI#ML#DataScientist#LearnDataScience#DataScienceCareer#WomenInDataScience#100DaysOfCode#TechCareers#Upskill#Python#NumPy#Pandas#TensorFlow#ScikitLearn#SQL#JupyterNotebooks#Kaggle#DataScienceCommunity#AIForGood#DataIsBeautiful#DataDriven
0 notes
Text
Getting Started with Automated Data Pipelines, Day 1: Versioning and GitHub | Kaggle
On the first livestream for the automating data pipelines event, we’ll be talking about data versioning and how to connect a GitHub … source
0 notes
Text
5-Day Gen AI Intensive Course with Google Learn Guide | Kaggle
0 notes
Text
Python Basics and Data Analytics: Your First Step Towards Data Mastery
If you’re looking to dive into the world of data science, starting with Python programming and data analytics is a smart move. Python is one of the most popular programming languages, known for its simplicity and versatility, making it an excellent choice for beginners. This guide will help you understand the fundamental concepts and set you on the path to mastering data analytics.
Why Python? Python is favored by many data scientists due to its readability and extensive libraries like Pandas, NumPy, and Matplotlib. These libraries simplify data manipulation, analysis, and visualization, allowing you to focus on drawing insights rather than getting lost in complex code.
Key Concepts to Learn: Start by familiarizing yourself with Python basics, such as variables, data types, loops, and functions. Once you have a good grasp of the fundamentals, you can move on to data analysis concepts like data cleaning, manipulation, and visualization.
Hands-On Practice: The best way to learn is by doing. Engage in projects that allow you to apply your skills, such as analyzing datasets or creating visualizations. Websites like Kaggle provide real-world datasets for practice.
Resources for Learning: Numerous online platforms offer courses and tutorials tailored for beginners. Consider checking out resources on lejhro bootcamp, or even free tutorials on YouTube.
Free Masterclass Opportunity: To enhance your learning experience, there’s a free masterclass available that covers the essentials of Python programming and data analytics. This is a fantastic chance to deepen your understanding and gain valuable insights from experts. Be sure to visit this Python Programming and Data Analytics Fundamentals to secure your spot!
Embarking on your journey into Python programming and data analytics is an exciting opportunity. By building a solid foundation, you’ll be well-equipped to tackle more complex data challenges in the future. So, start your journey today and take that first step towards data mastery!
#DataScience#PythonProgramming#DataAnalytics#LearnPython#DataVisualization#Pandas#NumPy#Kaggle#MachineLearning#DataCleaning#Analytics#TechEducation#FreeMasterclass#OnlineLearning#DataDriven#ProgrammingForBeginners#HandsOnLearning#LejhroBootcamp#DataAnalysis#CodingJourney
1 note
·
View note
Text
Best way to learn data analysis with python
The best way to learn data analysis with Python is to start with the basics and gradually build up your skills through practice and projects. Begin by learning the fundamentals of Python programming, which you can do through online courses, tutorials, or books. Once you are comfortable with the basics, focus on learning key data analysis libraries such as Pandas for data manipulation, NumPy for numerical operations, and Matplotlib or Seaborn for data visualization.
After you grasp the basics, apply your knowledge by working on real datasets. Platforms like Kaggle offer numerous datasets and competitions that can help you practice and improve your skills. Additionally, taking specialized data analysis courses online can provide structured learning and deeper insights. Consistently practicing, participating in communities like Stack Overflow or Reddit for support, and staying updated with the latest tools and techniques will help you become proficient in data analysis with Python.
#Dataanalysis#Pythonprogramming#Learnpython#Datascience#Pandas#NumPy#Datavisualization#Matplotlib#Seaborn#Kaggle#Pythoncourses#CodingforBeginners#DataPreparation#StatisticsWithPython#JupyterNotebooks#VSCode#OnlineLearning#TechSkills#ProgrammingTutorials#DataScienceCommunity
0 notes
Text
Benefits of Gemma on GKE for Generative AI

Gemma On GKE: New features to support open generative AI models
Now is a fantastic moment for businesses using AI to innovate. Their biggest and most powerful AI model, Gemini, was just released by Google. Gemma, a family of modern, lightweight open models derived from the same technology and research as the Gemini models, was then introduced. In comparison to other open models, the Gemma 2B and 7B models perform best-in-class for their size.
They are also pre-trained and come with versions that have been fine-tuned to facilitate research and development. With the release of Gemma and their expanded platform capabilities, they will take the next step towards opening up AI to developers on Google Cloud and making it more visible.
Let’s examine the improvements they introduced to Google Kubernetes Engine (GKE) now to assist you with serving and deploying Gemma on GKE Standard and Autopilot:
Integration with Vertex AI Model Garden, Hugging Face, and Kaggle: As a GKE client, you may begin using Gemma in Vertex AI Model Garden, Hugging Face, or Kaggle. This makes it simple to deploy models to the infrastructure of your choice from the repositories of your choice.
GKE notebook using Google Colab Enterprise: Developers may now deploy and serve Gemma using Google Colab Enterprise if they would rather work on their machine learning project in an IDE-style notebook environment.
A low-latency, dependable, and reasonably priced AI inference stack: They previously revealed JetStream, a large language model (LLM) inference stack on GKE that is very effective and AI-optimized. In addition to JetStream, they have created many AI-optimized inference stacks that are both affordable and performante, supporting Gemma across ML Frameworks (PyTorch, JAX) and powered by Cloud GPUs or Google’s custom-built Tensor Processor Units (TPU).
They released a performance deepdive of Gemma on Google Cloud AI-optimized infrastructure earlier now a days, which is intended for training and servicing workloads related to generative AI.
Now, you can utilise Gemma to create portable, customisable AI apps and deploy them on GKE, regardless of whether you are a developer creating generative AI applications, an ML engineer streamlining generative AI container workloads, or an infrastructure engineer operationalizing these container workloads.
Vertex AI Model Garden, hugging face, and connecting with Kaggle
Their aim is to simplify the process of deploying AI models on GKE, regardless of the source.
Putting a Face Hug
They established a strategic alliance with Hugging Face, one of the go-to places for the AI community, earlier this year to provide data scientists, ML engineers, and developers access to the newest models. With the introduction of the Gemma model card, Hugging Face made it possible for Gemma to be deployed straight to Google Cloud. You may choose to install and serve Gemma on Vertex AI or GKE after selecting the Google Cloud option, which will take you to Vertex Model Garden.
Model Garden Vertex
Gemma now has access to over 130 models in the Vertex AI Model Garden, including open-source models, task-specific models from Google and other sources, and enterprise-ready foundation model APIs.
Kaggle
Developers can browse through thousands of trained, deployment-ready machine learning models in one location with Kaggle. A variety of model versions (PyTorch, FLAX, Transformers, etc.) are available on the Gemma model card on Kaggle, facilitating an end-to-end process for downloading, installing, and managing Gemma on a GKE cluster. Customers of Kaggle may also choose to “Open in Vertex,” which directs them to Vertex Model Garden and gives them the option to deploy Gemma as previously mentioned on Vertex AI or GKE. Gemma’s model page on Kaggle allows you to examine real-world examples that the community has posted using Gemma.
Google Colab Enterprise
Notebooks from Google Colab Enterprise
Through Vertex AI Model Garden, developers, ML engineers, and ML practitioners may now use Google Colab Enterprise notebooks to deploy and serve Gemma on GKE. The pre-populated instructions in the code cells of Colab Enterprise notebooks provide developers, ML engineers, and scientists the freedom to install and perform inference on GKE using an interface of their choice.
Serve Gemma models on infrastructure with AI optimizations
Performance per dollar and cost of service are important considerations when doing inference at scale. With Google Cloud TPUs and GPUs, an AI-optimized infrastructure stack, and high-performance and economical inference, GKE is capable of handling a wide variety of AI workloads.
By smoothly combining TPUs and GPUs, GKE enhances their ML pipelines, enabling us to take use of each device’s advantages for certain jobs while cutting down on latency and inference expenses. For example, they deploy a big text encoder on TPU to handle text prompts effectively in batches. Then, they use GPUs to run their proprietary diffusion model, which uses the word embeddings to produce beautiful visuals. Yoav HaCohen, Ph.D., Head of Lightricks’ Core Generative AI Research Team.
Gemma using TPUs on GKE
The most widely used LLMs are already supported by a number of AI-optimized inference and serving frameworks that now enable Gemma on Google Cloud TPUs, should you want to employ Google Cloud TPU accelerators with your GKE infrastructure. Among them are:
Jet Stream Today
They introduced JetStream(MaxText) and JetStream(PyTorch-XLA), a new inference engine particularly made for LLM inference, to optimise inference performance for PyTorch or JAX LLMs on Google Cloud TPUs. JetStream provides good throughput and latency for LLM inference on Google Cloud TPUs, marking a major improvement in both performance and cost effectiveness. JetStream combines sophisticated optimisation methods including continuous batching, int8 quantization for weights, activations, and KV caching to provide efficiency while optimising throughput and memory utilisation. Google’s suggested TPU inference stack is called JetStream.
Use this guide to get started with JetStream inference for Gemma on GKE and Google Cloud TPUs.
Gemma using GPUs on GKE
The most widely used LLMs are already supported by a number of AI-optimized inference and serving frameworks that now enable Gemma on Google Cloud GPUs, should you want to employ Google Cloud GPU accelerators with your GKE infrastructure.
What is vLLM
To improve serving speed for PyTorch generative AI users, vLLM is an open-source LLM serving system that has undergone extensive optimisation.
Some of the attributes of vLLM include:
An improved transformer programme using PagedAttention
Continuous batching to increase serving throughput overall
Tensor parallelism and distributed serving across several GPUs
To begin using vLLM for Gemma on GKE and Google Cloud GPUs, follow this tutorial
Text Generation Inference (TGI)
Text creation Inference (TGI), an open-source LLM serving technology developed by Hugging Face, is highly optimised to enable high-performance text generation during LLM installation and serving. Tensor parallelism, continuous batching, and distributed serving over several GPUs are among the features that TGI offers to improve overall serving performance.
Hugging Face Text Generation Inference for Gemma on GKE and Google Cloud GPUs may be used with the help of this tutorial.
Tensor RT-LLM
To improve the inference performance of the newest LLMs, customers utilising Google cloud GPU VMs with NVIDIA Tensor Core GPUs may make use of NVIDIA Tensor RT-LLM, a comprehensive library for compiling and optimising LLMs for inference. Tensor RT-LLM supports features like continuous in-flight batching and paged attention.
This guide will help you build up NVIDIA Tensor Core GPU-powered GPU virtual machines (GKE) and Google Cloud GPU VMs for NVIDIA Triton with Tensor RT LLM backend.
Google Cloud provides a selection of options to meet your needs, whether you’re a developer utilising Gemma to design next-generation AI models or choosing training and serving infrastructure for those models. GKE provides an independent, adaptable, cost-effective, and efficient platform for AI model development that may be used to the creation of subsequent models.
Read more on Govindhtech.com
#news#govindhtech#gemma#gemma2b#gemma7b#VertexAI#kaggle#generativeai#googlekubernetengine#technologynews#technology#TechnologyTrends#technews#techtrends
0 notes
Text
Meet Gemma: Your New Secret Weapon for Smarter AI Solutions from Google!
Gemma, Google’s new generation of open models is now a reality. The tech major released two versions of a new lightweight open-source family of artificial intelligence (AI) models called Gemma on Wednesday, February 21. Gemma is a group of modern, easy-to-use models made with the same advanced research and technology as the Gemini models. Created by Google DeepMind and other teams at Google,…
View On WordPress
#AI innovation#Colab#developers#diverse applications#events#exploration#free credits#Gemma#Google Cloud#Kaggle#model family#open community#opportunities#quickstart guides#researchers
0 notes
Link
看看網頁版全文 ⇨ 鐵達尼號生存者資料集 / Dataset: Titanic Survived https://blog.pulipuli.info/2023/07/dataset-titanic-survived.html 這份資料集改編自Kaggle所發佈的鐵達尼號生存者資料集。 可作為機器學習練習使用。 ---- # 資料來源 / Source https://www.kaggle.com/competitions/titanic/data。 # 資料集下載 / Download 這份資料集分成訓練集 Titanic-Survived.train.ods 與測試集 Titanic-Survived.test.ods。 ## 訓練集 / Train set - Google試算表線上檢視 - ODS格式下載 - OpenDoucment Spreadsheet (.ods) 格式備份:Google Drive、GitHub、One Drive、Mega、Box、MediaFire、pCloud、Degoo、4shared 訓練集將用於構建機器學習的模型,並具備每位乘客是否存活的結果。 機器學習模型應根據乘客的性別和艙位等「屬性」來建立,或是使用其他特徵工程(feature engineering)的技術來建造新的屬性。 ## 測試集 / Test set - Google試算表線上檢視 - ODS格式下載 - OpenDoucment Spreadsheet (.ods) 格式備份:Google Drive、GitHub、One Drive、Mega、Box、MediaFire、pCloud、Degoo、4shared 測試集則是用於評估模型的表現。 原本的測試集並不會告訴你每位乘客是否存活,僅是讓機器學習模型用來預測結果。 為了方便大家練習,我將測試集的結果加了上去。 # 案例數 / Instacnes - 訓練集:890 - 測試集:418 # 屬性 / Attributes 本資料集有部分屬性有所缺失,建立模型的時候需要特別處理。 # 目標屬性 / Target class。 「Survived」,也就是鐵達尼號的乘客是否生存。 ---- 文章最後要來問的是:你認為什麼屬性是影響乘客最後是否存活的關鍵呢?。 - 1. 船票等級:越高級表示越有錢,應該更容易存活吧? - 2. 性別:男生身體力壯,應該更容易存活吧? - 3. 年齡:青壯年應該比老人或小孩更容易存活吧? - 4. 登船港口:愛爾蘭上來的乘客,說不定是海盜的後代,更容易存活? - 5. 其他:是否還有其他因素與存活率有關? 歡迎在下面說說你的看法喔! ---- 看看網頁版全文 ⇨ 鐵達尼號生存者資料集 / Dataset: Titanic Survived https://blog.pulipuli.info/2023/07/dataset-titanic-survived.html
0 notes
Text
How to Successfully Build a Professional Portfolio for Data Science Jobs (2025 Edition)
In 2025, your data science portfolio is your loudest resume. With thousands of bootcamp grads and certificate holders entering the field each year, what sets successful candidates apart isn’t just what they’ve learned — it’s what they’ve built. If you’re a job seeker aiming to stand out in the competitive data science job market, a strong, strategic portfolio is non-negotiable. Let’s break down…
#best data science tools 2025#data science portfolio 2025#github for data scientists#how to build data science projects#kaggle portfolio tips
0 notes
Text
Got to know while searching our slack channel at #mlzoomcamp @DataTalksClub that we can combine the Capstone2 with the competition. At least the most time consuming parts of the project : EDA & model training can be done same for both project & competition and save ample time
0 notes
Text
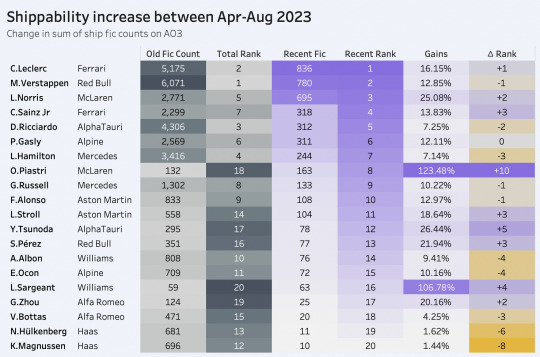
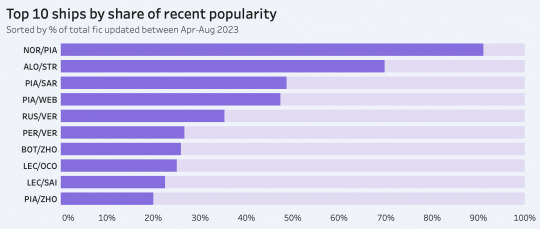
mini summer break update... new entries to the f1 rpf centrality graph (PIA, SAR) + oscar has had by far the largest relative increase in ship fic since i first pulled data back in april 👨🍳
f1 rpf graphing & archive insights
intro & prior work
hello! if you're reading this, you may already be familiar with my previous post about graphing hockey rpf ships and visualizing some overarching archive insights (feel free to check it out if you aren't, or alternatively just stick around for this intro). i've been meaning to make an f1 version of that post for a while, especially since i've already done a decent amount of f1 rpf analysis in the past (i have a very rough post i wrote a year ago that can be read here, though fair warning that it really does not make any sense; while i've redone a few viz from it for this post i just figured i'd link it solely because there are other things i didn't bother to recalculate!)
f1 is quite different from many team sports because a large part of my process for hockey was discovering which ships exist in the first place—when there are thousands and thousands of players who have encountered one another at different phases of their careers, it's interesting to see how people are connected and it's what was personally interesting to me about making my hockey graphs. however, with f1's relative pursuit of "exclusivity," barriers to feeder success and a slower-to-change, restrictive grid of 20 drivers, it becomes generally expected that everyone has already interacted with one another in some fashion, or at least exists at most 2 degrees of separation from another driver. because of this, i was less interested in "what relationships between a large set of characters exist?" (as per my hockey post) and more so in "what do the relationships between a small set of characters look like?"
process
my methodology for collecting "ship fic" tries to answer the question: what does shippability really look like on ao3? (the following explanation is adapted from my hockey post:) a perceived limitation i have with character tagging numbers on ao3 is that they don’t exactly reflect holistic ship fic; that is, if lando is tagged as a character in a max/daniel fic, it gets attributed to his character tag but doesn’t actually say anything about how many Relationship Fics exist for him on a whole. my best solution for this was essentially uncovering most of a driver's relationships and summing their individual fic counts to create an approximate # of “relationship fics” for each player. so any kind of shippability graph going forward will use that metric.
i used ao3’s relationship tag search and filtered by canonical in the formula 1 rpf fandom and only pulled relationship* fics (“/” instead of “&”) with a min. of 5 works. ao3’s counts are… Not the most accurate, so my filtering may have fudged some things around or missed a few pairings on the cusp, which again is why all the visuals here are not meant to show everything in the most exact manner but function more so as a “general overview” of ficdom. although i did doublecheck the ship counts so the numbers themselves are accurate as of time of collection.
(*i excluded wag ships, reader ships, threesomes to make my life easier—although i know this affects numbers for certain drivers, team principal/trainer/engineer ships, and any otherwise non-driver ship. i left in a few ships with f2, fe, etc. drivers given that that one character was/is an f1 driver, but non-f1 drivers were obviously excluded from any viz about f1 driver details specifically. this filtering affected some big ships like felipe massa/rob smedley, ot3 combinations of twitch quartet and so on, which i recognize may lower the… accuracy? reliability??? of certain graphs, but i guess the real way to think of the "shippability metric" is as pertaining solely to ship fic with other drivers. although doing more analysis with engineers and principals later down the line could be cool)
also note that since i grouped and summed all fics for every single ship a driver has, and since one fic can be tagged as multiple ships, there will be inevitable overlap/inflation that also lessens the accuracy of the overall number. however, because there's no easy way to discern the presence and overlap of multiship fic for every single driver and every single ship they have, and attempting to do so for a stupid tumblr post would make this an even larger waste of time… just take everything here with a grain of salt!
data for archive overview viz was collected haphazardly over the past few days because i may have procrastinated finishing this post haha. but all ship data for section 2 was specifically collected april 22, 2023.
PART I. f1 rpf archive overview
before i get to ship graphing, here are a few overviews of f1 ficdom growth and where it measures relative to other sports fandoms, since i find the recent american marketability of f1 and its online fandom quite interesting.
first off, here's a graph that shows the cumulative growth of the top 8 sports rpf fandoms from 2011 until now (2023 is obviously incomplete since we're only in may). i've annotated it with some other details, but we can see that f1 experienced major growth after 2019, which is when the first episode of dts was released.
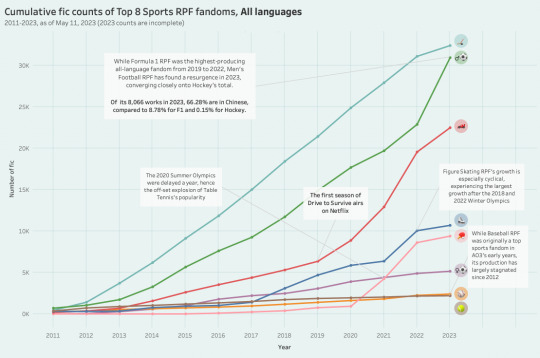
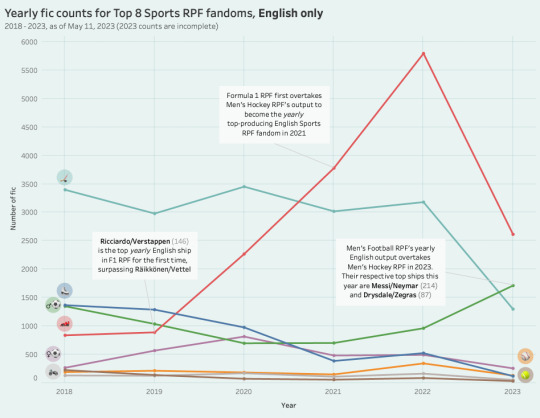
something that fascinated me when making this graph was the recent resurgence of men's football rpf in 2023; while the fandom has remained fairly consistent over the years, i had noticed that its yearly output was on the decline in my old post, and i was especially surprised to see it eclipse even f1 for 2023. turns out that a large driver behind these numbers is its c-fandom, and it reminded me that out of all the sports rpf fandoms, hockey rpf is fairly unpopular amongst chinese sports fans! i wanted to delve into this a little more and look at yearly output trends for the top sports fandoms since 2018, only this time filtered to exclusively english works (a poor approximation for "western" fandom, i know, but a majority of sports fandom on tumblr does create content in english).
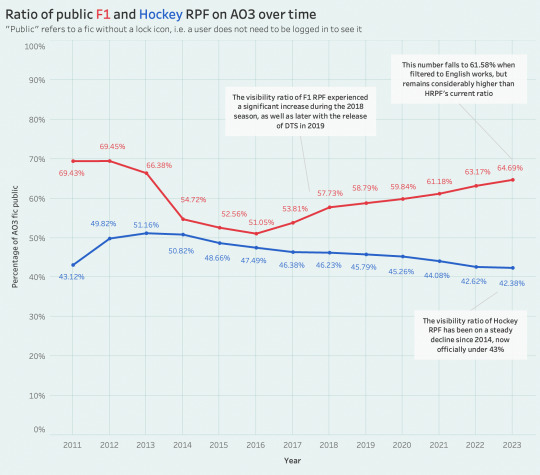
another thing i've long been curious about with f1 specifically is—because of how accessible dts and f1 driver marketing are to fans online, does f1 rpf and shipping culture skew a bit more "public" than other fandoms? i'd initially graphed the ratio of public fic on ao3 for hockey because i also wanted to see whether it was on the rise (again, apologies for how many callbacks and references there are in this post to hockey rpf... it's just easy for me to contextualize two familiar sports ficdoms together *__*), but i was surprised to see that it's actually been steadily trending downward for many years now. f1 fic, on the other hand, has steadily been becoming more public since 2016.
another note is that c-ficdom follows different fic-posting etiquette on ao3, and thus chinese-heavy sports rpf fandoms (think table tennis and speed skating) will feature a majority public fic—here's another old graph. since f1 fandom has a relatively larger representation of chinese writers than hockey does, its public ratio falls a little bit if you filter to english-only works, but as of 2023 it remains significantly higher than hockey's!
anyway, onto the actual ship graphing.
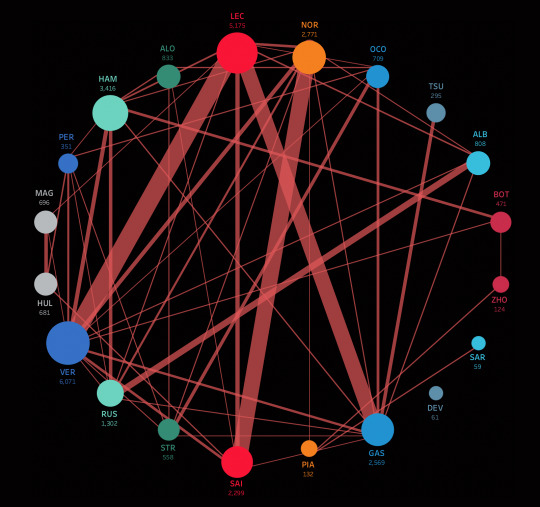
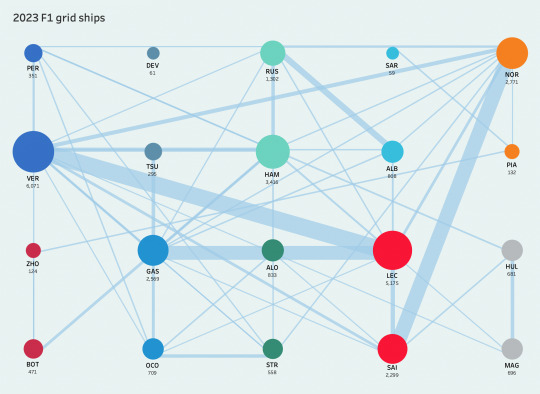
my ship collection process yielded 164 ships with 57 drivers, 46 of which have been in f1. all 20 current active f1 drivers have at least one ship with min. 5 fics, though not all of them had a ship that connected them to the 2023 grid. specifically, nyck de vries' only ship at time of collection was with stoffel vandoorne at 56 works.
once again because f1 is so strongly connected, i initially struggled a lot with how i wanted to graph all the ships i'd aggregated—visualizing all of them was just a mess of a million different overlapping edges, not the sprawling tree that branched out more smoothly from players like in hockey. this made me wonder whether it even made sense to graph anything at all... and tbh the jury is still out on whether these are interesting, but regardless here's a visualization of how the current grid is connected (color-coded by team)! i graphed a circular layout and then a "grid-like" layout just for variety lol.
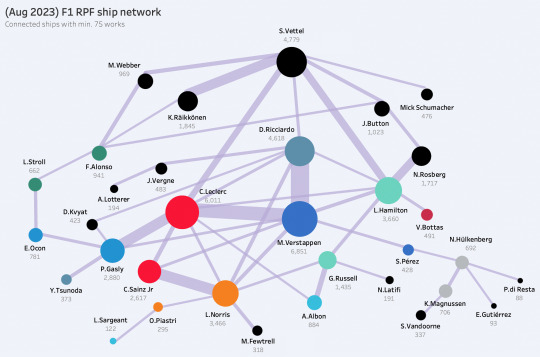
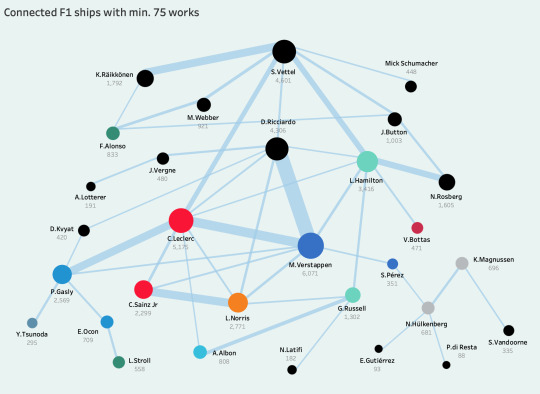
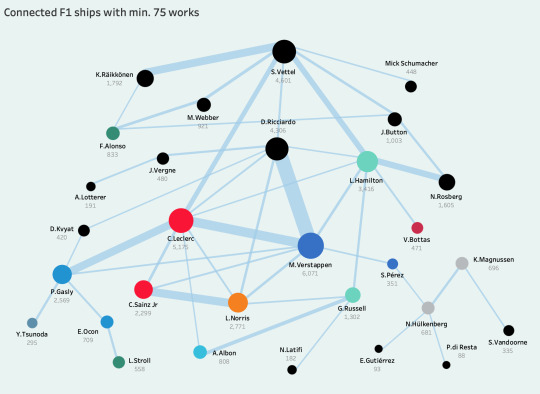
of course, i still wanted to explore how ships with ex-f1 drivers have branched out and show where they connect to drivers on the current grid, especially because not too long ago seb was very much the center of the ficdom ecosystem, and the (based purely on the numbers) segue to today's max/charles split didn't really come to fruition until the dts days. so here's a network of f1 ships with a minimum of 75 works on ao3:
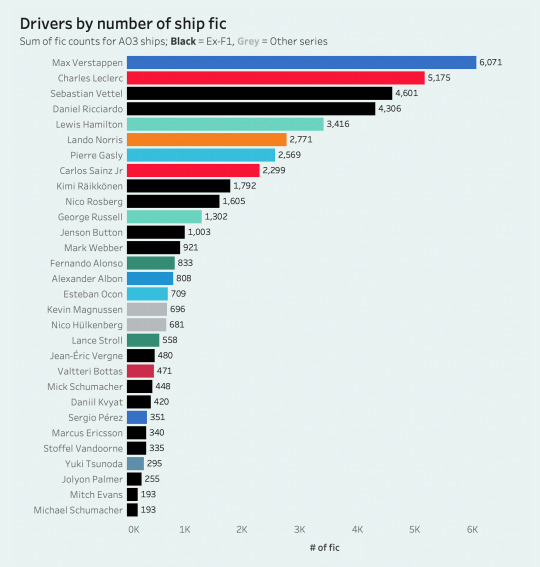
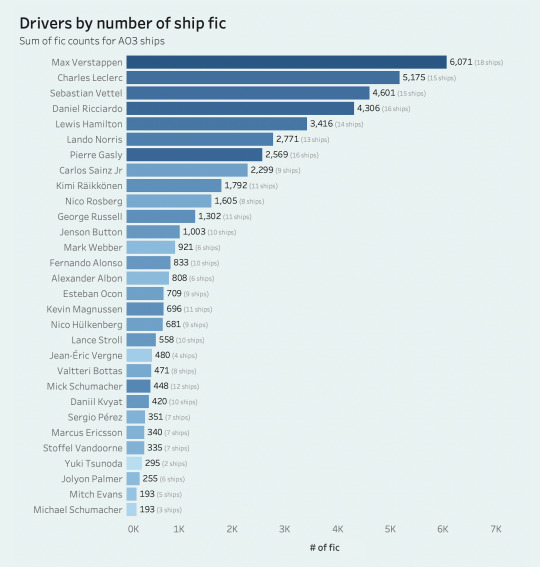
before i go into ship breakdowns, i also have a quick overview of the most "shippable" drivers, aka the drivers with the highest sum of fic from all their respective ships. the second bar chart is color-coded by the count of their unique ships to encapsulate who is more prone to being multi-shipped.
PART II. ship insights
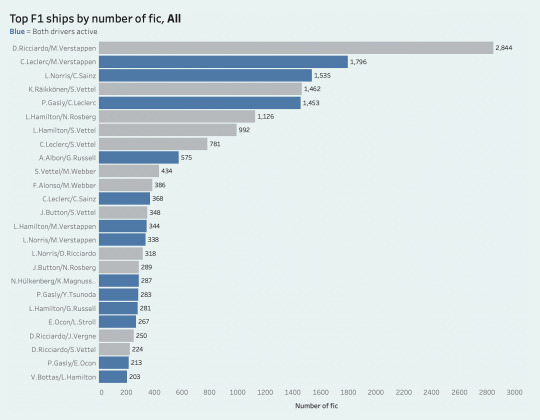
first let's take a look at the most popular f1 ships on ao3, again filtered to driver-only ships.
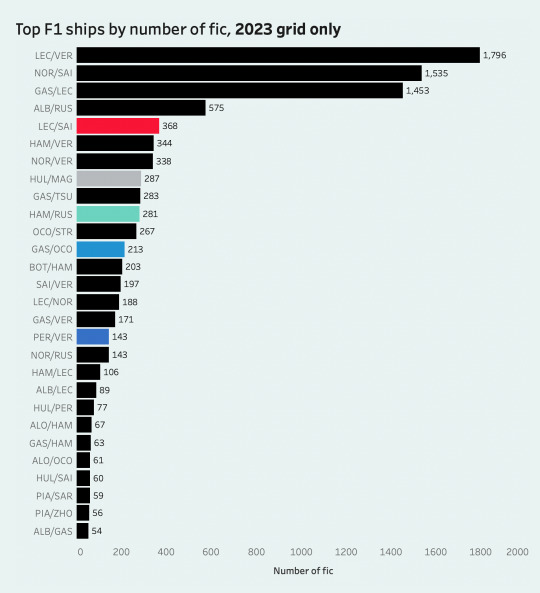
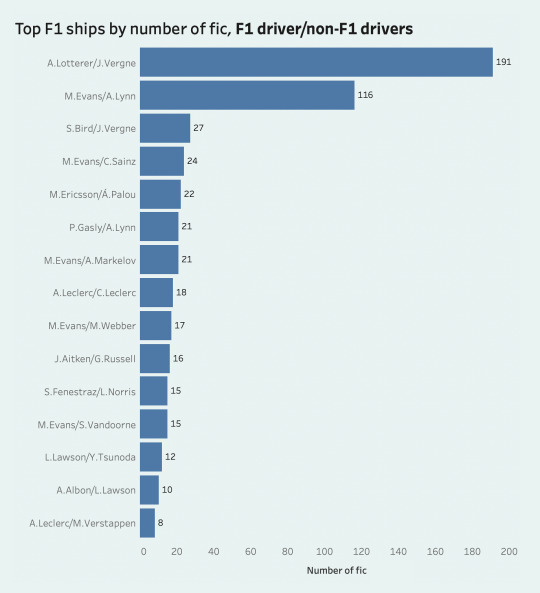
here's another graph filtered to the current grid only, and then one that shows the 15 ships where one driver isn't and has never been an f1 driver:
for this section, i ended up combining my ship data with a big f1 driver dataset that gave me information on each driver's birth year, points, wins, seasons in f1, nationality... etc., so that's what i'll be using in the rest of the post. disclaimer that i did have to tweak a few things and the data doesn't reflect the most recent races, so please note there might be some slight discrepancies in my visualizations.
anyway—in my hockey post i did a lot of set analysis because i was interested in figuring out what made the players who were part of the ship network different from the general population. with f1, since almost Every Driver has at least one ship and it's a much more representative group, doing a lot of set distributions wasn't that interesting and so i stuck more to pure ship analysis. still, the set isn't completely representative, which i noted by checking the ratios of driver nationalities in my dataset and then in the large database of f1 drivers i merged with (though filtered to debut year >= 2000 to maintain i guess the same "dimensions").
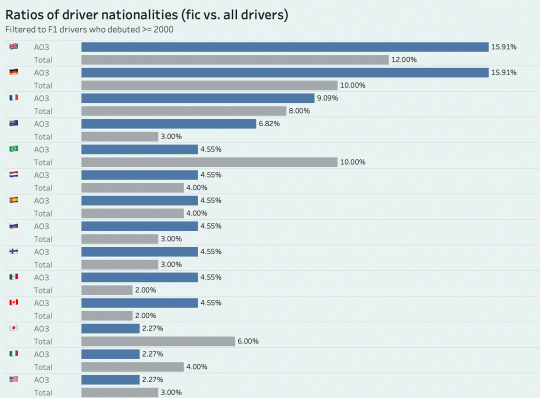
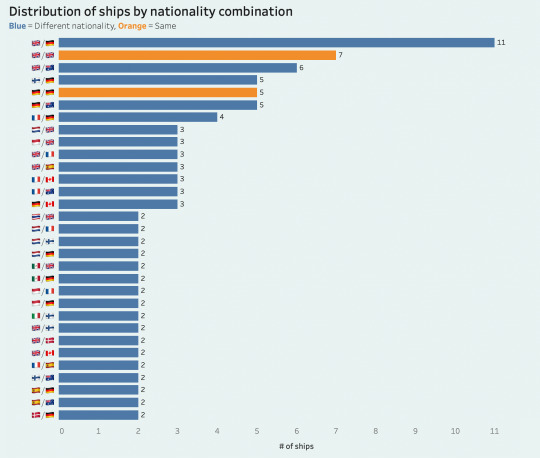
while british and german drivers have been the most common nationalities in f1 since 2000, both in general and in my ship data, it seems that ficdom slightly overrepresents/overships them and then underrepresents brazilian drivers. i was also curious to see the distribution of ships by nationality combination (which is actually quite diverse), and though it once again wasn't surprising that uk/germany was the most common combination given that we've just established the commonality of their driver groups, i found it somewhat interesting to realize just how many ships fall under this umbrella.
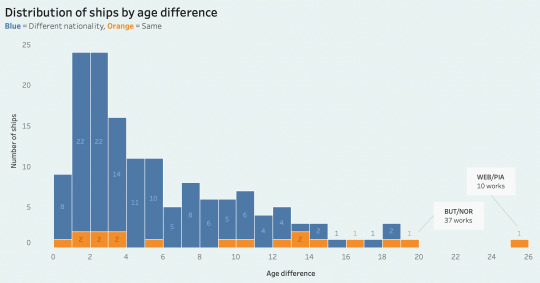
i then once again wanted to see what the distribution of age differences looked across ships. the ships i graphed yielded a range of 25 years, with the oldest age difference being 25 years between piastri and webber. tbh, something that's interesting to me about f1 ships is not just how connected current drivers are but also how there is a very strong aspect of cyclicality, wherein long careers in combination with well-established celebrity culture and post-retirement pivots to punditry & mentorship position drivers perfectly to still be easily shipped with any variety of upcoming drivers, hence why we encounter a relatively significant variety of age differences.
of the ships with two f1 drivers, 38% were within 2 years of each other, while 44% had an age difference of 5 years or more.
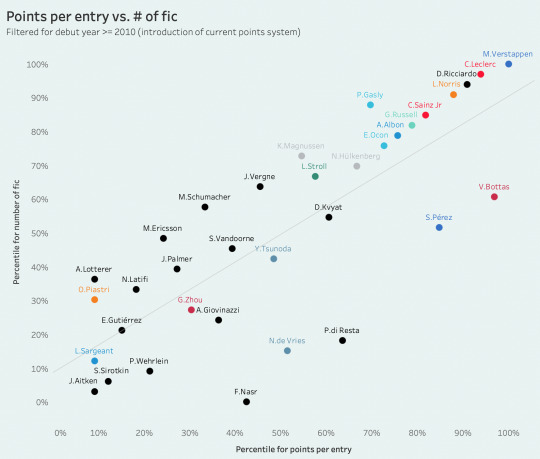
more experimentally (basically i wanted to use these performance metrics for something!), i tried graphing driver metrics against "shippability" to see whether i could uncover any trends, normalizing to percentile to make it more visually comprehensible.
one thing that was interesting to me is that there is a strong correlation between a driver's points per entry and their number of ship fic; really, this isn't surprising at all because it's basically a reflection of whether they've driven for a big 3 team, and we know that the most popular drivers are from big 3 teams, but then i guess it does become a bit of a chicken and egg question... which is something i'm continuously fascinated by when discussing success and talent in sports fandom, especially in a sport like f1 where there is so little parity and thus "points" do not always quantifiably translate to "talent," making it difficult to gauge why and when a driver's skill becomes consciously appealing to an audience. i don't know but here's that scatterplot.
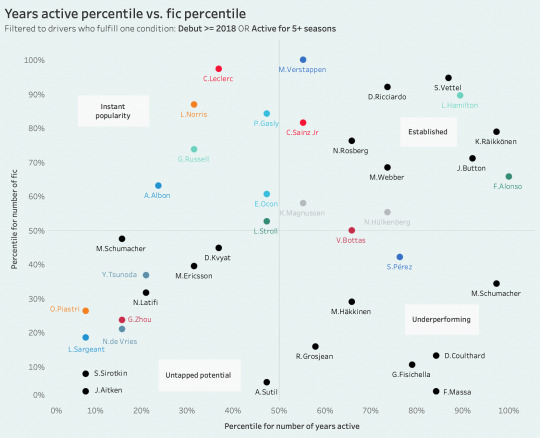
similarly, i also wanted to look at years active vs. fic to gauge which drivers have a High Number Of Ship Fic relative to how long they've actually been in f1, basically a rough rework of the "shippability above expected" metric i'd tried exploring in my old f1 post haha. because the set i merged with attributed 1 "year active" to a driver just like, filling in as reserve for a single race, and it also included drivers who maybe raced one season and then never raced again, but then i still wanted to include current rookies in their first season to show where their Potential lies... i settled on filtering to drivers who were or have been active for at least 5 seasons OR who debuted recently and thus have a bit of rookie leeway. there's a decent amount of correlation here, which is again... in f1, the underlying argument for remaining active for many years is that you have to be good enough to keep your seat, so it's expected that if drivers stay on the grid for a long time they will eventually accrue more fandom interest and thus ship fic. still, we can see some drivers who underperform a little relative to their establishedness—bot and per, interestingly also below the trend line in the points/entry graph–and then those who overperform a decent amount, like nor and lec.
this is somewhat interesting to me because i'd tried to make a similar scatterplot with my hockey set and found that there was... basically nooo correlation at all, but i also had to make do with draft year and not gp which i think might move the needle a little bit. regardless, it's just interesting to think about these things in the context of league/grid exclusivity and then other further nuances like the possibilities of making your niche in, for example, the nhl as a 4th line grinder or f1 as a de facto but reliable #2 driver for years down the stretch, and then how all of that impacts or shapes your fandom stock and shippability.
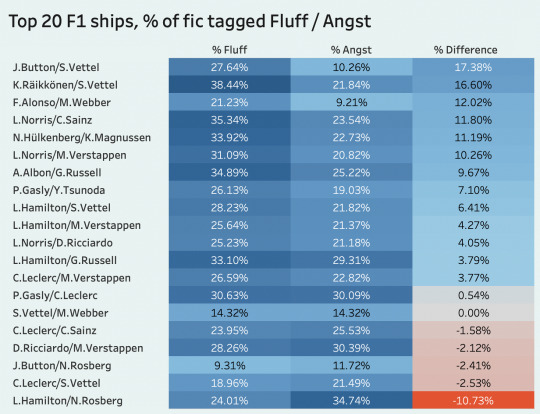
moving on, here's a look at the current top 20 f1 ships and how much of their fic is tagged as fluff or angst! out of all their fic, kimi/seb have the highest fluff ratio at 38.44%, while lewis/nico hold the throne for angst at 34.74%.
lewis/nico are also the most "holistically" tragic ship when you subtract their fluff and angst percentages (by a large margin as well), while jenson/seb are the fluffiest with a difference of 17.38%. really makes you think.
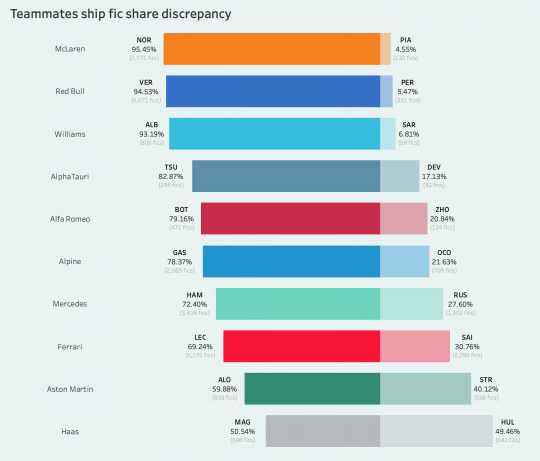
and finally this is a dumb iteration from my old f1 post but i thought this was kind of funny haha so: basically what if teammate point share h2h but the points are their shippability on ao3.
closing thoughts
that's really all i have! again, i don't know whether any of these graphs make sense or are interesting to anyone, but i had fun trying to adapt some of my hockey methodology to f1 and also revisiting the old f1 graphs i'd made last year and getting to recalculate/design them. i know there's a lot more i could have done in examining drivers' old teams since many ships are based on drivers being ex-teammates and not the current grid matchups, but it would have been too much of a headache to figure out so... this is the best i've got. thanks for reading :)
#f1#*m#stats#rpf /#i want to graph actual driver data again but the kaggle dataset i was using hasn't been updated in a while so i think i'll do a eoy version#with data from the full 2023 season... for the everlasting p/entry correlation
130 notes
·
View notes
Text
wonder if network inversion is against Kaggle's ToS...
18 notes
·
View notes