#aggregate statistical information
Explore tagged Tumblr posts
Visit Tumblr Blog
Explore Tumblr blogs with no restrictions, modern design and the best experience.
Last Seen Tumblr Blogs


Fun Fact
Total funding amounts to $125.3M.
Text
It's also morphed from what was the rate of suicide attempts to just suicide. It’s not ‘41% of transgender-identifying people attempt suicide’, it’s ‘will commit suicide’. The reality of ‘41%’ is neither, it is ‘41% of people who took the National Transgender Discrimination Survey in 2008 answered in the affirmative to a yes/no question about attempting suicide’ which succinctly describes a number that is effectively meaningless statistical noise from a 14-year old study, something that is much less interesting."
By Sue Donym Dec 22, 2024
A few years ago, in the early Neolithic, when I wasn’t banned from Medium, I wrote a post called ‘The Transgender Movement and Bad Stats: A Debunking Compilation’. I had collected a vast amount of statistics and written about them in some very lengthy articles, and thought it was a good idea to collect them together into a single post.
That article is now five years out of date. Medium also banned me for being a hater, so that article is currently only available online as an archived website. I also have some delicious new statistics to compile. An updated reference guide is in order, although some sections will remain relatively the same.
If sections of this article seem familiar to you, that’s probably because they are. I will openly confess to the fact that some of this article is taken from other articles and compiled into what you are currently reading. That’s more or less the point - to write something where the numbers are presented in a digestible format. I make no apologies for this - there are only so many ways to write ‘A says XY is B%’.
You don’t have to read all of this. The sections list below contains the names of each topic - you should be able to search each heading and read it.
I’m not overly fond of writing introductions, so without further ado, let’s dive in.
Sections:
Suicide Statistics - Is 41% A Real Figure?
Prison Statistics - Are trans women more likely to be sex offenders?
Murder Stats - The Fake Epidemic
Homelessness and The Problem with Aggregation
A Quick Funding Update
Conclusion
Suicide Statistics - Is 41% a real figure?
Participate in this debate long enough, and you’ll see the repeated claims that trans people attempt or commit suicide at extremely high rates. That number you’ll often see is ‘41%’. But where does it come from?
That 41% suicide statistic comes from a report done in 2014, based on data from 2008 in the National Transgender Discrimination Survey (NTDS), from the Williams Institute, part of UCLA School of Law. Here is a link to the William’s Institute report. Of course, they debunk their own statistic on the third page of the report. How convenient for me.
“While the NTDS provides a wealth of information about the experiences of transgender and gender non-conforming people, the survey instrument and methodology posed some limitations for this study. First, the NTDS questionnaire included only a single item about suicidal behavior that asked, “Have you ever attempted suicide?” with dichotomized responses of Yes/No. Researchers have found that using this question alone in surveys can inflate the percentage of affirmative responses, since some respondents may use it to communicate self-harm behavior that is not a “suicide attempt,” such as seriously considering suicide, planning for suicide, or engaging in self-harm behavior without the intent to die (Bongiovi-Garcia et al., 2009). The National Comorbity Survey, a nationally representative survey, found that probing for intent to die through in-person interviews reduced the prevalence of lifetime suicide attempts from 4.6 percent to 2.7 percent of the adult sample (Kessler et al., 1999; Nock & Kessler, 2006). Without such probes, we were unable to determine the extent to which the 41 percent of NTDS participants who reported ever attempting suicide may overestimate the actual prevalence of attempts in the sample. In addition, the analysis was limited due to a lack of follow-up questions asked of respondents who reported having attempted suicide about such things as age and transgender/gender non-conforming status at the time of the attempt.”
If that was too long for you to read - the question was asked as a ‘yes/no’ question. This has a well-known effect of overinflating the number of people who answer in the affirmative to the question ‘Have you ever attempted suicide?’. The NTDS asked the question in this manner and thus massively overinflated the estimated suicide rate in their sample. The ‘41'%’ number is statistical noise. Not only that, but the authors conclude that there’s no explanations available
“ Second, the survey did not directly explore mental health status and history, which have been identified as important risk factors for both attempted and completed suicide in the general population […] The lack of systematic mental health information in the NTDS data significantly limited our ability to identify the pathways to suicidal behavior among the respondents”
They don’t know why the rate is so high — so you can’t say 41% of transgender people attempt suicide because of ‘lack of acceptance’ or ‘bathroom bills or ‘Donald Trump’. Because the study didn’t ask those questions. That would be the case even if the study didn’t have even more major methodological problems anyway:
Third, since the NTDS utilized convenience sampling, it is unclear how representative the respondents are of the overall U.S. transgender/gender non-conforming adult population. Further, the survey’s focus on discrimination may have resulted in wider participation by persons who had suffered negative life experiences due to antitransgender bias.1 As the relationship between minority stress and mental health would suggest (Meyer, 2003), this may have contributed to a higher prevalence of negative outcomes, including lifetime suicide attempts, in the sample.
A convenience sample means the results are basically a cross between being indicative of a potential issue and waste of time. Essentially, the survey shows the rate of suicide attempts by those who took the survey, which means the results are only applicable to the survey-takers, rather than any broader group of people. This is a problem with all the National Center for Transgender Equality surveys even today - and they’re still treated as an authority on this subject. Total madness.
It’s like if I did a survey of all my friends on whether or not we prefer deep-dish. If I have one Irish person in my sample, and that person just loves deep-dish, I cannot then use the results of my survey to tell Newsweek that 100% of all Irish people love deep-dish. Only my friend does. Similarly, the original authors of the NTDS can say that their survey-takers had a 41% rate of attempted suicide, but they can’t apply the result to the broader demographic of whatever is considered' ‘transgender’ these days.
But unlike me, who did not run off to Newsweek to inform them that 100% of all Irish people love deep-dish, the National Center for Transgender Equality (NCTE), did in fact, tell anyone who would listen that ‘41% of trans people attempt suicide’. Activists, non-profits, politicians and mendacious pediatricians followed suit in telling anyone who would listen about ‘41%’, and it became completely divorced from its original context. ‘41%’ quickly took on a life of it’s own, and became an urban myth, a meme, no different from other statistical noise given life, like claims that ‘50% of lesbians beat their partners’, ‘Humans only use 10% of the brain’, ‘50% of cops are wife beaters’, the opium letter in the New England Journal of Medicine that ‘proved’ opiates ‘weren’t addictive’, and the concept of ‘excited delirium’.
All of those had morphed into adages, things widely accepted as true because ‘it was in a study’, or from being uncritically repeated in popular science outlets. They’re things that often have a grain of truth to them or affirm traditional beliefs, so they’re judged as ‘true enough.’ But they’re all falsehoods, just as much as ‘41%’ is, and all those falsehoods share a similar pattern, going from a random statistic in a poorly conducted survey or even just a case study and from there, gradually morphing into widely-accepted knowledge, even though no one really knows where it came from, nor has bothered to investigate it, because it matches with an agenda or traditionally held beliefs. Eventually, someone with a sense of inquiry to them looks into the statistic and finds that it’s false, but by that point it’s often done untold damage and will take decades to purge from the popular consciousness.
The suicide attempt statistic that started life as meaningless noise from a poorly conducted 2008 study with huge methodological flaws has now graduated from random apocrypha to religious dogma. That statistic, which objectively looks horrendous deprived of its original context, was used to justify a whole range of absurd propositions.
Give me absurd propositions X, Y, and Z, or it’s hateful and I’ll kill myself, trans people have a 41% suicide rate because of discrimination!’
Above is a fairly representative example of what the use of ‘41%’ turned into - completely misinformed people screaming histrionically about committing suicide because someone told a man to use the men’s room. Not only is that emotional abuse, it can only last for so long before people get sick of the absurdity. The suicide baiting rhetoric was always going to backfire, and it has done so in spectacular fashion.
Now 41% is used as a slang word for transgender suicide. The adage got repeated so often it turned into a meme, and then that meme became a threat, the demographically tailored 2024 version of ‘kys’1.
It's also morphed from what was the rate of suicide attempts to just suicide. It’s not ‘41% of transgender-identifying people attempt suicide’, it’s ‘will commit suicide’. The reality of ‘41%’ is neither, it is ‘41% of people who took the National Transgender Discrimination Survey in 2008 answered in the affirmative to a yes/no question about attempting suicide’ which succinctly describes a number that is effectively meaningless statistical noise from a 14-year old study, something that is much less interesting.
Now that it’s essentially well, a nasty threat - yes, telling someone to kill themselves for whatever reason is generally unpleasant behavior, sorry - the power of the statistic is reversed. It’s now used like this:
‘why would I let you into women’s prisons when you are going to kill yourself anyway, degenerate?’ 41% already you fucking troon pedophile, no one cares about the opinions of people who will be dead soon
Personally, I don’t know what to make of the evolution of ‘41%’. It’s gone from being a widely held false belief used to justify all sorts of terrible things to a demand that the trans-identifying person you disagree with should go kill themselves. It’s somehow even less constructive than it was before, which is certainly an achievement, albeit a dubious one.
Yes, transgenderism is a dangerous, illiberal cult full of misogyny, racism, and homophobia, but I don’t think it’s right to sacrifice my values when criticizing them - I can do that effectively without telling people to go and kill themselves. Would you tell someone in a similar situation - like a Scientologist, who is also part of a destructive and nasty cult to go and kill themselves?
See rest of article
#The Transgender Movement and Bad Stats: A Debunking Compilation#That 41% suicide statistic comes from a report done in 2014 based on data from 2008#Using suicide threats to emotionally blackmail others
72 notes
·
View notes
Text
Pretty regularly, at work, I ask ChatGPT hundreds of slightly different questions over the course of a minute or two.
I don't type out these individual questions, of course. They're constructed mechanically, by taking documents one by one from a list, and slotting each one inside a sandwich of fixed text. Like this (not verbatim):
Here's a thing for you to read: //document goes here// Now answer question XYZ about it.
I never read through all of the responses, either. Maybe I'll read a few of them, later on, after doing some kind of statistics to the whole aggregate. But ChatGPT isn't really writing for human consumption, here. It's an industrial machine. It's generating "data," on the basis of other "data."
Often, I ask it to write out a step-by-step reasoning process before answering each question, because this has been shown to improve the quality of ChatGPT's answers. It writes me all this stuff, and I ignore all of it. It's a waste product. I only ask for it because it makes the answer after it better, on average; I have no other use for it.
The funny thing is -- despite being used in a very different, more impersonal manner -- it's still ChatGPT! It's still the same sanctimonious, eager-to-please little guy, answering all those questions.
Fifty questions at once, hundreds in a few minutes, all of it in that same, identical, somewhat annoying brand voice. Always itself, incapable of tiring.
This is all billed to my employer at a rate of roughly $0.01 per 5,000 words I send to ChatGPT, plus roughly $0.01 per 3,750 words that ChatGPT writes in response.
In other words, ChatGPT writing is so cheap, you can get 375,000 words of it for $1.
----
OpenAI decided to make this particular "little guy" very cheap and very fast, maybe in recognition of its popularity.
So now, if you want to use a language model like an industrial machine, it's the one you're most likely to use.
----
Why am I making this post?
Sometimes I read online discourse about ChatGPT, and it seems like people are overly focused on the experience of a single human talking to ChatGPT in the app.
Or, at most, the possibility of generating lots of "content" aimed at humans (SEO spam, generic emails) at the press of a button.
Many of the most promising applications of ChatGPT involve generating text that is not meant for human consumption.
They go in the other direction: they take things from the messy, human, textual world, and translate them into the simpler terms of ordinary computer programs.
Imagine you're interacting with a system -- a company, a website, a phone tree, whatever.
You say or type something.
Behind the scenes, unbeknownst to you, the system asks ChatGPT 13 different questions about the thing you just said/typed. This happens almost instantaneously and costs almost nothing.
No human being will ever see any of the words that ChatGPT wrote in response to this question. They get parsed by simple, old-fashioned computer code, and then they get discarded.
Each of ChatGPT's answers ends in a simple "yes" or "no," or a selection from a similar set of discrete options. The system uses all of this structured, "machine-readable" (in the old-fashioned sense) information to decide what to do next, in its interaction with you.
This is the kind of thing that will happen, more and more.
710 notes
·
View notes
Text
Medical research has a major problem: an alarmingly high number of trials are based on fake, fraudulent or misinterpreted data.
Research misconduct sleuths call them “zombie” studies. They look like real research papers but they’re rotten to the core. And when these studies go on to influence clinical guidelines, that is, how patients are treated in hospitals and doctors’ rooms, they can be dangerous.
Professor Ben Mol, head of the Evidence-based Women’s Health Care Research Group at Monash University, is a professional zombie hunter. For years, he has warned that between 20 and 30 per cent of medical trials that inform clinical guidelines aren’t trustworthy.
“I’m surprised by the limited response from people in my field on this issue,” he says. “It’s a topic people don’t want to talk about.”
The peer review process is designed to ensure the validity and quality of findings, but it’s built on the assumption that data is legitimate.
Science relies on an honour system whereby researchers trust that colleagues have actually carried out the trials they describe in papers, and that the resulting data was collected with rigorous attention to detail.
But too often, once findings are queried, researchers can’t defend their conclusions. Figures such as former BMJ editor Richard Smith and Anaesthesia editor John Carlise argue it’s time to assume all papers are flawed or fraudulent until proven otherwise. The trust has run out.
“I think we have been naive for many years on this,” Mol says. “We are the Olympic Games without any doping checks.”
How bad science gets into the clinic
Untrustworthy papers may be the result of scientists misinterpreting their data or deliberately faking or plagiarising their numbers. Many of these “zombie” papers emerge from Egypt, Iran, India and China and usually crop up in lower-quality journals.
The problem gets bad when these poor-quality papers are laundered by systematic reviews or meta-analyses in prestigious journals. These studies aggregate hundreds of papers to produce gold-standard scientific evidence for whether a particular treatment works.
Often papers with dodgy data are excluded from systematic reviews. But many slip through and go on to inform clinical guidelines.

My colleague Liam Mannix has written about an example of this with the hormone progesterone. Official guidelines held that the hormone could reduce the risk of pre-term birth in women with a shortened cervix.
But those guidelines were based on a meta-analysis largely informed by a paper from Egypt that was eventually retracted due to concerns about the underlying data. When this paper was struck from the meta-analysis, the results reversed to suggest progesterone had no preventative effect.
There’s a litany of other examples where discounting dodgy data can fundamentally alter the evidence that shapes clinical guidelines. That’s why, in The Lancet’s clinical journal eClinical Medicine, Mol and his colleagues have reported a new way to weed out bad science before it makes it to the clinic.
Holding back the horde
The new tool is called the Research Integrity in Guidelines and evIDence synthesis (RIGID) framework. It mightn’t sound sexy, but it’s like a barbed-wire fence that can hold back the zombie horde.
The world-first framework lays out a series of steps researchers can take when conducting a meta analysis or writing medical guidelines to exclude dodgy data and untrustworthy findings. It involves two researchers screening articles for red flags.
“You can look at biologically implausible findings like very high success rates of treatments, very big differences between treatments, unfeasible birth weights. You can look at statistical errors,” says Mol.
“You can look at strange features in the data, only using rounded numbers, only using even numbers. There are studies where out of dozens of pairs of numbers, everything is even. That doesn’t happen by chance.”
A panel decides if a paper has a medium to high risk of being untrustworthy. If that’s the case, the RIGID reviewers put their concerns to the paper’s authors. They’re often met with stony silence. If authors cannot address the concerns or provide their raw data, the paper is scrapped from informing guidelines.
The RIGID framework has already been put to use, and the results are shocking.
In 2023, researchers applied RIGID to the International Evidence-based Guidelines for Polycystic Ovary Syndrome (PCOS), a long misunderstood and misdiagnosed syndrome that affects more than 1 in 10 women. As a much maligned condition, it was critical the guidelines were based on the best possible evidence.
In that case, RIGID discounted 45 per cent of papers used to inform the health guidelines.
That’s a shockingly high number. Those potentially untrustworthy papers might have completely skewed the guidelines.
Imagine, Mol says, if it emerged that almost half of the maintenance reports of a major airline were faked? No one would be sitting around waiting for a plane to crash. There would be swift action and the leadership of the airline sacked.
#australia#women's health#medical misogyny#radblr#this feels particularly important with the huge gender data gap in medicine and the cass review's findings of bad research in the UK
78 notes
·
View notes
Text
Writing about a place and want a better sense of what the climate is like and whether it's similar to places you're familiar with? Well have we got a resource for you!
This map has been created using The Global environmental stratification. The Global environmental stratification (GEnS), based on statistical clustering of bioclimate data (WorldClim). GEnS, consists of 125 strata, which have been aggregated into 18 global environmental zones (labeled A to R) based on the dendrogram.
How many cities are included? Oh...a whole lot...well over than 6,000...

And what information does it include?

So so so much information.
Wherever you want to write, this has got you covered. Check it out!
364 notes
·
View notes
Note
I'm curious if you've come across any examples of what you would consider effective communication or collective organizing around Covid? I know of a few groups who I think are doing good work to get people access to masks and rapid tests, making connections to broader issues such as lack of sick leave, barriers to healthcare etc, but they're also relying on things like questionable wastewater data extrapolation to make their points. I don't really know what to do about the latter issue, since we've just had access to all data taken away from us by the government. (I know it's not an effective tool for collective action, but tbh I also struggle with the idea that all alarmism is bad, because I am high risk and I am scared!)
well 1st of all to be clear, i think wastewater data are valuable and i do look at them. what i don't do is make wildly overconfident guesses from those data about exactly how many people are infected, how many sick people are standing in any given room, how many people will eventually qualify for a long covid dx, etc. i think wastewater data are a rough proxy but still an important one, and generally more useful at the local level (where they can be cross-referenced with factors like vaccine uptake, circulating variants, and municipal public health policy) than at national or regional levels (where the necessary amount of aggregation makes it difficult to tease out much useful information about any one town or city).
2nd, i don't know what country you live in but i do look in on CDC's covid dashboard, which includes data on hospitalisations, emergency department visits, deaths, vaccine uptake, test positivity rates, &c. if this is applicable to you i strongly encourage always reading the footnotes as these statistics vary in accuracy (in particular, test positivity rate is very unreliable at this point). i consider a lot of these numbers useful primarily as indicators of comparative risk: eg, i assume hospitalisation numbers have been inaccurate lowballs for the entirety of the pandemic; however, it is still useful imo to see whether that number is trending in a particular direction, and how it compares over time. again, local results are sometimes more helpful as well. i also glance in on the census bureau's household pulse survey results, which come out numerous times throughout the year and include questions about duration of covid symptoms, ability to function, and vaccine uptake. these numbers skew in the opposite direction to many of CDC's, because the phrasing of the covid questions is intended to be broad, and does not attempt to distinguish between the sort of long covid that entails a 6 or 12 month recovery period, vs the sort of long covid that turns out to be me/cfs or other chronic long-term post-viral complications. again, i still think these numbers are useful for viewing trends over time; no data will ever be completely 100% without flaw, and i'm not holding out for that. what does frustrate me, though, is people (with any and all ideological axes to grind!) interpreting any of these numbers as though they are in fact perfect flawless representations of reality, with no further caveats or critical analysis needed. that's what i'm pushing back on, whether it comes from the "pulse survey says long covid prevalence is decreasing, so fuck it!" crowd or the "biobot says last week was a micro-surge so we're all going to die!" crowd.
as far as local orgs or groups doing actual action, like distributing masks or vaccine clinics, i don't put so much stock in what they say on instagram or whatever because frankly i think it matters very little. the masks and vaccines and air filters and so forth are useful in themselves; that work is valuable. if someone's positioning themselves primarily as a communicator then yes, i'm going to scrutinise their communication methods more. if it's an action org i'm honestly less concerned, unless there is egregiously unreliable information being propagated or they're communicating in the sort of stigmatising manner that many peak Posters have adopted (people who got sick are stupid / immoral / deserve it, etc).
i'd also just like to make it clear that like... i live with someone who is at high risk, i accordingly treat my own covid precautions as though i am also at high risk, and i wouldn't want covid regardless... like, please understand that when i talk about this i'm not coming at it from a perspective of someone who's unaware of the need for caution! my concern is, again, that caution and risk discussion are not synonymous with "making frightened guesses and asserting them with 100% confidence" or "selectively attributing truth to data because they agree with me, regardless of the actual methodology and any problems therein". i understand that when people are behaving recklessly and being encouraged to do so by state and medical authorities, it is tempting to look at that situation and think that communicating the seriousness of the virus is worth risking a little bit of inaccuracy if it protects people. however, i do not think that strategy actually pays off in the long or short term as far as changing people's behaviour (if it did, wouldn't it have by now?) and i think it is playing with fire to encourage this manner of interpreting and disseminating scientific information as though it is a kind of ideological buffet requiring no further verification or investigation beyond a cherry-picked deference to the stated objectivity and ideals of The Scientific Method.
27 notes
·
View notes
Text
ppl don't understand moderation at scale and it shows
a lot of ppl on this website don't seem to understand tumblr is a pretty big website and big websites are hard to moderate.
like yeah it's obvious to you when there's a bad post that violates AUP or there's a perfectly good post that got incorrectly flagged. like duh. just ban terfs and don't ban transwomen.
but how many posts do you see a day, a thousand or so?
well it's a little harder when there are 13 million posts published per day, approximately 3-5% of them require moderation* (4% = 520k posts), and your automated tooling is anything less than 99.5% accurate (i.e. more than 1 misclassification every 200 posts). that accuracy would produce 2600 posts per day that require human review. if there are 4 human reviewers working 8h/day doing nothing but moderation, they'd have a budget of 44 seconds** to spend on reviewing a given post. and that's likely an underestimate of the workload***.
there are gonna be some mistakes. if you make your automated stuff less trigger happy, more bad things like terf shit falls through the cracks. if you make it more trigger happy, marginalized people start getting flagged for calling themselves faggots or posting boygirltits. if you rely less on automation, then you need humans; if you use humans, they cost a lot more, they're way slower, you're exposing more people to traumatic shit every day, and they're still gonna make mistakes.
to be clear: i think it's true that on aggregate, marginalized people are disproportionately affected by moderation mistakes. but that's not a tumblr-specific thing, and i don't think it's reasonable to expect tumblr, a 200-person company with 300 million monthly active users, to somehow solve a problem that none of twitter/facebook/reddit/youtube have managed to solve with literally thousands of engineers. should they do better? yes. absolutely. but that's not my point.
my point is: when you see the mistakes, i'm sitting here begging and pleading for you to consider it might be due to the logistical reality of social media moderation at scale rather than conspiracy or malice.
thanks 4 coming 2 my ted talk. footnotes under the cut.
*AFAIK Tumblr doesn't publicly report this statistic, so this is an informed under-guesstimate. On Reddit, 6% of all content was reported/flagged in 2021. I assume Tumblr and Reddit have similar enough content profiles for me to say "ehhh 3% lower bound, probably."
**Calculated by (60 / (P / (M * W * 60))) where P is number of posts to review, M is number of moderators, and W is hours worked per moderator per day. 60 / (2600 / (4 * 8 * 60)) ≈ 44.
***This is a reductive picture for the purpose of demonstrating scale. In real life, the calculus for how long can a moderator spend on a given post is more complicated because of things like prioritization for specific kinds of AUP violations (eg CSAM is higher priority than porn), classification accuracy that isn't uniform across categories (eg hit rate for gore is probably different from porn or hate speech), regulatory requirements (like mandatory reporting for CSAM and government takedown requests), different pipelines for user reports versus tool-based reports, yadda yadda. My goal is to show that even the underestimate is quite burdensome.
PS: I don't work for tumblr and I never have. I just work at a place that does things at scale and faces similar issues and I'm very passionate about online communities.
65 notes
·
View notes
Note
are there good journalists on the woho beat you'd recommend?
Sadly a big problem we have is that a lot of very good reporters end up not being able to stay in womens hockey for a long time because a lot of outlets haven’t had a dedicated space for it, and so much is changing, but here is who I think is the best that are consistently on in no order
Here are my recommendations!
Erica Ayala and her outlet Black Rosie Media I think is THE standard in women’s hockey. Ayala had done bylines for women’s hockey in various outlets and also appeared on a few different locked on networks which can be found in muckrack here
The Ice Garden is the longest running women’s hockey blog. It’s a rotating cast and I like some authors way more than others but I think if you’re just looking for start and probably has the most extensive coverage. It’s one of the only sources to get English language coverage of international league play and a lot of times players or former players will guess write. I am also a fan of the analytical work that An Nguyen has done, for example this article. Some stuff is paywalled, some isn’t, some is paywalled then becomes available later.
Kyle Cushman has recently been on the PWHL beat specifically, including some more long form / deeper look articles as well as being at practices with information, and I’ve enjoyed his work. He mainly writes for The Score
Christine Roger of Radio Canada is probably the main French Canadian reporter for the PWHL and team Canada
Hailey Salvian of The Athletic is usually pretty credible, tho it’s very clear that she is very careful not to be critical of her inside sources in the PWHL and I think had sometimes been a little bit of a PR arm she’s not going to say something straight up false or anything and is pretty in line with hockey reporters on that stuff. That said the athletic is usually paywalled and I really do not like the athletic as a paper overall just from a “owned by the New York times who is constantly spreading transphobic misinfo.” But if you just follow her socials and stuff you’ll get the breaking news and she’s usually accurate there.
Not a journalist but if you’re just looking for an aggregate of roster transactions and rumors pwhlreport on most platforms will do that for you, I’d say they’re accurate a solid 85% of the time and it’s little opinions or anything just who what when where and why
More statistical analysis than news but I enjoy Giants in the Crease for all things goaltenders and appreciate that they do a good job with the ncaa and international goalies as well
Women’s sports highlights on twitter will get you literally every single women’s hockey highlight from every tournament ever I swear it rules. Unfortunately am unsure if they’re on other platforms
I don’t think he’ll be writing anytime soon because of his new job, but if you want to get into the data world, the PWHL Montreal director of analytics Mikael Nahabedian has a substack page
EDIT: Karissa Donkin of CBC is a recent addition to the best I’ve enjoyed!
These are just some I like that I think do a good job of keeping it straight. Unfortunately I am limited by my own language barrier and haven’t found really anyone consistently covering the SDHL or other leagues in the English language that I’ve enjoyed, but if any of my followed from other countries have their own writers who I may be missing because of this language barrier please share
29 notes
·
View notes
Text
In the subject of data analytics, this is the most important concept that everyone needs to understand. The capacity to draw insightful conclusions from data is a highly sought-after talent in today's data-driven environment. In this process, data analytics is essential because it gives businesses the competitive edge by enabling them to find hidden patterns, make informed decisions, and acquire insight. This thorough guide will take you step-by-step through the fundamentals of data analytics, whether you're a business professional trying to improve your decision-making or a data enthusiast eager to explore the world of analytics.
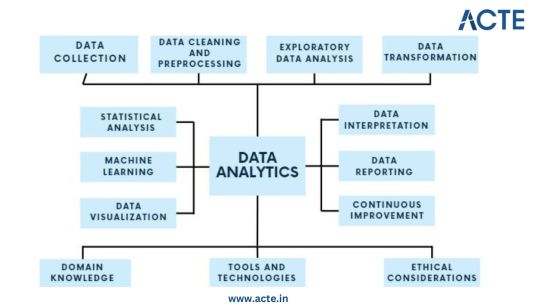
Step 1: Data Collection - Building the Foundation
Identify Data Sources: Begin by pinpointing the relevant sources of data, which could include databases, surveys, web scraping, or IoT devices, aligning them with your analysis objectives. Define Clear Objectives: Clearly articulate the goals and objectives of your analysis to ensure that the collected data serves a specific purpose. Include Structured and Unstructured Data: Collect both structured data, such as databases and spreadsheets, and unstructured data like text documents or images to gain a comprehensive view. Establish Data Collection Protocols: Develop protocols and procedures for data collection to maintain consistency and reliability. Ensure Data Quality and Integrity: Implement measures to ensure the quality and integrity of your data throughout the collection process.
Step 2: Data Cleaning and Preprocessing - Purifying the Raw Material
Handle Missing Values: Address missing data through techniques like imputation to ensure your dataset is complete. Remove Duplicates: Identify and eliminate duplicate entries to maintain data accuracy. Address Outliers: Detect and manage outliers using statistical methods to prevent them from skewing your analysis. Standardize and Normalize Data: Bring data to a common scale, making it easier to compare and analyze. Ensure Data Integrity: Ensure that data remains accurate and consistent during the cleaning and preprocessing phase.
Step 3: Exploratory Data Analysis (EDA) - Understanding the Data
Visualize Data with Histograms, Scatter Plots, etc.: Use visualization tools like histograms, scatter plots, and box plots to gain insights into data distributions and patterns. Calculate Summary Statistics: Compute summary statistics such as means, medians, and standard deviations to understand central tendencies. Identify Patterns and Trends: Uncover underlying patterns, trends, or anomalies that can inform subsequent analysis. Explore Relationships Between Variables: Investigate correlations and dependencies between variables to inform hypothesis testing. Guide Subsequent Analysis Steps: The insights gained from EDA serve as a foundation for guiding the remainder of your analytical journey.
Step 4: Data Transformation - Shaping the Data for Analysis
Aggregate Data (e.g., Averages, Sums): Aggregate data points to create higher-level summaries, such as calculating averages or sums. Create New Features: Generate new features or variables that provide additional context or insights. Encode Categorical Variables: Convert categorical variables into numerical representations to make them compatible with analytical techniques. Maintain Data Relevance: Ensure that data transformations align with your analysis objectives and domain knowledge.
Step 5: Statistical Analysis - Quantifying Relationships
Hypothesis Testing: Conduct hypothesis tests to determine the significance of relationships or differences within the data. Correlation Analysis: Measure correlations between variables to identify how they are related. Regression Analysis: Apply regression techniques to model and predict relationships between variables. Descriptive Statistics: Employ descriptive statistics to summarize data and provide context for your analysis. Inferential Statistics: Make inferences about populations based on sample data to draw meaningful conclusions.
Step 6: Machine Learning - Predictive Analytics
Algorithm Selection: Choose suitable machine learning algorithms based on your analysis goals and data characteristics. Model Training: Train machine learning models using historical data to learn patterns. Validation and Testing: Evaluate model performance using validation and testing datasets to ensure reliability. Prediction and Classification: Apply trained models to make predictions or classify new data. Model Interpretation: Understand and interpret machine learning model outputs to extract insights.
Step 7: Data Visualization - Communicating Insights
Chart and Graph Creation: Create various types of charts, graphs, and visualizations to represent data effectively. Dashboard Development: Build interactive dashboards to provide stakeholders with dynamic views of insights. Visual Storytelling: Use data visualization to tell a compelling and coherent story that communicates findings clearly. Audience Consideration: Tailor visualizations to suit the needs of both technical and non-technical stakeholders. Enhance Decision-Making: Visualization aids decision-makers in understanding complex data and making informed choices.
Step 8: Data Interpretation - Drawing Conclusions and Recommendations
Recommendations: Provide actionable recommendations based on your conclusions and their implications. Stakeholder Communication: Communicate analysis results effectively to decision-makers and stakeholders. Domain Expertise: Apply domain knowledge to ensure that conclusions align with the context of the problem.
Step 9: Continuous Improvement - The Iterative Process
Monitoring Outcomes: Continuously monitor the real-world outcomes of your decisions and predictions. Model Refinement: Adapt and refine models based on new data and changing circumstances. Iterative Analysis: Embrace an iterative approach to data analysis to maintain relevance and effectiveness. Feedback Loop: Incorporate feedback from stakeholders and users to improve analytical processes and models.
Step 10: Ethical Considerations - Data Integrity and Responsibility
Data Privacy: Ensure that data handling respects individuals' privacy rights and complies with data protection regulations. Bias Detection and Mitigation: Identify and mitigate bias in data and algorithms to ensure fairness. Fairness: Strive for fairness and equitable outcomes in decision-making processes influenced by data. Ethical Guidelines: Adhere to ethical and legal guidelines in all aspects of data analytics to maintain trust and credibility.

Data analytics is an exciting and profitable field that enables people and companies to use data to make wise decisions. You'll be prepared to start your data analytics journey by understanding the fundamentals described in this guide. To become a skilled data analyst, keep in mind that practice and ongoing learning are essential. If you need help implementing data analytics in your organization or if you want to learn more, you should consult professionals or sign up for specialized courses. The ACTE Institute offers comprehensive data analytics training courses that can provide you the knowledge and skills necessary to excel in this field, along with job placement and certification. So put on your work boots, investigate the resources, and begin transforming.
24 notes
·
View notes
Text
Understanding the Bihar Board Online Result System: Key Features and Benefits
Bihar Board Online Result The Bihar School Examination Board (BSEB) is responsible for carrying out examinations for college students in Bihar, India, particularly at the secondary and higher secondary levels. With the growing digitization of training, the procedure of checking consequences has also advanced notably. This article will delve into the web end result machine of the Bihar Board, its importance, and the implications for students and the training gadgets in Bihar.


Introduction to the Bihar School Examination Board
It conducts examinations for the tenth and twelfth grades, ensuring that scholars acquire high-quality schooling and are evaluated fairly. The board additionally oversees the academic curriculum, develops syllabi, and facilitates instructional programs across the kingdom.
Importance of Online Results
In the beyond, students needed to wait for weeks to get hold of their examination effects through conventional methods, which often concerned bodily verification at schools or examination facilities. The creation of online outcomes has revolutionized this procedure, offering numerous benefits:
Accessibility
Students can get the right of entry to their consequences from everywhere with an internet connection, getting rid of the want to travel to colleges or exam centers.
Timeliness
Online results are commonly introduced directly, permitting college students to test their performance right away after the board formally releases the outcomes.
Transparency
The online gadget reduces the chances of discrepancies and mistakes in the end result announcement. Students can confirm their marks independently, leading to more agreement within the examination manner.
Convenience
The online platform can cope with massive volumes of site visitors, enabling college students dads and moms to get entry to effects without lengthy queues or delays.
How to Check Bihar Board Results Online
Checking the Bihar Board consequences online is an honest method. Here’s a step-by-step guide:
Visit the Official Website: Students need to go to the reliable BSEB website (biharboardonline.Bihar.Gov.In) at the result statement day.
Navigate to the Results Section
On the homepage, there is usually a committed segment for examination outcomes. Click on the applicable link for the 10th or 12th-grade outcomes.
Enter Required Information
Students need to enter precise information, which includes their roll range, registration variety, and date of delivery. This record enables the system to retrieve appropriate effects for the pupil.
Submit the Information
After coming into the specified details, click on the "Submit" button. The system will technique the facts and display the consequences.
Download or Print
Once the consequences are displayed, college students can download the scorecard or take a printout for Destiny reference.
Understanding the Result Format
The end result sheet typically carries numerous crucial pieces of statistics, together with:
Student Name: The complete call of the candidate.
Roll Number: The unique identity variety assigned to the student.
Subject-clever Marks: The rankings acquired in each subject, often at the side of the maximum marks for every.
Total Marks: The aggregate rating calculated from all subjects.
Grade/Percentage: The typical grade or percent performed by using the scholar.
Status: A skip or fail indication, based on the pupil's performance.
Grading System and Evaluation
The Bihar Board employs a grading machine to evaluate scholars' overall performance. Each issue's marks are transformed into grades, which offer a clearer understanding of the scholar's usual performance. This system encourages students to achieve higher grades while minimizing the stigma associated with failure.
Post-Result Activities: After the effects are declared, several crucial activities are observed:
Re-assessment and Scrutiny: Students who are disappointed with their marks have the option to apply for re-assessment or scrutiny of their answer sheets. This procedure involves a fee and calls for college students to put up an application within a stipulated time.
Admission to Higher Studies
The consequences substantially have an effect on students' next steps, specifically those finishing their higher secondary schooling. Students need to be trying to find admission to schools or universities, frequently primarily based on their overall performance inside the board assessments.
Career Counseling
Many faculties and educational establishments provide counseling sessions for college kids post-results, assisting them in making informed selections approximately their instructional and career paths.
Challenges Faced: Despite the benefits of the online result machine, challenges persist:
Technical Issues:
On result days, the professional internet site regularly reports heavy visitors, which could result in gradual loading instances or transient outages, frustrating students keen to check their results.
Digital Divide:
Not all college students have the same get entry to to the net or virtual devices, main to disparities in the potential to check outcomes online. This gap can disproportionately have an effect on students from rural or economically deprived backgrounds.
Fraudulent Activities:
There have been times of people or corporations attempting to exploit students with the aid of offering unofficial or manipulated outcomes. Students must rely simply on the legitimate BSEB internet site for true effects.
Future of Result Declaration
As generation continues to adapt, the Bihar Board may not forget further improvements to the online result machine, which include:
Mobile Applications:
Developing devoted cell apps to facilitate easier admission to consequences and educational resources.
SMS Services:
Implementing SMS-primarily based end result services for college students without net access.
Integrated Platforms:
Creating a comprehensive educational portal that consists of assets for examination practice, counseling, and more.
2 notes
·
View notes
Text
The Skills I Acquired on My Path to Becoming a Data Scientist
Data science has emerged as one of the most sought-after fields in recent years, and my journey into this exciting discipline has been nothing short of transformative. As someone with a deep curiosity for extracting insights from data, I was naturally drawn to the world of data science. In this blog post, I will share the skills I acquired on my path to becoming a data scientist, highlighting the importance of a diverse skill set in this field.
The Foundation — Mathematics and Statistics
At the core of data science lies a strong foundation in mathematics and statistics. Concepts such as probability, linear algebra, and statistical inference form the building blocks of data analysis and modeling. Understanding these principles is crucial for making informed decisions and drawing meaningful conclusions from data. Throughout my learning journey, I immersed myself in these mathematical concepts, applying them to real-world problems and honing my analytical skills.
Programming Proficiency
Proficiency in programming languages like Python or R is indispensable for a data scientist. These languages provide the tools and frameworks necessary for data manipulation, analysis, and modeling. I embarked on a journey to learn these languages, starting with the basics and gradually advancing to more complex concepts. Writing efficient and elegant code became second nature to me, enabling me to tackle large datasets and build sophisticated models.
Data Handling and Preprocessing
Working with real-world data is often messy and requires careful handling and preprocessing. This involves techniques such as data cleaning, transformation, and feature engineering. I gained valuable experience in navigating the intricacies of data preprocessing, learning how to deal with missing values, outliers, and inconsistent data formats. These skills allowed me to extract valuable insights from raw data and lay the groundwork for subsequent analysis.
Data Visualization and Communication
Data visualization plays a pivotal role in conveying insights to stakeholders and decision-makers. I realized the power of effective visualizations in telling compelling stories and making complex information accessible. I explored various tools and libraries, such as Matplotlib and Tableau, to create visually appealing and informative visualizations. Sharing these visualizations with others enhanced my ability to communicate data-driven insights effectively.

Machine Learning and Predictive Modeling
Machine learning is a cornerstone of data science, enabling us to build predictive models and make data-driven predictions. I delved into the realm of supervised and unsupervised learning, exploring algorithms such as linear regression, decision trees, and clustering techniques. Through hands-on projects, I gained practical experience in building models, fine-tuning their parameters, and evaluating their performance.
Database Management and SQL
Data science often involves working with large datasets stored in databases. Understanding database management and SQL (Structured Query Language) is essential for extracting valuable information from these repositories. I embarked on a journey to learn SQL, mastering the art of querying databases, joining tables, and aggregating data. These skills allowed me to harness the power of databases and efficiently retrieve the data required for analysis.

Domain Knowledge and Specialization
While technical skills are crucial, domain knowledge adds a unique dimension to data science projects. By specializing in specific industries or domains, data scientists can better understand the context and nuances of the problems they are solving. I explored various domains and acquired specialized knowledge, whether it be healthcare, finance, or marketing. This expertise complemented my technical skills, enabling me to provide insights that were not only data-driven but also tailored to the specific industry.
Soft Skills — Communication and Problem-Solving
In addition to technical skills, soft skills play a vital role in the success of a data scientist. Effective communication allows us to articulate complex ideas and findings to non-technical stakeholders, bridging the gap between data science and business. Problem-solving skills help us navigate challenges and find innovative solutions in a rapidly evolving field. Throughout my journey, I honed these skills, collaborating with teams, presenting findings, and adapting my approach to different audiences.
Continuous Learning and Adaptation
Data science is a field that is constantly evolving, with new tools, technologies, and trends emerging regularly. To stay at the forefront of this ever-changing landscape, continuous learning is essential. I dedicated myself to staying updated by following industry blogs, attending conferences, and participating in courses. This commitment to lifelong learning allowed me to adapt to new challenges, acquire new skills, and remain competitive in the field.
In conclusion, the journey to becoming a data scientist is an exciting and dynamic one, requiring a diverse set of skills. From mathematics and programming to data handling and communication, each skill plays a crucial role in unlocking the potential of data. Aspiring data scientists should embrace this multidimensional nature of the field and embark on their own learning journey. If you want to learn more about Data science, I highly recommend that you contact ACTE Technologies because they offer Data Science courses and job placement opportunities. Experienced teachers can help you learn better. You can find these services both online and offline. Take things step by step and consider enrolling in a course if you’re interested. By acquiring these skills and continuously adapting to new developments, they can make a meaningful impact in the world of data science.
#data science#data visualization#education#information#technology#machine learning#database#sql#predictive analytics#r programming#python#big data#statistics
14 notes
·
View notes
Text
Can statistics and data science methods make predicting a football game easier?
Hi,
Statistics and data science methods can significantly enhance the ability to predict the outcomes of football games, though they cannot guarantee results due to the inherent unpredictability of sports. Here’s how these methods contribute to improving predictions:

Data Collection and Analysis:
Collecting and analyzing historical data on football games provides a basis for understanding patterns and trends. This data can include player statistics, team performance metrics, match outcomes, and more. Analyzing this data helps identify factors that influence game results and informs predictive models.
Feature Engineering:
Feature engineering involves creating and selecting relevant features (variables) that contribute to the prediction of game outcomes. For football, features might include team statistics (e.g., goals scored, possession percentage), player metrics (e.g., player fitness, goals scored), and contextual factors (e.g., home/away games, weather conditions). Effective feature engineering enhances the model’s ability to capture important aspects of the game.
Predictive Modeling:
Various predictive models can be used to forecast football game outcomes. Common models include:
Logistic Regression: This model estimates the probability of a binary outcome (e.g., win or lose) based on input features.
Random Forest: An ensemble method that builds multiple decision trees and aggregates their predictions. It can handle complex interactions between features and improve accuracy.
Support Vector Machines (SVM): A classification model that finds the optimal hyperplane to separate different classes (e.g., win or lose).
Poisson Regression: Specifically used for predicting the number of goals scored by teams, based on historical goal data.
Machine Learning Algorithms:
Advanced machine learning algorithms, such as gradient boosting and neural networks, can be employed to enhance predictive accuracy. These algorithms can learn from complex patterns in the data and improve predictions over time.
Simulation and Monte Carlo Methods:
Simulation techniques and Monte Carlo methods can be used to model the randomness and uncertainty inherent in football games. By simulating many possible outcomes based on historical data and statistical models, predictions can be made with an understanding of the variability in results.
Model Evaluation and Validation:
Evaluating the performance of predictive models is crucial. Metrics such as accuracy, precision, recall, and F1 score can assess the model’s effectiveness. Cross-validation techniques ensure that the model generalizes well to new, unseen data and avoids overfitting.
Consideration of Uncertainty:
Football games are influenced by numerous unpredictable factors, such as injuries, referee decisions, and player form. While statistical models can account for many variables, they cannot fully capture the uncertainty and randomness of the game.
Continuous Improvement:
Predictive models can be continuously improved by incorporating new data, refining features, and adjusting algorithms. Regular updates and iterative improvements help maintain model relevance and accuracy.
In summary, statistics and data science methods can enhance the ability to predict football game outcomes by leveraging historical data, creating relevant features, applying predictive modeling techniques, and continuously refining models. While these methods improve the accuracy of predictions, they cannot eliminate the inherent unpredictability of sports. Combining statistical insights with domain knowledge and expert analysis provides the best approach for making informed predictions.

3 notes
·
View notes
Text
[LET'S TALK WRITING] - FANFICTION STATS - UPDATE
Hello, hello! I hope you’re all doing well.
As you may have seen, I recently (by which I mean, months ago lol, time flies) received this anon as part of a truth or dare tag game daring me to share my AO3 stats.
If you’ve been following me for a while, you might remember that I already posted a detailed analysis of my fanfiction stats back in January 2023 (which you can read in full here). However, I thought this anon would be a great opportunity to revisit that post, review my stats again over 18 months later, and see what has changed.
General disclaimer: All the disclaimers from my original post still apply (I’m not an expert, avoid this if stats aren’t your thing, I’m very fortunate, my methodology isn’t perfect, etc.). I won’t be repeating much of the previous analysis but will focus on the changes over the past 18 months. I recommend reading both posts together for the full picture.

.
GENERAL OVERVIEW
As of the day of writing, 29 June 2024, here are my general stats as they are made available to me by AO3. I am including the same screenshot dated 25 January 2023 (from my old post) for comparison.


So, what can we see?
I wrote 183,191 words in 18 months, which is terrifying. Per Nano standards, that’s three novels and a bit.
Last year, I’d commented on my subscriber count being relatively “low” - that’s still the case. I think the reasons I speculated about last year remain valid, and I still find the smaller number somewhat reassuring.
I’ve gained a pretty sizeable chunk everywhere, so thank you all, haha, that’s thanks to you.
As of the day of writing, 25 January 2022, here are my general stats as they are made available to me by FFN. I am including the same screenshot dated 25 January 2023 (from my old post) for comparison.


As most of you know, I don’t really use FFN much anymore, so it's not surprising that the numbers there are quite low. The only thing I still update on FFN is castles, which still gets some readership.
There's a historical difference between my FFN and AO3 catalogues. When I transitioned to AO3 in 2013/2014, I only moved content I deemed "worth" transferring. So, there's work on FFN that isn't on AO3. Similarly, I now post all my one-shots exclusively on AO3. This explains some of the discrepancies you'll see later between the two platforms.
Interestingly, my AO3 word count has finally surpassed my FFN word count, and this is even before posting chapter 22 of castles on FFN (ugh, this is on my to-do list for this week, I swear). So, yay! I’m officially more of an AO3 girlie.
.
GETTING THE FFN STATS OUT OF THE WAY
I think we can all agree that AO3 has now surpassed FFN as a website (though I do have issues with AO3, I won’t lie), so I will focus most of this post on AO3 stats and beyond. However, I will say that as a platform, FFN provides authors with much better statistics than AO3 does. That is because they’ve fallen into a capitalist hellscape and probably sell all of our data to advertisers but … you know. As such, while I don’t want to spend too much time on these, I still think there are a few things we can learn.
I will go into my top fics on FFN v. top fics on AO3 and why I think they differ in a later section. But at this point, I’d like to focus on two things:
The Country Breakdown:
To me, this remains the most interesting feature on FFN, that you don’t get on AO3. Unfortunately, it only gives you this information on a monthly basis (you can’t aggregate the top countries of all time), so the below includes last year's screenshot (January 2023) and this year's (June 2024). Both were taken at the end of the month, so I reckon they're relatively representative.
(views are blue, visitors are yellow. for an explanation on the difference between views and visitors, see here. this is cumulative of all fics i have published, but ffn gives you the ability to break it down per fic if you’d like)


Thoughts: The first thing that stands out to me is that my overall view count on FFN has plummeted over the past 18 months. Initially, I thought this might be due to a general decline in FFN's usage, but when I look back at my February 2024 stats, they match what I saw in January 2023. This suggests the decline is more likely due to my not posting castles for four months, rather than anything else.
All the other conclusions I drew in my old post still hold true.
Interestingly, the top five countries for my readership almost perfectly align with our top countries for the podcast. This correlation makes me think AO3 stats (if available) would show a similar pattern. It raises the question of which drives which: are the podcast stats like this because of my fanfic audience demographics, or is my audience shaped by the podcast's reach? Or, is it that just generally, English speaking countries are more likely to consume English-language media and/or be in fandom? It's an intriguing chicken-and-egg scenario.
The Chapter by Chapter Breakdown:
i am selecting here January 2023 and March 2024. March is the last month where I posted on FFN, so it's more interesting to study that one.


Let me know if you spot anything else in these screenshots, but here’s what stands out to me:
The numbers are generally eerily similar
Drop-off after Chapter 3: There seems to be a more noticeable drop-off in readership after Chapter 3 compared to previous data. This makes sense because that’s when Hinny break up, so hardcore shippers might rage-quit at that point. However, after Chapter 3, the decline isn’t as steep, indicating that if people stick around past that point, they’re generally committed for the full ride.
Uptick in Latest Chapters: In both cases, there’s an increase in readership for the latest chapters. This could be due to FFN update notifications, which have been unreliable. It’s possible that people are finally receiving emails and catching up on the last 2-3 chapters they missed. But this is just a hypothesis.
.
MOVING ON TO AO3
Unlike last year, I’m going to stick to HP here, because I don’t think anyone cares about my stats in other fandoms, but please let me know if you’d like a detailed breakdown of that as well. Also, I'll just repeat that this acknowledgement still stands.


I think the only thing really notable here is that in 18 months, almost everything on castles has more or less doubled, if not more. I'll write more about that below, but I don't necessarily think this means my audience has doubled.
Regarding the kudos/hits extension, I wrote this last year:

My hits/kudos ratio was a lot worse on non-HP fandoms, which is still the case. When it comes to the second point, this also seems to still be the case, with a couple of things to note:
the rare firing of wild cannons is still an outlier. I think for the same reasons exposed above.
ce ne sont que des cailloux has "finally" come down to that 8-11% range all my other one shots seem to be in. I'm not sure how to explain it. As you'll see below, it hasn't gained/lost that much more traffic/kudos this year compared to previous ones, so I really don't know.
As I'd predicted, louisville is now also in that range.
vicious as roman rule has seen a dramatic drop. I wonder if this is because it was posted at the end of 2022, so relatively close to my first post, and was the thus artificially high? I think this is a fic that is very linked to castles (although it can be read as a standalone) and it's also a bit unusual (written in future tense) so maybe that's why people don't "like" it? we only said goodbye with words seems to be the only other fic in that range, and that one is also very linked to castles. It could be the result of people clicking in, realising they haven't read the wider story and don't understand much, and clicking out.
Regarding "secret" bookmarks:
Bookmarks on AO3 are a way to "save" fics on your profile. People use this feature in various ways:
Tracking Reads: Some use bookmarks to track all the fics they’ve read.
Recommendation Lists: Others use bookmarks to build recommendation lists with varying levels of detail. For example, some treat bookmarks like Goodreads reviews, adding comments such as "2/5 fic, do not recommend," while others might simply tag the fics or note why they liked them.
Additionally, AO3 allows users to "secretly" bookmark fics. These private bookmarks are only visible to the user who created them and do not appear on their public bookmark list. I personally use private bookmarks as a TBR list for fics I plan to read but am not ready to recommend yet.
As an author, you can see the total count of both private and public bookmarks (though you can’t read/know who left the private ones). This is why, for instance, my public bookmark count on castles is 279, while the combined private and public count is 417.
From my observations, about 40% of all bookmarks on fics are private. This holds true even for castles. I know that for long works, lots of people assume that the "secret" bookmarks are people bookmarking "TBR when finished" but the numbers seem to suggest otherwise. Castles does not have a disproportionately high number of private bookmarks compared to my other fics. It seems that private bookmarks are in fact just generally used as TBRs (long works or not) or by people who prefer to leave more "honest" personal reviews without the author seeing them, which is perfectly fair.
.
MY TOP FICS, AND WHAT THEY CAN TEACH US
Top 5 FFN (by favourites):

This is last year’s screenshot. For this year, you’re going to have to take my word for it because the filter no longer works (thanks ffnet lol).
As of 29 June 2024, the top includes the same fics, but in a different order: (1) Castles, (2) Cannonballs, (3) Slipped, (4) The Things That Will Likes, (5) Before.
It's interesting to me that slipped has come up two places and I've only had one extra review for it in the past 18 months.
Top 5 AO3 (by kudos):


Interestingly, no changes in the top 5 between January 2023 and now, bar from the fact that the gap between castles has widened.
Thoughts: I was re-reading my thoughts from last year, I’m just going to copy and paste here because everything more or less tracks.

Slipped is now on par on both sites but I think everything else tracks.

A couple things to note:
Interestingly, while it has a similar number of hits (21.5k on AO3 and 20.4k on FFN), castles does a lot better on AO3 than on FFN (...)
In the past 18 months, the difference between hits on AO3 and FFN has widened. I’m now close to 50,000 hits on AO3, but am only at 33,000 views on FFN. I do think this shows an overall decline in usage of FFN as a platform.
However, I did find out something recently, that is sort of worth noting. I’m not sure what you make of it but if you search for: Harry/Ginny, canon compliant, post-war fics excluding fluff (if you’ve read castles, this selection will make sense), castles is the 4th most kudo-ed fic in the list. If you search for all of these, minus the Hinny pairing, it is on the second page (so’s the wolf’s just a puppy). That is including finished, and unfinished works, which is wild.
Castles is now respectively 3rd and 15th in these searches (so on the first page for both), which is even wilder to me. On the second search, I’m on the same page as a fic by senlinyu!! lmao.
I'm not addressing anything else I said aside from the fact that as I'm now approaching 50,000 hits, those numbers are even more mental.
.
NOW, ONTO THE HOMEMADE GOOGLE SHEET
(for more details on how it is created, see here - scroll down to the same section. having said that, do note that this is all based on kudos. i do not get notifications for bookmarks, subs, etc. so that would be much more difficult to track. thus, for the purposes of these graphs, i'm only relying on kudos to know if my fics are doing "well" or not. i, of course, get a lot of joy from comments and they are what i most cherish, but my email notifications are turned off on those, for reasons that i can explain if you are curious (if so, just send me an ask). as such, i can't track them as easily. also i’m more interested in the content of my comments than in their number. kudos are a good general indicator, though very imperfect.)
AVAILABLE GRAPHS AND THOUGHTS
1. CONSISTENTLY, CASTLES ACCOUNTS FOR ABOUT A THIRD OF HOW PEOPLE FIND ME


[the methodology is explained in more detail in the original post but for the purposes of this: "new" readers means all total kudos left that year, minus guest kudos and "repeat" kudos (i.e. people who have already kudoed at least one of my other fics in the past)]
This is so interesting given it’s the opposite conclusion from the one I’d drawn in 2023 (see here). It turns out that 2022 was an outlier. Having said that, I do think it’s interesting to note that since January 2023, I’ve not posted any major other fics that were not castles. I’ve posted some smaller one shots but generally speaking, my last major one-shot was probably louisville. so, this may be why castles is still accounting for this many first kudos. It will be interesting to see what these graphs look like next year, when I’m no longer posting new chapters.
2. DO PEOPLE REALLY FIND YOU OFF THE FRONT PAGE?
That was the conclusion I’d drawn last year, but looking at 2023, I’m now not too sure. For the record, I posted castles in May, July, October and November. I also posted smaller one shots in January, July and August. The assumption there is that if people find you off the front page, then you should get an influx of new reader kudos when you post.

It's evident that the months I posted new content had higher engagement than the months I didn’t. However, the spike in November is particularly striking. The only explanation I can find is that I posted chapter 19 of castles in November (a.k.a the 9/11/"barn" chapter). This chapter had the highest engagement by far, possibly tied with chapter 22 based on my current inbox feedback, but we'll see how that pans out.
The way I'm interpreting this is that in the wake of 19 being so well-received, people who had been reading castles silently for a while finally left kudos for the first time, counting as "new" readers, even though they technically weren't. So, maybe, the new conclusion to draw here is that angst serves me? I know that fluff does better in the Hinny fandom overall but my readers probably follow me for the angst and so when a particularly angsty chapter comes out, they’re more excited about it and kudo more? Again, I’m just guessing.
3. FICS STABILISE AFTER THE FIRST YEAR
It's fascinating to observe this trend over the span of four years. Looking at my flagship one-shots like slipped, the wolf, the fault, watch and lousville, a recurring pattern emerges: each initially garners a significant portion of kudos in its first year (typically 12% or more), then stabilises to 7-10% in subsequent years. I'm particularly curious to see if castles will follow a similar trajectory after it's completed.


[total number of kudos per fic, all kudos included]
Also, building on last year's third observation (“bad fics don’t do well, regardless of how shippy or fluffy they are”), I think what’s interesting to me here is that the opposite is true: fics like louisville (Harry/OC) and the fault (Deamus) which have very unpopular ships still do extremely well on their own and seem to attract readers. This is however not a phenomenon you see with my oldest non-hinny fic ce ne sont que des cailloux (Bill/Fleur). The way I explain this is two-fold:
I think the French title might hurt ce ne sont que des cailloux. Maybe casual readers think it’s in French?
ce ne sont que des cailloux is the first non-hinny fic I posted, and it was also posted in January 2021, at a time where my readership was very limited compared to now. This goes to my earlier point about readership. Now that I have one, I reckon that if I re-posted ce ne sont que des cailloux, it would get a lot more kudos from my followers. At the time, I was relatively new in fandom, and thus no one read that fic. It never ended on rec lists, etc., and to this day, is still hindered by this initial slower start.
Having said that, generally speaking, I still think the fics that are doing the best are my best ones. I think audiences are (generally) right (at least on my level). There are definitely fics where I don't really understand why they're doing so well. I talk about watch below. spring rolls is another one that I find a bit meh and where I'm not sure why it's holding 8% of the pie. But there aren't any fics where I'm majorly like "ugh, I wish this was getting more attention." Apart from ce ne sont que des cailloux, maybe.
4. DO LONG FICS REALLY ATTRACT A LOT OF GUESTS?
That was my conclusion based on 2022 numbers, showing a massive discrepancy between the number of guests+repeat kudos and the number of new kudos in castles. However, this seems to be another case of 2022 being an outlier. If you look at the figures for 2023, that is no longer the case.
However, I do think it’s interesting that the fault in faulty manufacturing still seems to be a fic that brings me a lot of new readers, compared to the total of kudos it brings me. All the other fics seem somewhat similar, bar from the fault that has a two point difference. I wonder if this is because part of the drive for this fic is the slash end of the fandom which may find me from this particular fic because it’s my only slash one?
5. DOES SHIP MATTER?
I think the one conclusion I’m drawing, looking at these pie charts year on year, is that yes, ship matters… to a point. I think when you look at one-shots like slipped and the wolf (and, to an extent, watch), as well as castles, they have undeniably greatly contributed to my relative popularity. Lots of people found me because they ship Hinny, and I write Hinny, simple as that. And following, I also think that if wrote an even more popular ship (say: Dramione or Drarry), my kudo counts would certainly be higher.
Having said that, the reason I’m saying it only matters to a point is that what I’m seeing with more recent non-Hinny work (the fault and louisville) is that these get read regardless. Why? Humbly, because I think people like my writing and are willing to branch out of their favourite ship to read my other works. The more pre-existing readership you have, the less the ship you’re writing matters. If someone like senlinyu or MissKingBean69 were to write Bill/Fleur, with the pre-built audience they already have, I would venture that would become the most popular Bill/Fleur fic in fandom in no time.
Lastly, I think one interesting thing I’m noticing for 2024 is that for the first time ever, the wolf (which has been my flagship Hinny one-shot since it was first posted) is doing “worse” than slipped and other non-Hinny one-shots. I find this very interesting given that the wolf was such a driver for so long. I wonder if this is because the fic has generally reached everyone it was meant to reach and is now plateau-ing, or if it’s something else? I’m interested to see what this is going to look like for the rest of 2024.
.
LASTLY, SOME NEW GRAPHS
GENERAL GROWTH

These graph tracks my general kudo growth, all fics included, between January 2021 and May 2024. The second one is aggregate.
As you can see on the first graph, you can pretty much track when I posted and when I didn’t, following the line up and down. My three biggest peaks were: May/June 2021 (which I already addressed here), August 2023 and November 2023.
August 2023 is a mystery to me. I didn’t post castles. The only thing I did post was spring rolls, which is a tiny 800-word fic that I genuinely don’t think should be this popular lol. Is it simply because over the summer, people have more time to read?
November 2023, was chapter 19 of castles, which, again, did incredibly well. It interestingly doesn’t even compare to the peak I got in February 2024 where I posted two chapters of castles, and still didn’t get anywhere close. So, again, angst drives my readership.
What I think is interesting on the second graph is that we’re pretty much in a straight line here. Caveating that this starts at zero because that’s when I started tracking, it’s not actually when I started posting so I had pre-existing kudos. But yeah, it took me 16 months to hit my first 1,000 kudos, then 14 months to hit 2,000+ and presumably another 12/13 months to hit 3,000.
CASTLES GROWTH

Interestingly, per this graph, the growth of castles is also steady overall. It’s not as steady as the general one but I typically tend to hit 200 kudos every 10/11 months. I will say that if you look closely, you’ll notice that in the last year (May 2023 to May 2024), the growth is a little bit steeper at times, but did flatten towards the end (Feb to June 2024 - when I didn’t post) which means that generally, we’re only at +266 kudos. That’s still more than 200, but not that much more.
I think what’s interesting is that this doesn’t seem to track with my overall, anecdotal impression of my readership, which I feel has been constant in terms of numbers since 2021, if not declining a little. I generally feel I’m getting less interactions with readers since, I would say, the summer of 2022. So I think what this shows isn’t that my readership is growing, it’s that it’s perpetually replacing itself. My sense is that people will typically read up to the most recent chapter, stay involved with the fic for maybe six months to a year, then drop off, and be replaced by new readers. I don’t think this is bad, I think it’s the natural laws of fandom. I also think there was an abnormal spike in engagement around the pandemic where people had nothing to do but go online and read fic. As a writer, it can be hard not to attribute people dropping off to your own failings (my writing quality has decreased, my chapters are too long - whatever it may be), when in fact, the turnover is generally pretty consistent.
When comparing the lines of overall kudos, I think this confirms that generally speaking, castles is the main driver of my kudo influx.

Bar a few exceptions, the two track. It’s clearly not the only driver because there is a pretty sizeable difference between line levels, but it is the main one. This is especially clear since October 2023, which is a period of time in which I’ve not been posting anything else.
OTHER TOP 5 FIC GROWTH

Regarding the wolf (above), this confirms what I was saying previously: this fic is currently flatlining hard. It took me: two months to hit 100 kudos, seven months to hit 200, eight months to hit 300, and thirteen months to hit 400. I’m not upset by it, I feel like this fic has done its time and it’s probably past its prime (lol) but that’s interesting. It used to be so popular and my main driver of kudos aside from castles, and it’s definitely not anymore.
In terms of the other fics, you're going to have to believe my word because tumblr is preventing me from adding more screenshots to this post (sigh) but the trend is the same, though the flatlining is less pronounced.
When it comes to slipped, like the wolf, it also seems to be growing slower since the end of 2022, albeit less dramatically. It took five months to hit 100 kudos, twelve months to hit 200, and eighteen months to hit 300. I’ve always thought the difference in popularity between slipped and the wolf (which were more or less posted at the same time) was down to the wolf being posted as part of a fest, which wasn’t the case for slipped. But it could also be that the wolf is just a better written fic (in my opinion, at least). The fault follows a similar trend, on a different scale. It took me six months to get 100 kudos, then eighteen months to get to 200.
Interestingly, watch, however, seems to have had a steady-ish growth since its six months anniversary. The flatlining is less pronounced than for the others. I’m honestly not sure why. It’s a fic that I never in a million years expected to be in the top five, I was very surprised it did well at all. I like the style of it but it’s very much what in the TV-show fanfic realm we’d call an “episode tag”, meaning a short fic that explores a scene from a different angle/POV. I don’t think it really brings anything new to canon, and I don’t think it’s particularly novel. I’d be curious to see if it stays in the top five in the long run to be honest.
When comparing the lines of overall kudos to each of the individual fics (again, trust my word), they don't seem to correlate as much as castles does. Bar from watch, they all caused a spike at the time of publication, but then each have tiny odd peaks that don't reflect in the overall graph. They also don't really have other big peaks, just sort of hover between 5 and 15 kudos/month throughout. I would assume that whilst the numbers may be different, this is probably the same trend you see in most finished long fics.
.
CONCLUSION
I can't believe you got to the end of this. Please let me know if you found it interesting/have questions!
2 notes
·
View notes
Text
Enterprises Explore These Advanced Analytics Use Cases
Businesses want to use data-driven strategies, and advanced analytics solutions optimized for enterprise use cases make this possible. Analytical technology has come a long way, with new capabilities ranging from descriptive text analysis to big data. This post will describe different use cases for advanced enterprise analytics.
What is Advanced Enterprise Analytics?
Advanced enterprise analytics includes scalable statistical modeling tools that utilize multiple computing technologies to help multinational corporations extract insights from vast datasets. Professional data analytics services offer enterprises industry-relevant advanced analytics solutions.
Modern descriptive and diagnostic analytics can revolutionize how companies leverage their historical performance intelligence. Likewise, predictive and prescriptive analytics allow enterprises to prepare for future challenges.
Conventional analysis methods had a limited scope and prioritized structured data processing. However, many advanced analytics examples quickly identify valuable trends in unstructured datasets. Therefore, global business firms can use advanced analytics solutions to process qualitative consumer reviews and brand-related social media coverage.
Use Cases of Advanced Enterprise Analytics
1| Big Data Analytics
Modern analytical technologies have access to the latest hardware developments in cloud computing virtualization. Besides, data lakes or warehouses have become more common, increasing the capabilities of corporations to gather data from multiple sources.
Big data is a constantly increasing data volume containing mixed data types. It can comprise audio, video, images, and unique file formats. This dynamic makes it difficult for conventional data analytics services to extract insights for enterprise use cases, highlighting the importance of advanced analytics solutions.
Advanced analytical techniques process big data efficiently. Besides, minimizing energy consumption and maintaining system stability during continuous data aggregation are two significant advantages of using advanced big data analytics.
2| Financial Forecasting
Enterprises can raise funds using several financial instruments, but revenue remains vital to profit estimation. Corporate leadership is often curious about changes in cash flow across several business quarters. After all, reliable financial forecasting enables them to allocate a departmental budget through informed decision-making.
The variables impacting your financial forecasting models include changes in government policies, international treaties, consumer interests, investor sentiments, and the cost of running different business activities. Businesses always require industry-relevant tools to calculate these variables precisely.
Multivariate financial modeling is one of the enterprise-level examples of advanced analytics use cases. Corporations can also automate some components of economic feasibility modeling to minimize the duration of data processing and generate financial performance documents quickly.
3| Customer Sentiment Analysis
The customers’ emotions influence their purchasing habits and brand perception. Therefore, customer sentiment analysis predicts feelings and attitudes to help you improve your marketing materials and sales strategy. Data analytics services also provide enterprises with the tools necessary for customer sentiment analysis.
Advanced sentiment analytics solutions can evaluate descriptive consumer responses gathered during customer service and market research studies. So, you can understand the positive, negative, or neutral sentiments using qualitative data.
Negative sentiments often originate from poor customer service, product deficiencies, and consumer discomfort in using the products or services. Corporations must modify their offerings to minimize negative opinions. Doing so helps them decrease customer churn.
4| Productivity Optimization
Factory equipment requires a reasonable maintenance schedule to ensure that machines operate efficiently. Similarly, companies must offer recreation opportunities, holidays, and special-purpose leaves to protect the employees’ psychological well-being and physical health.
However, these activities affect a company’s productivity. Enterprise analytics solutions can help you use advanced scheduling tools and human resource intelligence to determine the optimal maintenance requirements. They also include other productivity optimization tools concerning business process innovation.
Advanced analytics examples involve identifying, modifying, and replacing inefficient organizational practices with more impactful workflows. Consider how outdated computing hardware or employee skill deficiencies affect your enterprise’s productivity. Analytics lets you optimize these business aspects.
5| Enterprise Risk Management
Risk management includes identifying, quantifying, and mitigating internal or external corporate risks to increase an organization’s resilience against market fluctuations and legal changes. Moreover, improved risk assessments are the most widely implemented use cases of advanced enterprise analytics solutions.
Internal risks revolve around human errors, software incompatibilities, production issues, accountable leadership, and skill development. Lacking team coordination in multi-disciplinary projects is one example of internal risks.
External risks result from regulatory changes in the laws, guidelines, and frameworks that affect you and your suppliers. For example, changes in tax regulations or import-export tariffs might not affect you directly. However, your suppliers might raise prices, involving you in the end.
Data analytics services include advanced risk evaluations to help enterprises and investors understand how new market trends or policies affect their business activities.
Conclusion
Enterprise analytics has many use cases where data enhances management’s understanding of supply chain risks, consumer preferences, cost optimization, and employee productivity. Additionally, the advanced analytics solutions they offer their corporate clients assist them in financial forecasts.
New examples that integrate advanced analytics can also process mixed data types, including unstructured datasets. Furthermore, you can automate the process of insight extraction from the qualitative consumer responses collected in market research surveys.
While modern analytical modeling benefits enterprises in financial planning and business strategy, the reliability of the insights depends on data quality, and different data sources have unique authority levels. Therefore, you want experienced professionals who know how to ensure data integrity.
A leader in data analytics services, SG Analytics, empowers enterprises to optimize their business practices and acquire detailed industry insights using cutting-edge technologies. Contact us today to implement scalable data management modules to increase your competitive strength.
2 notes
·
View notes
Text
Evolution of Washington State Library Systems
By: EF, MB, ZG, CM
Introduction
With all of the challenges public libraries are facing in 2024, such as limited hours, staffing shortages, restricted budgets, book bans, and complete closures, we wanted to compare library branch statistics and see the overall evolution of libraries over the past twenty years. The 21st century brought with it a wave of change for libraries with the implementation of computers, online collections, and digital catalogs. These changes can be seen in the data libraries choose to record. For example, the 2001 dataset includes a column for the number of computers each library had, which for many was zero, a fact that would be considered unnecessary to add today. With this in mind, we examined different library datasets and decided upon Washington State Libraries.
Washington State Libraries (WSL) publishes data online from each library system and individual library branch in Washington State, starting from the year 2001. Using the datasets from 2001 and 2022, we aimed to study the growth and transformation of WSL over the 21-year period. We investigated if WSL has kept up with user needs and if the increase in population and registered users correlates with their holdings and offerings. In addition, we compared budgets and staffing to see if there has been adequate change over time, or if the library systems have remained static. With computers and digital resources starting to become more common in libraries in the early 2000s, we examined the difference twenty years can make in technology acquisitions.
Using different categories from the 2001 and 2022 datasets, we compared statistics pertaining to hours open, physical and digital collection size, physical circulations, digital circulations, staff salaries, full-time staff, MLS-certified staff, and registered users. By focusing on individual library systems and their respective branches, we assessed whether there has been positive change and growth in their library statistics and if budgets have appropriately increased with inflation.
Dataset
The dataset under examination is sourced from the Washington State Secretary of State's website, specifically within the Washington State Library Publications section. This section provides a comprehensive collection of data related to library operations, usage, and resources across the state. The datasets are part of the Washington State Libraries' efforts to maintain transparency and provide public access to detailed information about library services. Access to the datasets is provided through the following links:
Washington State Library Publications
2000 Dataset
2022 Dataset
Data Collection and Acquisition Process
Data collection within the Washington State Library system involves a collaborative effort spanning various library branches throughout Washington State. Personnel across these branches engage in routine operations, including tracking circulation, monitoring registered users, and assessing staff resources, as part of their daily responsibilities. The data collected at individual branches are then forwarded to the Washington State Library, where it undergoes aggregation and consolidation by dedicated staff members.
Purpose of Data Collection
The datasets are part of the Washington State Libraries' annual expenditure and usage reports for the Legislative District and Congressional District Factsheets. These reports aim to provide a detailed overview of library operations and resource utilization to inform legislative and congressional decision-making. For our research purposes, we used the collected data to compare usage statistics and draw conclusions based on our findings. By comparing data spanning 21 years, we sought to uncover trends, patterns, and shifts in patron behavior and library operations.
Data Manipulation
No alterations have been made to the original datasets to maintain data integrity and adhere to assignment guidelines. Our analysis revolved around direct comparisons between corresponding data points from 2001 and 2022, primarily focusing on annual circulation, registered users, and library staff metrics.
Ethics
While the dataset provides a rich repository of information, it has limitations. Its focus on Washington State libraries may limit generalizability to other regions. The temporal span of the data may overlook short-term trends or episodic events influencing library usage patterns. To mitigate these limitations, we adopted a nuanced approach to analysis, recognizing biases and uncertainties inherent in the data. Triangulating our findings with supplementary data sources or employing sensitivity analyses enhanced the robustness and reliability of our conclusions. Moreover, fostering transparency in our research methodology and engaging in reflexivity regarding the dataset's constraints contributed to the integrity and credibility of our research outcomes.
Navigating ethical considerations in data analysis and interpretation is imperative to uphold integrity and accountability. Beyond safeguarding sensitive information and ensuring compliance with privacy regulations, ethical conduct encompasses transparency in research practices and respect for stakeholder perspectives. As researchers, we are responsible for critically examining our biases and positionalities, recognizing how our backgrounds and affiliations may influence data interpretation and dissemination. Furthermore, engaging stakeholders, including library administrators and patrons, in the research process fosters collaboration and ensures that our analyses resonate with the lived experiences and priorities of those directly impacted by library services.
Methodology
We applied data cleaning and transformation methods to standardize and prepare the data for analysis. The computational approach involved several steps:
Data Cleaning: We used R to read and clean the datasets from 2001 and 2022. This involved renaming columns for consistency, removing unnecessary rows, and converting relevant columns to numeric data types for accurate analysis using mutate() and as. numeric() functions from the dplyr package.
Data Selection: We selected relevant columns from both datasets to focus on metrics such as registered users, annual circulations, and staff details using the select() function.
Data Aggregation and Summarization: We utilized functions like group_by(), summarize(), and arrange() from the dplyr package to aggregate and summarize the data, identifying key statistics and trends.
Data Visualization: We used ggplot2 in R to create visualizations that compared the top 10 libraries by registered users for 2001 and 2022. These visualizations helped us identify patterns and trends in library usage over the years. Specifically, we used geom_bar() for bar plots and labs() for labeling the charts.
Here are some key functions and techniques we used in our computational analysis:
Reading Data: We used read_excel() to import the datasets into R.
Renaming Columns: We applied the rename() function to standardize column names across datasets.
Data Transformation: The mutate() function was used to convert character data to numeric where necessary.
Summarizing Data: We used summarize() and group_by() to aggregate data and calculate relevant statistics.
Sorting and Filtering: We employed arrange() and slice() to sort and filter the datasets for visualization.
Visualization: The ggplot2 package was extensively used for creating various plots to visualize the data.
Argument & Evidence
Our analysis revealed significant changes in library usage, staffing, and resource allocation over the past two decades. The decline in registered users is particularly notable. The King County Library System experienced a remarkable decrease in registered users, declining from 888,604 in 2001 to 558,760 in 2022. Similarly, the Seattle Public Library also demonstrated a substantial decline in registered users, which could be attributed to the growth in at-home technology. However, the Sno-Isle Libraries significantly increased registered users, highlighting the varied impacts of digital transformation and community engagement strategies across different library systems. This diversity in outcomes underscores the need for tailored approaches to resource management and user engagement in the evolving landscape of public libraries.
Annual circulations also displayed notable shifts. Libraries such as the Seattle Public Library saw a substantial increase in circulations from 2001 to 2022, highlighting the increasing reliance on digital resources. This trend toward digitization in library services was evident across the top libraries, reflecting broader societal changes in how people access and consume information.
Staffing patterns revealed interesting trends as well. The number of MLS-accredited librarians has increased in several library systems, indicating a professionalization of library staff over the years. However, the ratio of MLS-accredited librarians to total staff varied significantly across different library systems. This disparity suggests differences in staff qualifications and resource allocation, highlighting the need for more standardized professional development opportunities across the state.
Examining individual libraries provided deeper insights. For instance, the Fort Vancouver Regional Library District maintained a steady number of registered users over the years, attributed to targeted community programs and efficient resource management. Meanwhile, the King County Library System and the Seattle Public Library consistently ranked among the top performers in terms of registered users and annual circulations, showcasing their robust library services and community engagement efforts, despite a decrease in registered users.
Data Visualization
Data Visualization 1 & 2: Top 10 Libraries with Most Annual Circulations in 2001 and 2022


This bar chart displays the top 10 libraries by the number of annual circulations in 2001 and 2022. The x-axis represents the library system names, while the y-axis shows the total number of annual circulations. The chart reveals which libraries were the most active in terms of physical book loans in 2001 and 2022, highlighting their importance within the community, and showing the increase of circulations over time.
Data Visualization 3: Top 10 Libraries with Most Registered Users in 2022

This bar chart displays the distribution of registered users across various libraries in 2001 and 2022. The x-axis represents the library system names, while the y-axis shows the number of registered users. Red bars indicate the number of users in 2001, and black bars indicate the number of users in 2022.
Example(s)
To zoom in on a specific example, we examined the King County Library System, which showed a notable decrease in registered users from 2001 to 2022 as seen above. In 2001, the King County Library System had 888,604 registered users, which decreased to 558,760 by 2022. This significant decline could be attributed to various factors, including changes in population demographics, shifts in user preferences towards digital resources, or possibly funding and resource allocation challenges. The decrease in registered users highlights the challenges the library faces in adapting to changing community needs and technological advancements, making it a prime example of the impact of broader trends on library management and engagement.
Additionally, we observed that the Seattle Public Library experienced substantial growth in registered users, indicating effective community engagement and resource allocation strategies. This demonstrates that while some libraries face declines, others can thrive by adapting to new technologies and effectively reaching out to their communities.
These examples illustrate the varying impacts of digital transformation and funding challenges on different library systems, showcasing the diverse outcomes of library management strategies over the years.
Future Work
Future work could involve a more granular analysis of factors contributing to the growth or decline in registered users and annual circulations across different library systems. Additionally, further research could explore the impact of digital transformation on library services, examining how the integration of digital resources and technology has influenced user behavior and library usage patterns. Collaborating with library administrators and stakeholders to identify best practices and successful strategies for community engagement and resource management would also be beneficial. Finally, expanding the analysis to include more recent data and additional years could provide a more comprehensive understanding of long-term trends and developments in the Washington State Library system.
2 notes
·
View notes
Text
“Stocks closed higher today amid brisk trading…” On the radio, television, in print and online, news outlets regularly report trivial daily changes in stock market indices, providing a distinctly slanted perspective on what matters in the economy. Except when they shift suddenly and by a large margin, the daily vagaries of the market are not particularly informative about the overall health of the economy. They are certainly not an example of news most people can use. Only about a third of Americans own stock outside of their retirement accounts and about one in five engage in stock trading on a regular basis. And yet the stock market’s minor fluctuations make up a standard part of economic news coverage.
But what if journalists reported facts more attuned to the lives of everyday Americans? For instance, facts like “in one month, the richest 25,000 Americans saw their wealth grow by an average of nearly $10 million each, compared to just $200 dollars apiece for the bottom 50% of households”? Thanks to innovative new research strategies from leading economists, we now have access to inequality data in much closer to real time. Reporters should be making use of it.
The outsized attention to the Dow Jones and Nasdaq fits with part of a larger issue: class bias in media coverage of the economy. A 2004 analysis of economic coverage in the Los Angeles Times found that journalists “depicted events and problems affecting corporations and investors instead of the general workforce.” While the media landscape has shifted since 2004, with labor becoming a “hot news beat,” this shift alone seems unlikely to correct the media’s bias. This is because, as an influential political science study found, biased reporting comes from the media’s focus on aggregates in a system where growth is not distributed equally; when most gains go to the rich, overall growth is a good indicator of how the wealthy are doing, but a poor indicator of how the non-rich are doing.
In other words, news is shaped by the data on hand. Stock prices are minute-by-minute information. Other economic data, especially about inequality, are less readily available. The Bureau of Labor Statistics releases data on job growth once a month, and that often requires major corrections. Data on inflation also become available on a monthly basis. Academic studies on inequality use data from the Census Bureau or the Internal Revenue Service, which means information is months or even years out of date before it reaches the public.
But the landscape of economic data is changing. Economists have developed new tools that can track inequality in near real-time:
From U.C. Berkeley, Realtime Inequality provides monthly statistics and even daily projections of income and wealth inequality — all with a fun interactive interface. You can see the latest data and also parse long-term trends. For instance, over the past 20 years, the top .01% percent of earners have seen their real income nearly double, while the bottom 50% of Americans have seen their real income decline.
The State of U.S. Wealth Inequality from the St. Louis Fed provides quarterly data on racial, generational, and educational wealth inequality. The Fed data reminds us, for example, that Black families own about 25 cents for every $1 of white family wealth.
While these sources do not update at the speed of a stock ticker, they represent a massive step forward in the access to more timely, accurate, and complete understanding of economic conditions.
Would more reporting on inequality change public attitudes? That is an open question. A few decades ago, political scientists found intriguing correlations between media coverage and voters’ economic assessments, but more recent analyses suggest that media coverage “does not systematically precede public perceptions of the economy.” Nonetheless, especially given the vast disparities in economic fortune that have developed in recent decades, it is the responsibility of reporters to present data that gives an accurate and informative picture of the economy as it is experienced by most people, not just by those at the top.
And these data matter for all kinds of political judgments, not just public perspectives on the economy. When Americans are considering the Supreme Court’s recent decision on affirmative action, for example, it is useful to know how persistent racial disparities remain in American society; white high school dropouts have a greater median net worth than Black and Hispanic college graduates. Generational, racial, and educational inequality structure the American economy. It’s past time that the media’s coverage reflects that reality, rather than waste Americans’ time on economic trivia of the day.
13 notes
·
View notes
Note
how does one get into baseball. can you just start watching a random thing or should you try to start at the beginning of a season or like. hows that work
here was my process
have boyfriend who loves baseball (this is truly not an essential step bc i went a year and a half of our relationship before making any active moves towards getting into baseball but having someone in your life who loves it DOES help)
read The Echoing Green by joshua prager, a book chronicling a sign-stealing (cheating) scandal that led to and marred one of those home runs informally monikered The Shot Heard Round the World bc of its impact on baseball fans during a time when baseball was still really popular in the usa. the book was written by a journalist who is an avid baseball fan, so it's FULL of statistical information, technical terminology, humanity, and deep, elegant, funny, sad, joyful insights into the role of the sport within people's minds and american (and global) culture. it's additionally about the giants and dodgers, bf's team and bf's team's eternal rivals
look up a lot of definitions and explanations while reading that book, start to become enamored with the weirdness of the game
download the mlb app, make an account, and use it to listen to radio broadcasts of giants games, because the app aggregates the radio stations for every team and broadcasts them almost-live for every game, for free
have switch flipped in your brain for you after your first time listening to a complete game on the radio
listen to at least part of every one of your team's games since then except all-stars bc you were on a plane
you don't have to start at the beginning of a season, and a random thing is totally fine! honestly i recommend the live radio steps of my method bc they were hugely accessible and following what's happening with a team in the present day makes things pretty exciting and engaging. (baseball has also been broadcast on the radio for a very long time so it's a cool way to engage with history.) there are also livestreaming piracy sites for sports including one that has had video streams of every baseball game i've wanted to watch rather than listen to .... i can share the url privately if u want. the mlb app/mlb.com also does a Free Game of the Day every day, where the video stream of one game will be free! also there are lots of full games on youtube, and old radio games on archive.org.
i can't in good faith recommend like, reading a long book and going on wikipedia deep dives trying to piece things together and teaching yourself stuff as an entry method for everyone since that's not .... fun, for everyone, but it did a lot towards getting me into the game in a way that exposed me to some of its most interesting elements right from the getgo, so (shrugs). (and it was fun for ME!! hehe) i also sort of had a team picked out for me going in, which helped -- like i totally could've gotten into another but i'd heard about the giants from mar, and about some interesting parts of their character as a team and their history, and for several reasons they on their own were appealing to me so while i listen to a broadcast from other teams now and then i was locked in from the start. which fast tracked me towards caring about specific players, eras, moments. plus, alaska doesn't have a baseball team
re: the season -- the way baseball works is for most of the season every team is playing every other team, more or less, in series of 2-4 games. during this period everything is just hammering out division standings. tournament-stuff starts happening during the postseason (starts october i think?) so that's when jumping in in the middle might get confusing. even then tho u would probably be fine. games happen like, often every day and sometimes twice a day, with occasional rest days
thank u for asking me this this was fun :D feel free to ask me to clarify anything
3 notes
·
View notes