#Stock trading patterns
Explore tagged Tumblr posts
Text
The Japanese Candlestick Charting Technique
The Japanese candlestick charting technique second edition book was written by Steve Nison. He wrote the book to understand the candlestick patterns and analyze the market.
Steve Nison structures the book from basics to advanced strategies
This Second Edition book contains:
More about intraday markets
More focus on active trading for swing, and day traders
New tactics for getting maximum use from intraday charts
New Western techniques in combination with candles
A greater focus on capital preservation.
4 notes
·
View notes
Text
Importance of chart analysis for equity investments
Image by freepik Chart analysis, or technical analysis, can be quite helpful for equity investment in the Indian stock market. Here are several reasons why it is beneficial: Benefits of Chart Analysis in the Indian Stock Market 1.Trend Identification The Indian stock market, like any other, exhibits trends over time. Chart analysis helps in identifying these trends, allowing investors to ride…
#chart analysis#equity investment#Financial Markets#Indian stock market#investment strategies#market analysis#Market Sentiment#Stock Charts#Stock Market#Stock Trading#Support and Resistance#Technical Analysis#Technical Indicators#Trading Patterns#Trend Identification#Volume Analysis
3 notes
·
View notes
Text
What makes the bearish harami a weak bearish reversal indicator?
A bearish harami is one of the weakest bearish trend reversal candlestick.It is due to the psychology behind it.
In simple terms, it is the bears and bull's behaviour in the market that makes the bearish harami a weak trend reversal pattern.

The above picture depicts the behaviour of bulls and bears in the market that leads to the formation of bearish harami and also makes it a weak indicator.
Click here to read the explaination about their behaviour.
#stock trader#investing stocks#stock market#future and option trading#forex trading#forex#earn money online#investor#candlestick pattern#crypto traders
12 notes
·
View notes
Text
Indian Stock Market Hit by SVB Crisis and Global Market Volatility
The Indian stock market is facing turbulence due to the SVB crisis and global market volatility. #OptionTrading #BankNifty #Nifty50 #BankCrises #IndianStockMarket #GlobalMarketVolatility
Indian Stock Market Hit by SVB Crisis and Global Market Volatility The Indian stock market is reeling from the recent failure of Silicon Valley Bank (SVB) in the United States and the ripple effect it is having on global equity markets. This comes on the heels of the Adani crisis, making it another blow to the market’s recovery efforts. Investors have lost a whopping Rs 6.6 lakh crore in the…

View On WordPress
#bank stocks#bearish momentum#candlestick patterns#candlestick trading#global market volatility#rate hike#Silicon Valley Bank#SVB crisis#technical analysis#trading strategies
2 notes
·
View notes
Text


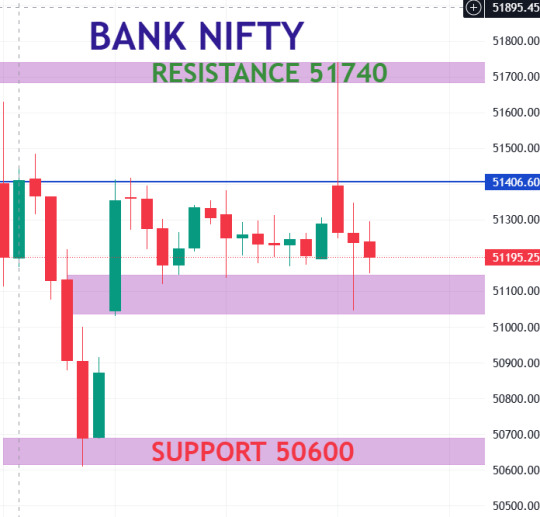
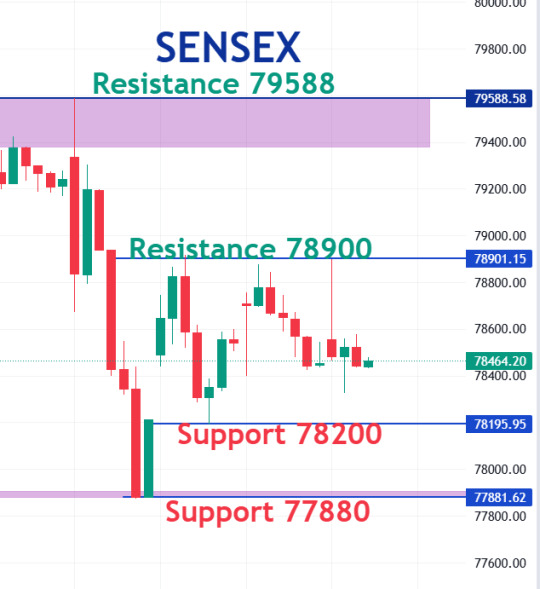
Nift Bannifty Sensex Technical analysis 28 DEC
#stock market#nifty#nifty50#nifty prediction#nifty fifty#banknifty#sensex#nse#bse#bse sensex#share market#technicalanalysis#chart patterns#finnifty#live trading#howtrading2#howtrading
1 note
·
View note
Text
Head and Shoulders Chart Pattern in Stock Trading

The Head and Shoulders pattern is a chart formation that often signals a reversal in the trend of a financial asset like stocks, commodities, or currencies. Traders use this pattern to spot when a market is about to shift from an upward trend to a downward trend (or vice versa), making it an essential tool for both beginners and experienced investors. This pattern has three peaks with the centre peak shaped like a ‘head’ supported by the two ‘shoulders’ or smaller peaks on either side which gives the pattern its name.
Read Full Blog Post: Head and Shoulders Pattern in Technical Analysis
#Head and Shoulders Chart Pattern in Technical Analysis#How to Trade using Head and Shoulders Pattern#Different Types of Head and Shoulders Pattern#Head And Shoulders Pattern In Stock Trading#Inverse head and shoulders pattern
0 notes
Text

GIFT Nifty Indicates Muted Opening; UCO Bank Hikes Lending Rates by 5bps for Certain Tenures
for more details click here
#William J. O'Neil (William O Neil)#CANSLIM#Indian Stock Market#Stock Market Research#Market Outlook#Stock Screener#Stock Watchlists#Chart Pattern#Stock Analysis#Breakout Stocks#Stocks to Watch#Stocks to Buy#Growth Stocks#Stock Investing#Stock Trading#Momentum Investing#IPO Stocks#Fundamental Analysis#Technical Analysis#Stock M#arket Courses#Best Sector To Invest#Top Stock Advisory Services
1 note
·
View note
Text
Doji Candlestick Pattern and Trading Doji
The doji pattern is a candlestick pattern commonly used in technical analysis to indicate indecision in the market. It occurs when the opening price and the closing price of an asset are very close to each other, resulting in a candlestick with a very small real body. The doji pattern can have different shapes, but the common characteristic is that it has a small real body, a long upper and…

View On WordPress
#candlestick patterns#Candlesticks#Doji#dragonfly doji#gravestone doji#learn technical analysis#long legged doji#Patterns#stock markets#stock trading#technical analysis#trading doji
3 notes
·
View notes
Text
0 notes
Text
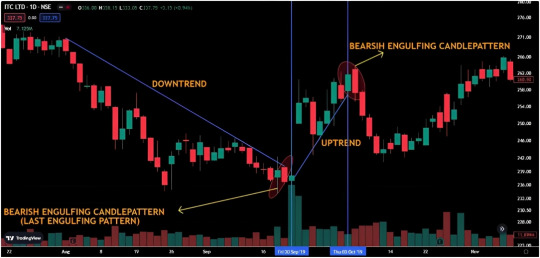
Bearish Engulfing pattern can result in uptrend ! When and How?

The above chart is a perfect example for a bearish engulfing pattern to act as a bullish trend reversal.This happens when bearish engulfing pattern occurs in the end of downtrend.
Click here to learn more about this in detail.
#stock trader#stock trading#candlestick pattern#crypto traders#future and option trading#forex trading#forex#earn money online#technical analysis
12 notes
·
View notes
Text
Binance Exclusive: Start Trading with $100 for Free!

Take your first steps into the exciting realm of cryptocurrency trading with Binance! Sign up now and receive a complimentary $100 to kickstart your trading journey. Explore a diverse selection of cryptocurrencies, hone your trading skills, and potentially turn that initial $100 into something more. Don't miss this exclusive offer – seize the opportunity to trade on Binance with free funds! #binance #cryptotrading #freemoney Link Below : https://bit.ly/BinanceFree100
#Cryptocurrency#Forex#Stocks#Day Trading#Swing Trading#Technical Analysis#Fundamental Analysis#Trading Strategies#Risk Management#Options Trading#Futures Trading#Bull Market#Bear Market#Market Trends#Stop-Loss#Take Profit#Margin Trading#Leverage#Candlestick Patterns#Market Volatility
0 notes
Video
youtube
Mastering the DOUBLE BOTTOM FOREX TRADING for Maximum Gain 2023
#youtube#youtube trending#Double Bottom Pattern Explained#Trading Strategies with Double Bottom#Identifying Double Bottom Reversals#Double Bottom Chart Pattern Tutorial#How to Spot Double Bottoms in Forex#Double Bottom Candlestick Patterns#Double Bottom Trading Signals#Double Bottom vs. Double Top Differences#Double Bottom Formation Analysis#Successful Double Bottom Trading Tips#Double Bottom Pattern for Beginners#Real Examples of Double Bottom in Stock Market#Double Bottom Breakout Strategies#Double Bottom Technical Analysis Guide#Common Mistakes in Double Bottom Trading
0 notes
Text
The Real Price of Stocks: Understanding Intrinsic Value
The intrinsic value of a stock represents its true worth, accounting for tangible and intangible aspects of the business, and might differ from its market value. Calculated using fundamental analysis, it encompasses factors like earnings, dividends, future cash flows, and financial health. In essence, intrinsic value is a stock’s actual worth, distinct from its market price. Rooted in value…

View On WordPress
0 notes
Text
youtube
https://tradegenie.com/ - Are you ready to level up your trading game and catch those big moves in the market? Join us in this illuminating video where we break down the art of "Trading Gaps" and provide a comprehensive explanation of the Three Gaps & Hanging Men pattern.
📈 Gap in an Uptrend:
Unlock the potential of spotting gaps in an uptrend, a vital skill for seizing opportunities in rising markets. We'll show you how to make the most of this pattern to enhance your trading strategy.
📊 Gap and Volume:
Trading volume is a crucial indicator. Find out how gaps and volume work together to help you interpret market trends and make informed trading decisions.
💪 Gap as Support:
Discover how gaps can serve as robust support levels, bolstering your trading confidence even during market turbulence.
🔄 Gap in a Congestion Zone:
Congestion zones can be perplexing, but when a gap appears, it brings clarity. Learn how gaps can be a guiding light in navigating these complex market conditions.
🔍 Gap as Extra Confirmation:
When in doubt, seek additional confirmation. We'll explain how gaps can provide that extra layer of certainty, reinforcing your trading choices.
📉 Gap in a Downtrend:
Explore the role of gaps in downtrends and how they can help you make sense of bearish market movements.
🚧 Gap as Resistance:
Resistance levels are pivotal in trading. Understand how gaps can act as formidable barriers, shaping price dynamics and affecting your trading strategy.
Join us for a deep dive into these critical trading concepts and candlestick patterns that can help you catch those big market moves. Don't forget to like, subscribe, and hit the notification bell to stay updated with our latest trading insights!
Limited-Time Offer: Join Swing Options Service
Join our Swing Options Service monthly at a trial price of $97 instead of the regular price of $197.
Use promo code "SAVE100" to get an incredible $100 OFF!
For more information and resources, visit our coaching page: https://tradegenie.com/coaching/
Connect with us on Facebook: / therealtradegenie
Head Office:
Trade Genie Inc.
315 South Coast Hwy 101,
Encinitas, CA 92024
Phone Number: 212-930-2245
Email: [email protected]
#TradingGaps
#CandlestickPatterns
#TechnicalAnalysis
#StockMarket
#DayTrading
#SwingTrading
#InvestingTips
#TradingStrategy
#MarketAnalysis
#ThreeGaps
#HangingMen
#MarketTrends
#SupportAndResistance
#TradingEducation
#BigMoves
#TradingInsights
#FinancialEducation
#TradingSuccess
#ChartAnalysis
#TradingSkills
#GapsExplained
0 notes
Text

GIFT Nifty Indicates Positive Opening; Hindustan Petroleum to Invest Rs 2,212 Crore in Raipur Pipeline Project
More details visit here
#William J. O'Neil (William O Neil)#CANSLIM#Indian Stock Market#Stock Market Research#Market Outlook#Stock Screener#Stock Watchlists#Chart Pattern#Stock Analysis#Breakout Stocks#Stocks to Watch#Stocks to Buy#Growth Stocks#Stock Investing#Stock Trading#Momentum Investing#IPO Stocks#Fundamental Analysis#Technical Analysis#Stock M#arket Courses#Best Sector To Invest#Top Stock Advisory Services
1 note
·
View note
Text
youtube
Trading was HARD until I understood these 4 TRADING RULES that changed my LIFE!
In this week’s video, I am thrilled to share my personal journey and reveal the 4 life-changing rules that completely transformed my day trading experience. If you've struggled with day trading before, fret no more. These rules hold the key to unlocking success in the dynamic world of day trading!
#trading strategies#trading for beginners#how to start day trading#stock market for beginners#day trading strategy#share market#share market basics for beginners#stock trading basics#day trading for beginners webull#trading secrets#day trader#simple trading#swing trading#day trading for beginners#pattern day trader#intraday trading strategies#intraday trading for beginners#intraday strategy#4 trading rules#changed my life#trading was hard#Youtube
0 notes