#Past Precipitation Data
Explore tagged Tumblr posts
Visit Tumblr Blog
Explore Tumblr blogs with no restrictions, modern design and the best experience.
Last Seen Tumblr Blogs


Fun Fact
After the announcement of the deal with Yahoo!, there were 170K signatures of unhappy Tumblr users petitioning to prevent the sale in 2013.
Text
Enhancing Traveler Safety with Hourly Weather Data: A Comprehensive Guide

Travel is an important part of modern life, whether for work, fun, or adventure. However, bad weather can disrupt plans and create safety risks. Hourly weather data provides a clear and timely view of weather conditions to help keep travelers safe. Understanding weather patterns helps in planning safe trips and preparing for possible disruptions caused by bad weather. When travelers stay updated on changing weather, they can avoid dangerous situations and make better decisions. This information allows for changes in travel plans, prioritizing safety over convenience. It also gives travelers confidence, knowing they have considered all possible weather challenges before starting their journeys. This comprehensive guide will look into how these weather reports can transform travel experiences by ensuring safety through informed decision-making. Read more here...
0 notes
Text

According to a new study published Tuesday by the Centers for Disease Control and Prevention, not a single person has been born in the United States during the past five years. “While the general fertility rate has been decreasing for some time, we found that it made a precipitous drop-off to zero starting in late 2019,” said CDC director Mandy Cohen, who called the rate a “historic low,” confirming that the U.S. birth rate had fallen 100% a half decade ago. “Our data shows that no babies were born in the United States in the year 2023, which is about 3,792,000 fewer babies than in 2018.
Full Story
299 notes
·
View notes
Text

The decision to pause deliveries to the north of the Gaza Strip has not been taken lightly, as we know it means the situation there will deteriorate further and more people risk dying of hunger. WFP is deeply committed to urgently reaching desperate people across Gaza but the safety and security to deliver critical food aid - and for the people receiving it - must be ensured. Deliveries resumed on Sunday after a three-week suspension following the strike on an UNRWA truck and due to the absence of a functioning humanitarian notification system. The plan was to send 10 trucks of food for seven straight days, to help stem the tide of hunger and desperation and to begin building trust in communities that there would be enough food for all. On Sunday, as WFP started the route towards Gaza City, the convoy was surrounded by crowds of hungry people close to the Wadi Gaza checkpoint. First fending off multiple attempts by people trying to climb aboard our trucks, then facing gunfire once we entered Gaza City, our team was able to distribute a small quantity of the food along the way. On Monday, the second convoy’s journey north faced complete chaos and violence due to the collapse of civil order. Several trucks were looted between Khan Younes and Deir al Balah and a truck driver was beaten. The remaining flour was spontaneously distributed off the trucks in Gaza city, amidst high tension and explosive anger. In December, the Integrated Phase Classification report compiled by 15 agencies including WFP warned of the risk of famine in northern Gaza by May unless conditions there improved decisively. At the end of January, after delivering food to the north, we reported on the rapid deterioration of conditions. In these past two days our teams witnessed unprecedented levels of desperation. The latest reports confirm Gaza’s precipitous slide into hunger and disease. Food and safe water have become incredibly scarce and diseases are rife, compromising women and children’s nutrition and immunity and resulting in a surge of acute malnutrition. People are already dying from hunger-related causes. A report issued Monday by UNICEF and WFP, based on recent data, finds that the situation is particularly extreme in the Northern Gaza Strip. Nutrition screenings conducted at shelters and health centres in the north found that 15.6 per cent - or 1 in 6 children under 2 years of age - are acutely malnourished. WFP will seek ways to resume deliveries in a responsible manner as soon as possible. A large-scale expansion of the flow of assistance to northern Gaza is urgently needed to avoid disaster. To achieve this, WFP needs significantly higher volumes of food coming into the Gaza strip from multiple routes, additionally, crossing points to the north of Gaza must open. A functioning humanitarian notification system and a stable communication network are needed. And security, for our staff and partners as well as for the people we serve, must be facilitated. Gaza is hanging by a thread and WFP must be enabled to reverse the path towards famine for thousands of desperately hungry people.
I cannot believe this.
1K notes
·
View notes
Text
Also preserved in our archive

By Sarah Schwartz
Test after test of U.S. students’ reading and math abilities have shown scores declining since the pandemic.
Now, new results show that it’s not just children whose skills have fallen over the past few years—American adults are getting worse at reading and math, too.
The connection, if any, between the two patterns isn’t clear—the tests aren’t set up to provide that kind of information. But it does point to a populace that is becoming more stratified by ability at a time when economic inequality continues to widen and debates over opportunity for social mobility are on the rise.
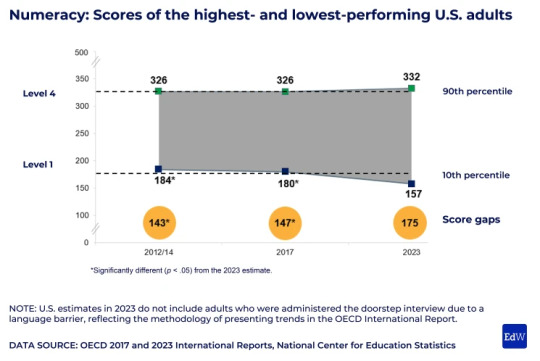
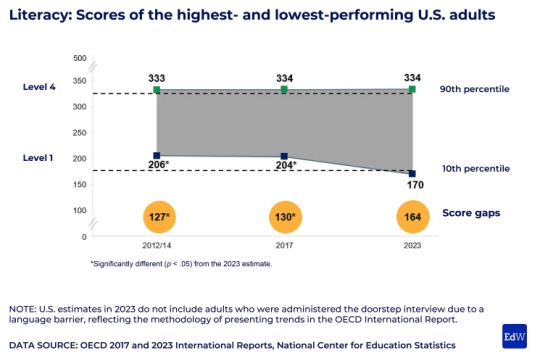
The findings from the 2023 administration of the Program for the International Assessment of Adult Competencies, or PIAAC, show that 16- to 65-year-olds’ literacy scores declined by 12 points from 2017 to 2023, while their numeracy scores fell by 7 points during the same period.
These trends aren’t unique in the global context: Of the 31 countries and economies in the Organization for Economic Cooperation and Development that participated in PIAAC, some saw scores drop over the past six years, while others improved or held constant.
Still, as in previous years, the United States doesn’t compare favorably to other countries: The country ranks in the middle of the pack in literacy and below the international average in math. (Literacy and numeracy on the test are scored on a 500-point scale.)
But Americans do stand out in one way: The gap between the highest- and lowest-performing adults is growing wider, as the top scorers hold steady and other test takers see their scores fall.
“There’s a dwindling middle in the United States in terms of skills,” said Peggy Carr, the commissioner of the National Center for Education Statistics, which oversees PIAAC in the country. (The test was developed by the OECD and is administered every three years.)
It’s a phenomenon that distinguishes the United States, she said.
“Some of that is because we’re very diverse and it’s large, in comparison to some of the OECD countries,” Carr said in a call with reporters on Monday. “But that clearly is not the only reason.”
American children, too, are experiencing this widening chasm between high and low performers. National and international tests show the country’s top students holding steady, while students at the bottom of the distribution are falling further behind.
It’s hard to know why U.S. adults’ scores have taken this precipitous dive, Carr said.
About a third of Americans score at lowest levels PIAAC is different from large-scale assessments for students, which measure kids’ academic abilities.
Instead, this test for adults evaluates their abilities to use math and reading in real-world contexts—to navigate public services in their neighborhood, for example, or complete a task at work. The United States sample is nationally representative random sample, drawn from census data.
American respondents averaged a level 2 of 5 in both subjects.
In practice, that means that they can, for example, use a website to find information about how to order a recycling cart, or read and understand a list of rules for sending their child to preschool. But they would have trouble using a library search engine to find the author of a book.
In math, they could compare a table and a graph of the same information to check for errors. But they wouldn’t be able to calculate average monthly expenses with several months of data.
While the U.S. average is a level 2, more adults now fall at a level 1 or below—28 percent scored at that level in literacy, up from 19 percent in 2017, and 34 percent in numeracy, up from 29 percent in 2017.
Respondents scoring below level 1 couldn’t compare calendar dates printed on grocery tags to determine which food item was packed first. They would also struggle to read several job descriptions and identify which company was looking to hire a night-shift worker.
The findings also show sharp divides by race and national origin, with respondents born in the United States outscoring those born outside of the country, and white respondents outscoring Black and Hispanic test takers. Those trends have persisted over the past decade.
#mask up#public health#wear a mask#pandemic#wear a respirator#covid#still coviding#covid 19#coronavirus#sars cov 2
196 notes
·
View notes
Text

Stingray Nebula
“Archival data from the NASA/ESA Hubble Space Telescope reveal that the nebula Hen 3-1357, nicknamed the Stingray nebula, has faded precipitously over just the past two decades. Witnessing such a swift rate of change in a planetary nebula is exceedingly rare, say researchers. These images captured by Hubble in 1996 (left), when compared to Hubble images taken in 2016 (right), show a nebula that has drastically dimmed in brightness and changed shape. Bright blue shells of gas near the centre of the nebula have all but disappeared, and the wavy edges that earned this nebula its aquatic-themed name are virtually gone. The young nebula no longer pops against the black velvet background of the distant Universe.” - via Wikimedia Commons
#stingray nebula#Hen 3-1357#nebula#space#cosmology#cosmos#outer space#nature#wikipedia#wikipedia pictures#wikimedia commons#spacecore#spaceblr#science#astrophysics#astronomy#hubble space telescope#hubble telescope#planetary nebula#nasa
34 notes
·
View notes
Text
ST5 "overall season plot" brain dump
I’m being driven moderately nuts by how we still do not know the overarching plot of ST5 or like, any confirmed details about it really. Things we’d gotten in past season promo cycles by this point (the ST3 Starcourt Mall/NYE teasers, ST4 character descriptions and the four storyline teasers, IDK about ST2 I wasn’t around for that) I think were much stronger fodder for sussing that part of the puzzle out. which tbf is maybe why they’re withholding them this time around.
But it's just so hard to really speculate without that larger framing, so this has not stopped my getting stuck on this. so I'm dumping a recent version of an attempt to think through that below - partially posting this to keep track of my own “theories” (that’s putting it too strongly lol) but I’d also love to hear what other people think/how you’re putting the kind of scant data we have on this together.
So, framing this as a kind of exploration of: what are those big “overarching season plot” details we’re missing, and what are some possibilities based on current available evidence for answers to those questions about the bigger picture?
(the below noodling contains spoilers for all ST5 spoilers we’ve gotten so far, through official or unofficial channels, so don’t read if you’re avoiding any part of that. if you're not caught up on any of the details cited here, I've been trying to keep track of that in a more detail-oriented way in a "ST5 Timeline" Google doc)

I. What is/are the precipitating event/s that cause the story to pick back up in November 1987?
Some options:
A. Vecna’s reemergence begins after he’s spent 1.5 years regrouping (maybe manifesting for our protags via Will’s Vecna connection-related distress accelerating, though if we know anything about Will it is that he is unlikely to volunteer that info to the group himself). What is Vecna’s grand plan, and how much have our protags figured out since we last saw them (both about the plan, and how to finally take him down)? B. Military “stabilization” of the mega-rift starts to show cracks, probably related to Point A. maybe makes the McCorkle Farm UD entry point possible? C. Something is going on with the kids in Hawkins. Impossible to know at this point if the military’s interest in the elementary school kids is self-initiated or is caused by some kind of supernatural, probably Vecna-related phenomenon, since both military and Vecna seem to have their own separate but surely somehow related agendas wrt the kids. D. Linda Hamilton arrives in Hawkins, probably related to Point C (or maybe she’s been around and the Extended Party is just becoming aware of her/the specific danger she poses, maybe because of Point C) E. Supernatural-caused murder, disappearance, or some other kind of incident, resulting in probably military “forensics” team response, per early extras casting call. Also maybe weird “sickness” of some kind spreading through around Hawkins, considering how much time we seem to spend at the hospital and how Nancy is posted there as a candy striper. F. Supernatural/Vecna targeting of Holly, also probably related to Points A and C, though my current read is this starts up a little later than whatever the real “Ground Zero” launch point for this season is, mid or late ep 1 into ep 2 G. Some new development with Max’s condition? I have no other speculation on this because we've gotten so little on what's up with Max, but seems logical since her situation is probably thee dangling thread from the end of ST4 H. Probably not the precipitating event, but larger town response to whatever the precipitating event/s end/s up being also likely to be a driver, picking up the unresolved ST4 Hellfire Club witch hunt/Satanic Panic storyline

II. What is our protags’ response to this/these precipitating event/s?
A strong possibility is the proposal plan of a plan that the Party brands “The [Dungeon] Crawl." It seems like the enactment of a plan, “crawl” or not, is underway by midseason and has at least has a couple phases with the second phase being at least two-pronged (unsure if El + Hopper prong that splits off at the same time was intentional)
Phase One: “The Turnbow Trap” - they need something from the Turnbow mansion to enact Phase Two. Derek? Some information from a document in the Turnbows' possession? A key? IDK Phase Two: Group A - Upside Down: enter UD via a portal of some kind on the McCorkle Farm. in the UD, visit Lab, Church (Steve, Nancy, Jonathan, Dustin). Steve car's antenna may be installed specifically for this UD trip. Group B - Right Side Up: post up at the McCorkle Farm, access the downtown Hawkins military barracks (where the kids are) via the tunnels, end up going to the Hospital and Lab (Joyce, Will, Mike, Lucas, Erica, Robin, Murray, Erica, probably Vickie) Wildcard - Upside Down x2: Are Hopper and El in the UD part of the plan, or were they forced to split off? either way, they also seem to go to the Lab and the Church, but probably on a separate timeline than Group A (unless they meet up at one and go to the other location together?).

III. What are our protags’ goals with the above plan?
Some options:
Save kids from military custody/possible experimentation
Locate and save Holly
Figure out the Max situation, revive her
Locate and take down Vecna
Solve remaining mysteries about the Upside Down and the Hawkins National Lab, especially as it relates to dealing with Vecna
I think the "sub-goals" to achieve all of these are probably more important for piecing together the big picture, but when I try speculating on those atp it starts to feel like I'm getting a little far afield of responding to the evidence we currently have. so this really basic list is a placeholder.

Appendix: Other important "season big picture" details
that didn't get mentioned anywhere else, woops
WSQK: something more is going on here than just it being the group HQ this season. what is it about a radio station that motivated that choice for our big new season location? (plus the car antennas, Mike keeping a not supercom radio close at hand biking/at school - so much radio equipment all over the place...)
Flashbacks, probably mindscape or vision-y, to Henry's past and Will's 1983 stint in the UD seem to occur throughout the season
#truly have no idea if anyone else will find this useful#i know none of this is 'new' info#i feel like somehow this has to be charted against like#theme. character arcs. etc.#but at least exporting this somewhere feels like it's easier to toggle back and forth between those two aspects of the story#stranger things 5#st5 speculation#st5 spoilers
21 notes
·
View notes
Text
"Academic Danilo Brozović says studies of failed civilisations all point in one direction – today’s society needs radical transformation to survive."
For someone who has examined 361 studies and 73 books on societal collapses, Danilo Brozović’s conclusion on what must happen to avoid today’s world imploding is both disarmingly simple and a daunting challenge: “We need dramatic social and technological changes.”
The collapse of past civilisations, from the mighty Mayan empire to Rapa Nui (Easter Island), has long fascinated people and for obvious reasons – how stable is our own society? Does ever-growing complexity in societies or human hubris inevitably lead to oblivion? In the face of the climate crisis, rampant destruction of the natural world, rising geopolitical tensions and more, the question is more urgent than ever.
“More and more academic articles are mentioning the threat of collapse because of climate change,” says Brozović at the school of business at the University of Skövde, Sweden. The issue of collapse hooked him after it was raised in a project on business sustainability, which then led to his comprehensive review in 2023.
The field is not short of extreme pessimists. “They believe what we are doing will eventually cause the extinction of the human race,” says Brozović. Some say today’s challenges are so great that it is now time humanity comes to terms with extinction, and even build a vault containing our greatest cultural achievements as a record for some future – perhaps alien – civilisation. Others, using data on deforestation and population, rate the chance of catastrophic collapse at 90% or more.
Most scholars are more optimistic, if not actually optimists. Brozović says: “They say collapse for us will just be the end of life as we know it today. There will be less globalisation and a lower standard of life, affecting public health very negatively.”
This raises the question of what is meant by collapse: most agree it is the loss of complex social and political structures over a few decades at most. But by this definition, many classic collapses, misinterpreted in the rear-view mirror of history, may actually be better described as transformations. He says: “In the last 10 years or so, people are asking did the Rapa Nui society collapse or did it reinvent itself?” he says.
The search for explanations of societal collapse has been a long one, going back at least to Thomas Malthus’s An Essay on the Principle of Population and Edward Gibbon’s History of the Decline and Fall of the Roman Empire, which blamed decadence and barbarian invasions.
Today, collapses are seen as the result of combined factors, such as environmental problems, disease, political or economic turmoil, religious crises and soil exhaustion, even if one factor might precipitate the collapse.
Brozović says: “But there is one theory of collapse that stands out as the most frequently invoked: Joseph Tainter’s theory of complexity.” Tainter’s theory was published in 1988 and has since been described as “peak complexity”.
Brozović says: “He says the main function of every society is solving problems by investing resources. But as society becomes more complex, the problems become more complex, so you have to invest more resources. Painter says at the end of this spiral, collapse is inevitable, because you cannot do this for ever. Technological innovations can simplify increasingly complex problems. But, again, this cannot go on indefinitely.”
After that came the sunk-cost effects theory of collapse. He says: “[Societies] are unwilling to abandon something – for example a settlement or the current global economy – if a great deal has been invested in it, even if future prospects are dim.” Others have blamed social hubris, he says, meaning excessive pride or arrogance led societies to ignore warning signs and block preventive action.
“It’s like being in a bad marriage,” Brozović says. “You know you should get out, but you have invested a lot of yourself and a lot of time, and it’s really hard.”
Growing gaps between the rich and poor also come up as a factor, he says. Research using big data to model historical societies has found that elites and inequality appear towards the end. “If it’s not a cause, it’s definitely a symptom,” he says.
There is a problem, however, in attempting to draw insight for the future: past collapses were local or regional. “But we live in a global and extremely complex society,” says Brozović. “[Nonetheless], one very important insight is that, regardless of the cause of collapse, how a society reacts seems crucial.”
In his 2005 book, Collapse: How Societies Choose to Fail or Succeed, Jared Diamond identified two vital choices distinguishing societies that failed from those that survived.skip past newsletter promotion
The first, tackling the sunk-cost problem and political short-termism, is long-term planning: making “bold, courageous, anticipatory decisions at a time when problems have become perceptible but before they have reached crisis proportions”. Diamond cites Tokugawa shoguns, Inca emperors and 16th-century German landowners as positive examples, having faced and reversed disastrous deforestation.
The second, combating social hubris, is the painful process of overturning core values. Diamond says: “Which of the values that formerly served a society well can continue to be maintained under new changed circumstances? Which of these treasured values must instead be jettisoned and replaced with different approaches?” Here he cites Scandinavian settlers in Greenland during the medieval period as a negative example, saying they refused to jettison their European farming identity and died as a result.
Having extensively surveyed the study of societal collapses, does Brozović think the way humanity currently lives looks sustainable? “No, no – definitely not,” he says. “We have to do something – that’s the conclusion that arises from reading all this research.”
“At the end of the day, we have to radically transform society, and we have to do it fast,” he says. That means overhauling politics, policies and institutions, safeguarding food production and the natural world that supports life on Earth.
“That’s the recipe to mitigate collapse,” he says. “But nothing is really happening substantially. We are shifting the discussion of what is acceptable and what is not, and a lot of good, positive things are happening. But the question is, will it happen fast enough?”
Brozović’s review highlights a significant barrier to action noted by Paul and Anne Ehrlich: convincing people of the necessity of such measures, a task made even harder by the rise of online disinformation.
The idea that humanity’s fate is in its own hands is not new. In the mid-20th century, historian Arnold Toynbee, who had studied the varying fates of 28 societies, said: “Civilisations die from suicide, not from murder.” But Diamond channeled Winston Churchill’s thought on democracy to reach a more positive conclusion: “A lower-impact society is the most impossible scenario for our future – except for all other conceivable scenarios.”
10 notes
·
View notes
Text
Another update
2/20/2024
[ID: Article by WFP:
20 February 2024
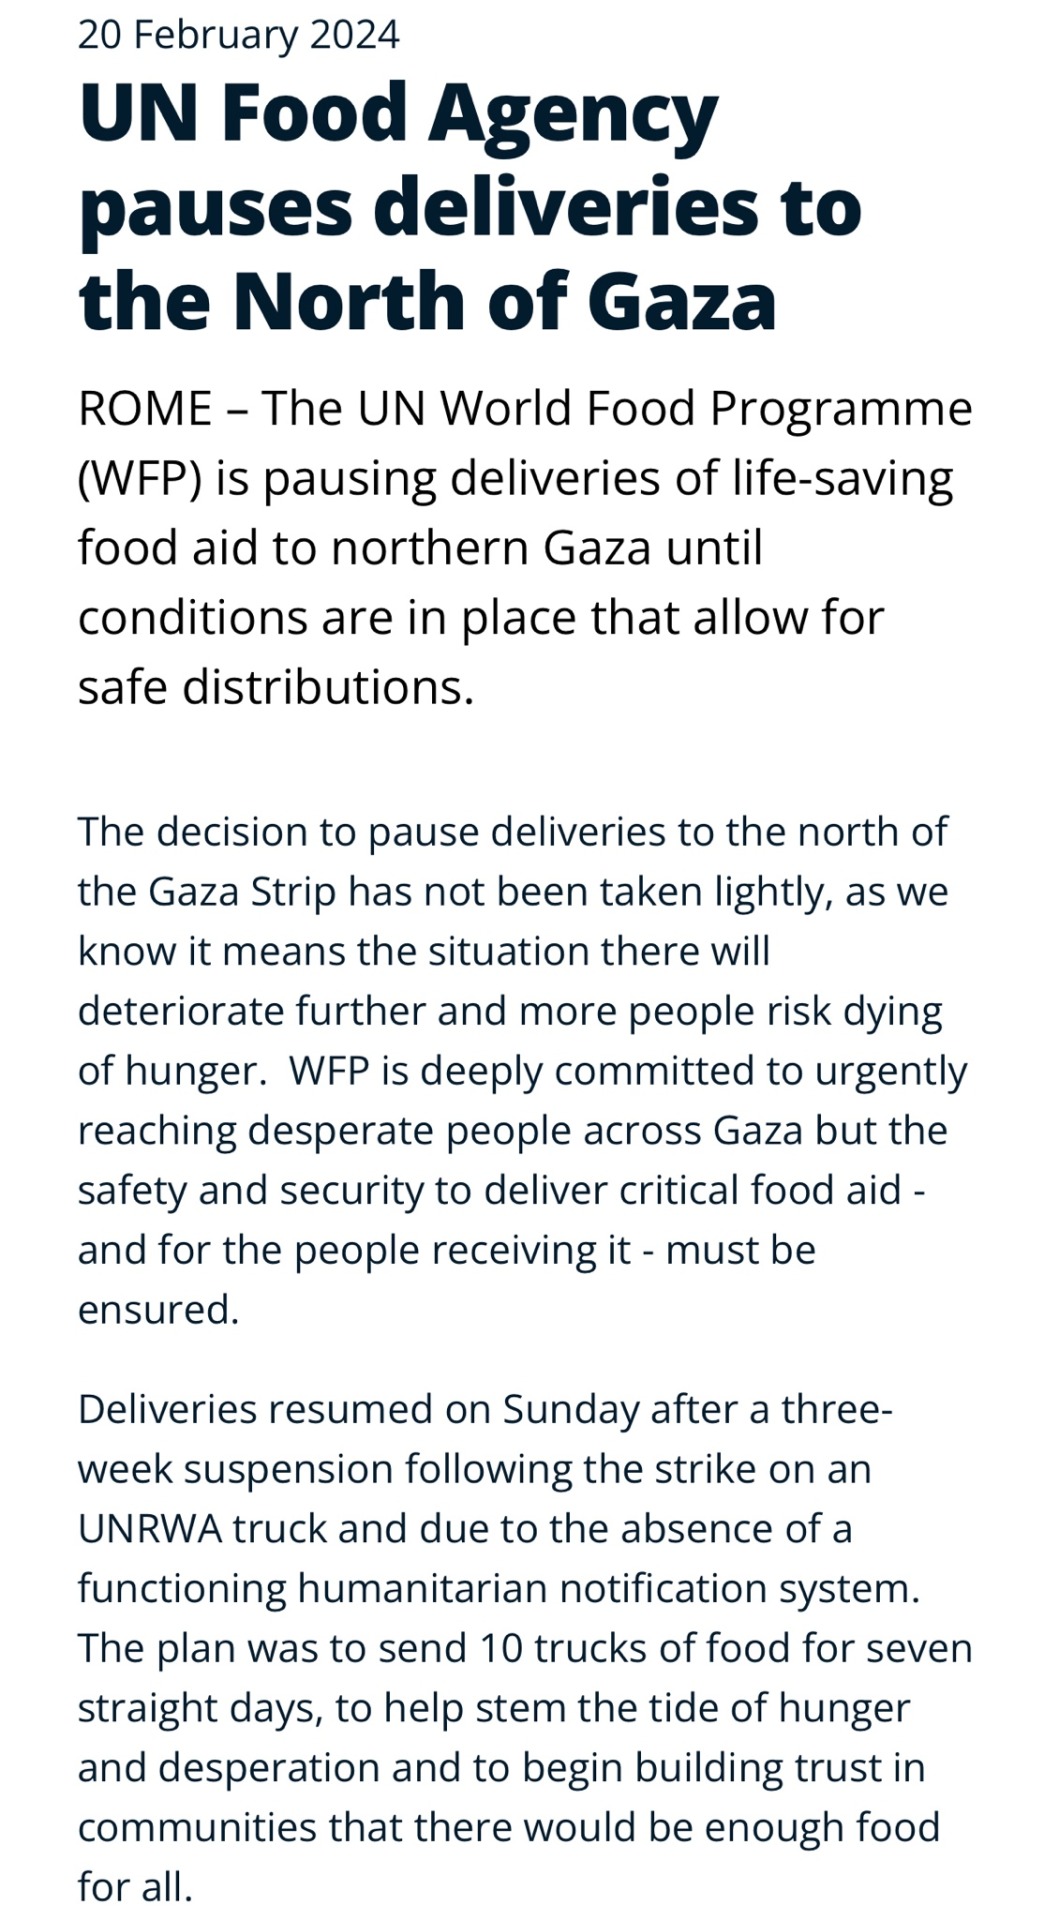
UN Food Agency pauses deliveries to the North of Gaza
ROME – The UN World Food Programme (WFP) is pausing deliveries of life-saving food aid to northern Gaza until conditions are in place that allow for safe distributions.
The decision to pause deliveries to the north of the Gaza Strip has not been taken lightly, as we know it means the situation there will deteriorate further and more people risk dying of hunger. WFP is deeply committed to urgently reaching desperate people across Gaza but the safety and security to deliver critical food aid - and for the people receiving it - must be ensured.
Deliveries resumed on Sunday after a three-week suspension following the strike on an UNRWA truck and due to the absence of a functioning humanitarian notification system. The plan was to send 10 trucks of food for seven straight days, to help stem the tide of hunger and desperation and to begin building trust in communities that there would be enough food for all. ]
Continued:
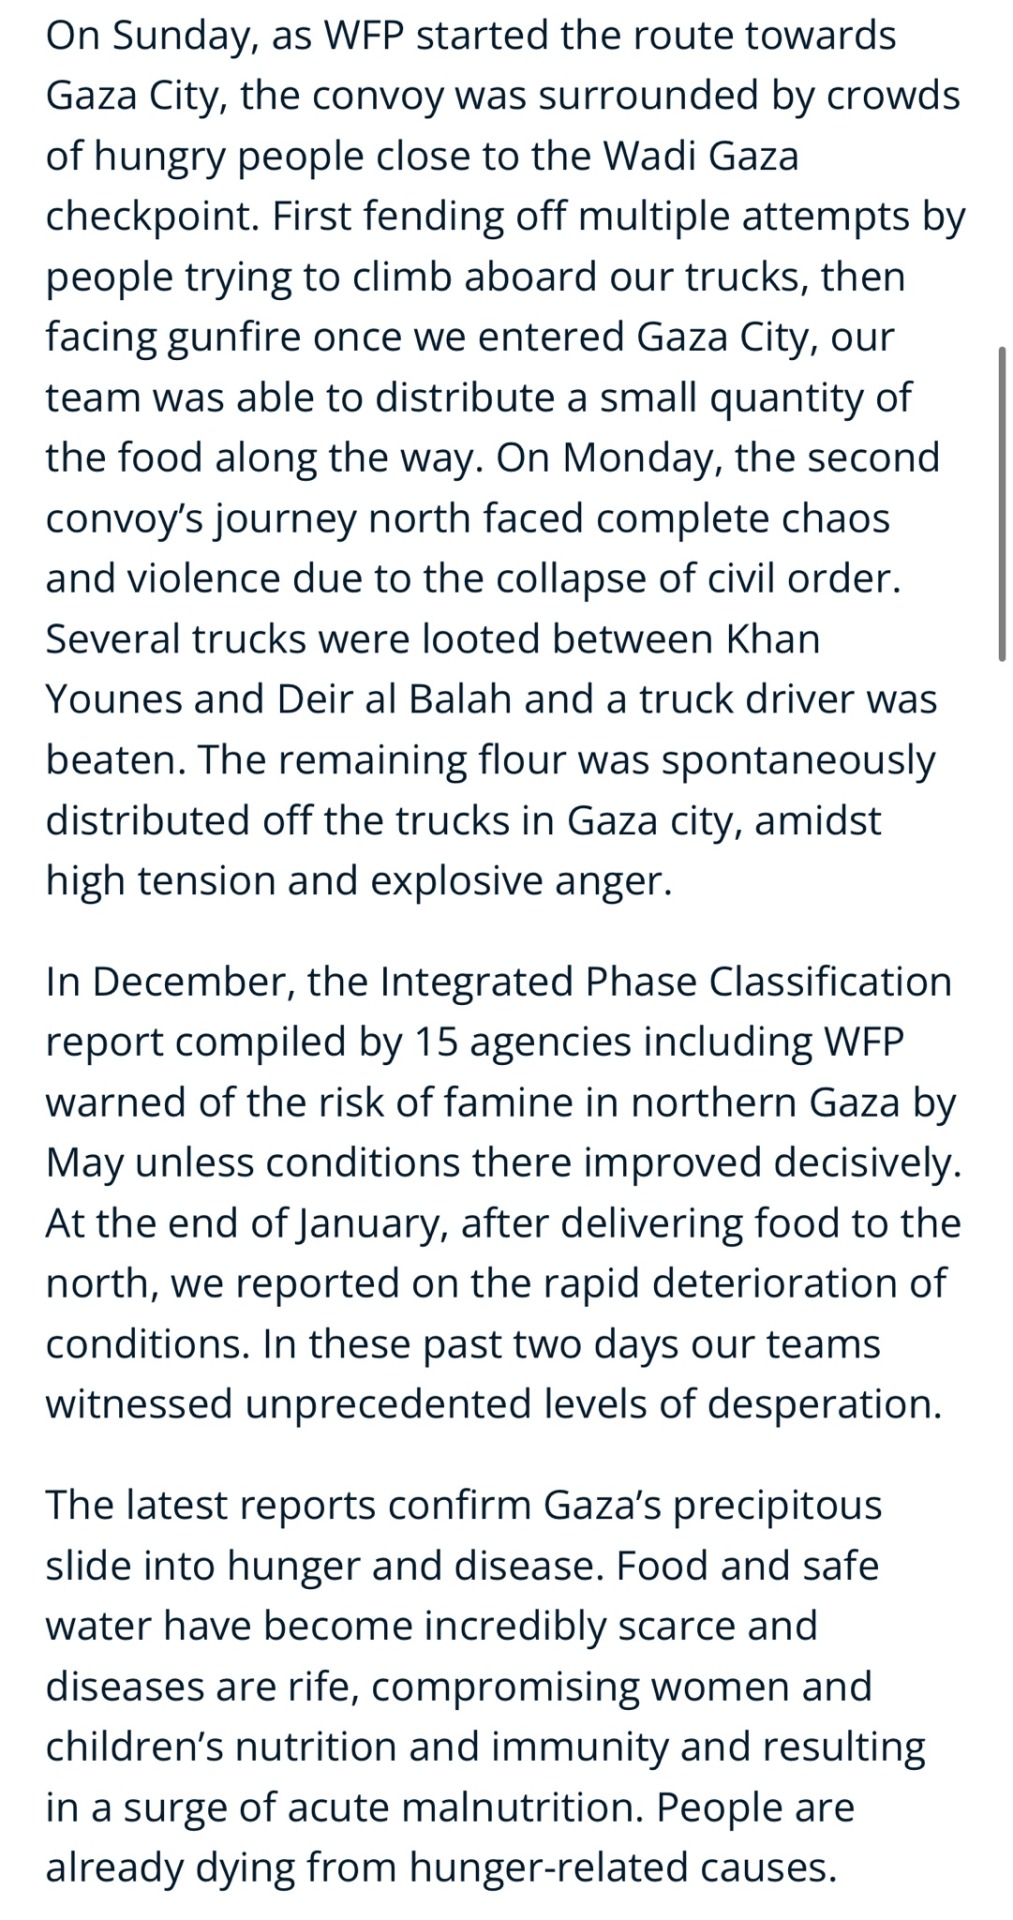
[ID: Continuation of article by WFP: On Sunday, as WFP started the route towards Gaza City, the convoy was surrounded by crowds of hungry people close to the Wadi Gaza checkpoint. First fending off multiple attempts by people trying to climb aboard our trucks, then facing gunfire once we entered Gaza City, our team was able to distribute a small quantity of the food along the way. On Monday, the second convoy’s journey north faced complete chaos and violence due to the collapse of civil order. Several trucks were looted between Khan Younes and Deir al Balah and a truck driver was beaten. The remaining flour was spontaneously distributed off the trucks in Gaza city, amidst high tension and explosive anger.
In December, the Integrated Phase Classification report compiled by 15 agencies including WFP warned of the risk of famine in northern Gaza by May unless conditions there improved decisively. At the end of January, after delivering food to the north, we reported on the rapid deterioration of conditions. In these past two days our teams witnessed unprecedented levels of desperation.
The latest reports confirm Gaza’s precipitous slide into hunger and disease. Food and safe water have become incredibly scarce and diseases are rife, compromising women and children’s nutrition and immunity and resulting in a surge of acute malnutrition. People are already dying from hunger-related causes. ]
[ID: Continuation of article by WFP:
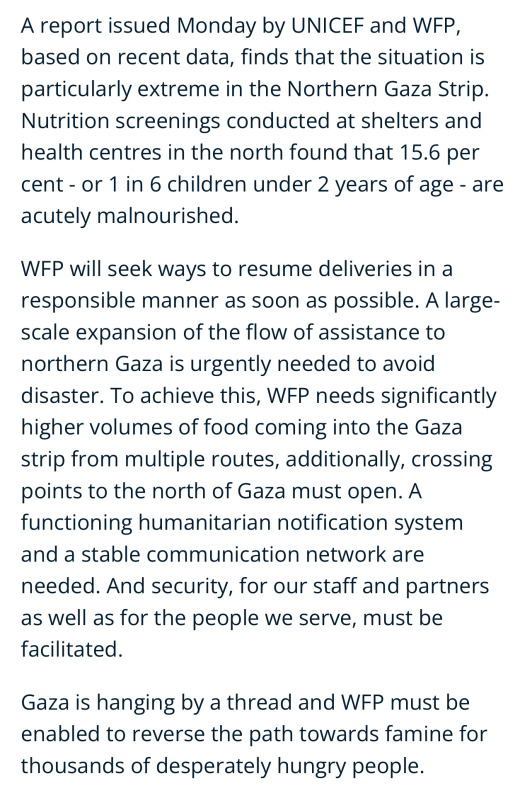
A report issued Monday by UNICEF and WFP, based on recent data, finds that the situation is particularly extreme in the Northern Gaza Strip. Nutrition screenings conducted at shelters and health centres in the north found that 15.6 per cent - or 1 in 6 children under 2 years of age - are acutely malnourished.
WFP will seek ways to resume deliveries in a responsible manner as soon as possible. A large-scale expansion of the flow of assistance to northern Gaza is urgently needed to avoid disaster. To achieve this, WFP needs significantly higher volumes of food coming into the Gaza strip from multiple routes, additionally, crossing points to the north of Gaza must open. A functioning humanitarian notification system and a stable communication network are needed. And security, for our staff and partners as well as for the people we serve, must be facilitated.
Gaza is hanging by a thread and WFP must be enabled to reverse the path towards famine for thousands of desperately hungry people. ]
WFP: Source
23 notes
·
View notes
Text
idk if this is common but when i write anything set in the past i ALWAYS look up climate data. there's a pretty good archive of most major cities dating back many decades that'll tell you the exact temperature throughout the day, wind levels, precipitation, AND the time of sunrise and sunset, and all of these have been useful for me many times. like it not only feels more authentic to use real life info to decide the weather for a scene in a story or something rather than deciding whatever just "feels" more interesting or convenient, but feels like it just innately does a better job at crafting a good story and being immersive
8 notes
·
View notes
Text
Hotter Temperatures Are Causing Trees to Have Heat Strokes. (Sierra Club)
Excerpt from this story from Sierra Club:
When scientist Craig Allen first arrived in the Jemez Mountains of northern New Mexico in the early 1980s, the American Southwest was in the early years of a decades-long wet period. It was, in Allen’s words, a “good time to be a tree.” Allen had gone to New Mexico to study the local forests for the US Geological Survey. Fast forward two decades and conditions have radically changed.
Starting in the late 1990s and early 2000s, the Southwest’s long-term climate pivoted sharply, transitioning to what scientists are now calling a “megadrought.” The drought was marked by a decline in precipitation. But it also included something new: abnormally warm temperatures. The combination would prove deadly. The early 2000s marked the start of a region-wide, massive die-off of trees that continues to this day.
“2002 was the real kick in the teeth in terms of forest dieback here,” says Allen, now an adjunct professor at the University of New Mexico in Albuquerque. “There were millions of acres of different species of trees dying across the whole region.”
What makes the Southwest’s current megadrought so exceptional and so very different from the region’s notorious megadroughts of the past, says Allen, isn’t so much a lack of precipitation as an excessive amount of heat. Scientists have determined that about a third of the strength of the current megadrought is due not to a lack of water but to warming tied to climate change. Heat, it is now known, is making the region’s drought worse. But elsewhere heat is also leading to a very new and worrying development: drought-induced tree die-offs in regions not typically known for droughts.
Allen, a self-described “documentarian” of his region’s ecological collapse, was one of the first scientists to put the pieces of this mystery together. For decades, he observed tree die-offs in New Mexico occurring both at lower, drier elevation sites as well as higher, wetter sites, and for the same reason: Heat was drying the air, and this was stressing and weakening trees, making them vulnerable to insect attacks that would deal the final death blow.
Scientists are now calling this phenomenon “hot drought.” (Or sometimes, “hotter drought,” because droughts generally tend to be hot.) According to a growing body of research, hot droughts have now been tied to tree die-offs the world over, regardless of how much precipitation a region typically gets.
A 2022 study published in Nature Communications combines nearly five decades of data on previously recorded tree die-offs from nearly 700 different locations around the world. From these data, the study concludes that the recent increase in global forest die-offs—recorded at 675 locations on nearly every continent—were due to a “hotter-drought fingerprint.” A fingerprint the researchers further linked to human-caused climate change.
“There is uniformity across this large global database,” says study lead author William Hammond, plant ecophysiologist at the University of Florida. “It shows temperature has played a really important part in tree mortality.”
The study also found that across ecosystems, the same hotter drought fingerprint could be found in previously recorded tree die-offs across nearly every biome examined, wet and dry. This supports conclusions from an earlier 2009 paper led by Allen and published in Forest Ecology and Management.
Hammond says the signal in the data set is clear: Abnormally warm temperatures tied to climate change are killing trees globally. He says he takes issue with scientists who don’t acknowledge this.
“To continue to call this phenomenon ‘drought-induced mortality’—which is by far the term that is pervasive in most of the 154 papers in the database—is pretty much irresponsible at this point, because we have the smoking gun [temperature],” says Hammond.
8 notes
·
View notes
Text
Through local papers and word of mouth, volunteer Daya Shankar keeps track of a very specific cause of death. As soon as he receives news of someone being struck by lightning around his neighborhood in Jharkhand, East India, he picks up his motorcycle and heads to the destination. Sometimes he travels alone, other times with a team of five or six from the organization he volunteers for, the Lightning Resilient India Campaign. It’s a task he is undertaking increasingly often.
Last month, he rode to meet the Manjhi family, who lost an 8-year-old boy, Viresh, and his mother, Subodhra, after a tea stall they were sheltering under was struck during a storm. A lightning bolt can generate temperatures three times hotter than the surface of the sun, with a voltage millions of times higher than a household socket. If it connects with a human, it can stop the heart and respiratory system, damage the brain and nervous system, leave major burns, and cause blunt trauma if victims are flung by the force of being struck. On the day the Manjhis died, lightning also killed another person in the village and injured five others.
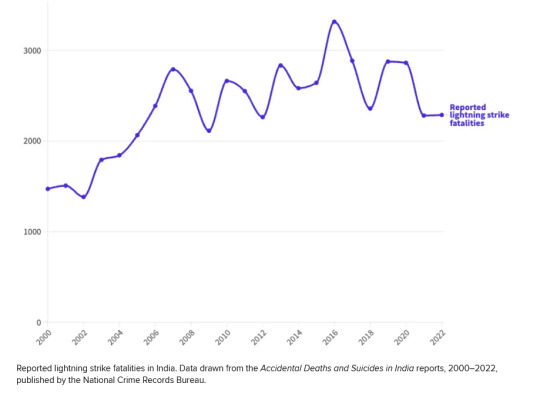
Each year, an estimated 24,000 people worldwide are killed by lightning. While a significant number, deaths per head of population have fallen sharply over the past two centuries, thanks largely due to urbanization, the protection of more substantial housing, and improved weather forecasting. But India’s large rural population remains badly affected. Between 2,000 and 3,000 Indians die annually by lightning, most of them working class people aged 10 to 50. Fatalities have risen by more than 50 percent since the turn of the century, outstripping population growth. Compare that to the US, where fatalities have been gradually falling and number around 20 a year. India can experience more than that number of deaths in a day.
For every person who is killed by lightning, roughly another nine are struck and survive, often with life-changing injuries. And with climate change making stormy weather and lightning more common, activists like Daya believe the Indian government is failing to protect its people. “A bare minimum would be to at least spread information about all things lightning at local government level,” says Daya.
India has systems in place to predict dangerous storms. These work by gathering a lot of precise data, says Sanjay Srivastava, chair of the Climate Resilient Observing-Systems Promotion Council (CROPC), an intergovernmental institute that works to develop resilience against climate change impacts. Srivastava is also the convener of the Lightning Resilient India Campaign.
“Detecting the precise location of a lightning cloud-to-ground strike is a calculation mechanism where a minimum of three devices are required,” says Srivastava. These are radio frequency detectors, to detect the radio waves produced by lightning; a doppler weather radar, to detect precipitation and wind patterns associated with storms that may produce lightning; and a lightning detector, a device specifically designed to detect the electromagnetic signals produced by lightning strikes.
As of April 2022, India’s National Remote Sensing Center had 46 lightning-detection sensors installed across the country. Another institute, Indian Institute of Tropical Meteorology, Pune, has 83 in place. These, along with other private and institutional data, monitor and guide India’s lightning strike warning system.
The data shows that Jharkhand and other neighboring regions in East and Central India are among the country’s hot spots, as they are where hot and dry air currents from the northwest meet moist easterly currents. When clouds encounter warmer air, moist air rises until it reaches the subzero temperatures of the upper atmosphere, where it can freeze into ice particles called graupel. As these then collide with other ice particles, they generate electrostatic charges, which can eventually lead to lightning. Rising global temperatures are increasing this phenomenon.
However, despite advancements in meteorology, the full mechanisms behind lightning’s formation and behavior remain partially shrouded in mystery. The precise triggers, the exact nature of how lightning propagates through the atmosphere, and the factors that determine the intensity of each strike are still not fully understood. The risk to human life can be predicted in only fairly broad terms.
And while these early warning systems exist, their information often does not reach people in time. This is why volunteers like Shankar work to inform people on how to stay safe and teach how to build easy-to-make lightning arrestors—devices that neutralize cloud-to-ground lightning.
The day Shankar visited the Manjhis’ house, it was drizzling. On the way he spotted farmers and locals sheltering under trees. He stopped to inform them that standing under a tree during rainfall increases the chances of getting hit by lightning. But they said there was no other place where they could take shelter.
Lightning strike casualties are more prevalent in rural areas where infrastructure is limited. Concrete houses, which can have protective Faraday cage effects, are less prominent there than in cities, while tall vegetation, which workers might shelter under, can attract strikes. Densely populated areas in stormy regions also see more casualties. “We can say there are two factors behind lightning casualties. There are lots of environmental factors, and then there are socioeconomic factors,” says Anand Shankar, who works at the India Meteorological Department at the Ministry of Earth Sciences in the state of Bihar (Anand and Daya are not related).
Increasingly, attention is focusing on air quality too. In recent research for Bihar, which neighbors Jharkhand and is one of the worst affected states in India, Anand found that particulate matter in the air increased lightning activity in the region. Aerosols such as pollution or dust particles can affect the friction between the particles that generate lightning and make it more common.
But to what extent growing casualties in Bihar can definitively be attributed to pollution or global warming isn’t yet clear, says Ashish Kumar, a colleague of Anand’s at the IMD. “We had no data before 2015–16, so we have not come to the conclusion whether this is happening recently due to climate change.” But Kumar doesn’t refrain from pointing out that a warming planet can lead to increased lightning activities. Research has projected that a 1 degree Celsius rise in temperature can lead to a 12 percent increase in lightning strikes.
When Daya reached the Manjhis’ house, the family told him that Viresh and Subodhra had taken shelter under a plastic-roofed tea stall because a storm had hit on their way back home from their farm. “People consider that saving themselves from the water is most important,” he says, but they fall prey to dangerous lightning strikes if they stand under something that can act as a conductor. “The best option for them would have been to find a concrete shelter.”
Spreading this sort of knowledge is why volunteers like Daya hunt for the places where recent lightning deaths have taken place. “We often arrange talk shows and plays and other things in the rural areas, but people are either too busy or not interested. But when such accidents take place, people get aware and are willing to listen,” he says.
Another way the Lightning Resilient India Campaign tries to reach the masses is through schoolchildren. “They are curious and spread the message in their families and communities,” Daya says. Warnings are also pushed through government hooters and through mobile applications like the Damini app, which triggers a warning notification before a lightning strike.
“It is not like a cyclone, where you have seven days and you are evacuating people,” says Srivastava. “It’s instant. So, those 30 minutes or three hours are the golden hours.” But often farmers who live far away from their houses do not bring mobile phones to their fields and leave very early for work, and might miss the warning alert.
Srivastava and Anand agree that the best solution would be to put up more lightning arrestors. But with limited funds and a lack of government support, campaign volunteers have to resort to promoting the use of DIY lightning arrestors in high-risk areas. These can be made by fixing the metal rim of a bicycle wheel high up on a bamboo stick and attaching the rim to the ground using copper wire. “They are not bad for a small area, but their efficiency is limited when compared with bigger lightning arrestors,” says Srivastava.
In the absence of adequate protections, 16 of the 36 states and union territories in India have started accepting lightning strikes as a state disaster, including Bihar and Jharkhand, and so pay out compensation money of 400,000 rupees ($4,766) to the family of a deceased person. This does something to help families handle the economic shock of losing someone, but still leaves thousands unsupported. “Only 10 percent of people die—90 percent are left with a social trauma,” says Srivastava. “We need to create a psychosocial relief and also proper medical treatment for those who survive,” he says.
6 notes
·
View notes
Text
Can Historical Weather Data Help Us Understand Future Climate Trends?

To understand what the weather will be like in the future, we need to look at a lot of old weather information, historical temperature data, and weather reports. This intricate mosaic of temperature records, alongside other weather information, serves as a key resource for unraveling the patterns that will shape tomorrow's climate. With fancy tools and careful note-taking, weather experts look at how the weather was in the past to tell us what it might be like in the future. In a world where our survival and prosperity are closely tied to weather patterns, the analysis of historical weather reports and temperature data holds greater significance than ever before. Join us on a journey to explore how this rich source of information guides us in predicting the trajectory of our climate.
The Chronicle of Climates: Learning from the Logs
Even before we had all the fancy gadgets we use today, people used to write down what the weather was like. They didn't have numbers, just words to describe it. These old writings were the first step in making a scientific way to measure the weather. Nowadays, these old records show us how the Earth's climate has been changing, and they help us guess what the weather might be in the future. It's like they're a history book of the Earth's weather, helping scientists understand it better.
The Patterns in the Past: Deciphering Data
Decades and centuries of meticulous weather recordings have amassed a wealth of information. It is through the analysis of this historical weather data that scientists can identify patterns and anomalies. These patterns are the rhythms of our planet's climate dance, and understanding them is essential in anticipating future steps. By studying how temperature and weather patterns have changed over time, we can model potential future changes.
Reflecting on Historical Reports
Historical weather reports act as snapshots of the Earth's past atmosphere, offering a time-lapse view of climate change. They reveal how human actions, natural events, and minor variations accumulate and impact the climate. These records serve as a scientific time machine, aiding our understanding of our planet's climate evolution. This knowledge is essential for tackling the challenges posed by a changing climate and safeguarding the well-being of our planet and future generations.
The Role of Technology
Modern technology has taken historical climate data to a whole new level, turning it into more than just records. Powerful computers process enormous amounts of data to create advanced models that give us a sneak peek into what the future climate might be like. These technological leaps are essential for turning what we've learned from the past into practical predictions for the future.
Final thought
Predicting future climate trends is a challenging but vital task. To do this, we need to examine the wealth of historical temperature data and weather data available to us, using the past to inform our future outlook. Services like AWIS Weather Service play a crucial role in this effort, offering detailed insights and forecasts. By combining historical data analysis with advanced forecasting methods, they provide us with the resources to enhance our preparedness and knowledge. To learn more about how they contribute to climate prediction, visit their website Awis.com today.
#Historical Weather Data#Past Weather#Past Precipitation Data#Climate Analytics#Historic Rainfall#Historical Temperature Data
1 note
·
View note
Text
climate change blackpill megapost
there are several climate tipping points identified in the united nations intergovernmental panel on climate change sixth assessment report (chapter 3, specifically). tipping points refer to critical thresholds in a system that, when exceeded, can lead to a significant change in the state of the system, often with an understanding that the change is irreversible. they are:
the greenland ice sheet
the west antarctic ice sheet
the atlantic meridional overturning current
monsoon systems
el niño-southern oscillation
tropical rainforests
northern boreal forests
thawing permafrost
extreme heat
current (2022) global warming of ~1.1°C above preindustrial temperatures already lies within the lower end of some tipping point uncertainty ranges. several tipping points may be triggered in the paris agreement range of 1.5 to <2°C global warming, with many more likely at the 2 to 3°C of warming expected on current policy trajectories.
greenland's ice sheet is in disequilibrium and we are committed to 2-3 meters of sea level rise from its melt alone in the next 200 years.
greenland's ice sheets have been melting twice as fast in the last twenty years as they were during the previous century.
rapid increase in the rate of melting of the west antarctic ice sheet is unavoidable.
the west antarctic ice sheet is retreating twice as fast as previously predicted
because of widespread seawater intrusion beneath the grounded ice of the thwaites glacier.
the west antarctic ice sheet will raise sea levels by four meters when it melts.
this is causing the atlantic meridional overturning current to collapse.
the gulf stream (aka amoc) is weakening. 99% confidence. measured volume through the florida straits has declined by 4% in the past 40 years
the gulf stream will collapse between 2025 and 2095. 95% confidence.
the north atlantic is four standard deviations above its historic temperatures.
when the amoc collapses, the arctic sea-ice pack will extend down to 50°n. the vast expansion of the northern hemispheric sea-ice pack amplifies further northern hemispheric cooling via the ice-albedo feedback.
a collapse of the atlantic meridional overturning circulation would have substantial impacts on global precipitation patterns, especially in the vulnerable tropical monsoon regions in west africa, east asia, and india where they will experience shorter wet seasons and longer dry seasons with an overall decrease in precipitation
although recent studies indicate that the amazon will experience net benefit from the collapse of the amoc with cooler temperatures and increased rainfall
increased el niño intensity will increase the frequency and severity of droughts in the amazon rainforest.
even if we were able to stabilize global mean temperature at 1.5º C, el niño intensity will continue to increase for a century
and the amazon rainforest is currently in the worst drought on record, which may indicate it has passed its threshold to maintain its own wet climate.
while widespread and persistent warming of permafrost has been observed in polar regions and at high elevations since about 1980, the highest permafrost temperatures in the instrumental record were recorded in 2018–2019 (data from 2019-2020)
as of 2019 the southern extent of permafrost had receded northwards by 30 to 80km
soil fires in the canadian arctic are burning the peat underground and melting the permafrost. stat from the study 70% of recorded area of arctic peat affected by burning over the past forty years has occurred in the last eight and 30% of it was in 2020 alone.
nasa finds that tundra releases plumes of methane in the wake of wildfires.
in 2023 eight times more land burned in canada than average.
russian siberia experienced a similarly massive fire season in 2021.
a methane source we weren’t expecting was warmer, wetter conditions to increase organic decomposition in tropical wetlands which is releasing ever increasing amounts of methane.
we have been experiencing exponential rise in atmospheric methane since 2006. historical data indicates that we may have entered into an ice age termination event fueled by these methane releases.
we have been over 1.5º C above pre-industrial temperatures since the beginning of 2023.
this may be because of the extreme el niño conditions of the 2023-24 cycle, but breaches of 1.5°C for a month or a year are early signs of getting perilously close to exceeding the long-term limit
and the world meteorological organization expects us to permanently break 1.5º C of warming from pre-industrial levels within the next five years.
the united nations environmental programme (unep) emissions gap report found that current fossil fuel extraction commitments leave no credible path to keeping warming below 1.5º C. based on current policies we will experience 2.8ºC of warming by 2100. even if all current pledges were implemented and followed through with (which they never have been), we will only be able to limit that to 2.4-2.6ºC of warming.
#this isn't even touching on the anthropological or ecological impacts#just the physics of the predicament#climate change#climate crisis#climate emergency#ipcc#extinction rebellion#last generation#just stop oil#it's the end of the world as we know it
11 notes
·
View notes
Text

Dust from asteroid Bennu shows: Building blocks of life and possible habitats were widespread in our solar system
International study analyzes material from asteroid Bennu that was brought to Earth by NASA's OSIRIS-REx space mission
It took two years for NASA’s OSIRIS-REx space probe to return from asteroid Bennu before dropping off a small capsule as it flew past Earth, which was then recovered in the desert of the U.S. state of Utah on September 24, 2023. Its contents: 122 grams of dust and rock from asteroid Bennu. The probe had collected this sample from the surface of the 500-metre agglomerate of unconsolidated material in a touch-and-go maneuver that took just seconds. Since the capsule protected the sample from the effects of the atmosphere, it could be analyzed in its original state by a large team of scientists from more than 40 institutions around the world.
The partners in Germany were geoscientists Dr. Sheri Singerling, Dr. Beverley Tkalcec and Prof. Frank Brenker from Goethe University Frankfurt. They examined barely visible grains of Bennu using the transmission electron microscope of the Schwiete Cosmochemistry Laboratory, set up at Goethe University only a year ago with the support of the Dr. Rolf M. Schwiete Foundation, the German Research Foundation and the State of Hesse. Its goal: to reconstruct the processes that took place on Bennu’s protoplanetary parent body more than four billion years ago and ultimately led to the formation of the minerals that exist today. The Frankfurt scientists succeeded in doing this by analyzing the mineral grains’ exact structure and determining their chemical composition at the same time. They also carried out trace element tomography of the samples at accelerators such as DESY (Deutsches Elektronen-Synchrotron) in Hamburg.
“Together with our international partner teams, we have been able to detect a large proportion of the minerals that are formed when salty, liquid water – known as brine – evaporates more and more and the minerals are precipitated in the order of their solubility,” explains Dr. Sheri Singerling, who manages the Schwiete Cosmo Lab. In technical terms, the rocks that form from such precipitation cascades are called evaporites. They have been found on Earth in dried-out salt lakes, for example.
“Other teams have found various precursors of biomolecules such as numerous amino acids in the Bennu samples,” reports Prof. Frank Brenker. “This means that Bennu’s parent body had some known building blocks for biomolecules, water and – at least for a certain time – energy to keep the water liquid.” However, the break-up of Bennu’s parent body interrupted all processes very early on and the traces that have now been discovered were preserved for more than 4.5 billion years.
“Other celestial bodies such as Saturn's moon Enceladus, or the dwarf planet Ceres have been able to evolve since then and are still very likely to have liquid oceans or at least remnants of them under their ice shells,” says Brenker. “Since this means that they have a potential habitat, the search for simple life that could have evolved in such an environment is a focus of future missions and sample studies.”
OSIRIS-REx NASA’s Goddard Space Flight Center in Greenbelt, Maryland, provided overall mission management, systems engineering, and the safety and mission assurance for OSIRIS-REx. Dante Lauretta of the University of Arizona, Tucson, is the principal investigator. The university leads the science team and the mission’s science observation planning and data processing. Lockheed Martin Space in Littleton, Colorado, built the spacecraft and provided flight operations.
4 notes
·
View notes
Text


National Weather Observers Day
National Weather Observers Day is on May 4. With their observations and weather reports, many people assist the National Weather Service to achieve its purpose of preserving life and property. SKYWARN, Cooperative (Co-Op) Observers, CoCoRaHS (Community Collaborative Rain, Hail, and Snow Network), and the general public are all part of this network.
History of National Weather Observers Day
Alan Brue, who studied psychology at the State University of New York, invented the day on May 4, 1989. This day was developed for weather amateurs and professionals to honor their passion for the weather. Every year on May 4, this day is commemorated for those who enjoy viewing different weather phenomena.
With their sightings and weather reports, many individuals and groups assist the National Weather Service in fulfilling its objective of protecting people and property.
As a volunteer, you can be a part of the CoCoRaHS Observers Team, which is available to anyone ready to work on measuring and mapping precipitation. In this program, you will receive all of the necessary equipment and training on how to measure and map precipitation and how to prepare reports.
It’s simple to set up; get a rain gauge, hang it outside during the rainy season, check the rain in the gauge, and report your findings on the National Weather Service’s website.
The major goal of this day is to emphasize the importance of professionals who work in weather services 24 hours a day, seven days a week, to warn people about approaching storms and other weather changes. A thousand weather observations are made every day by weather spotters and weather stations all around the world.
These observations give crucial information that warns the public about impending storms from all three locations; land, sea, and air. They also aid in a better understanding of weather events and the analysis of historical data.
National Weather Observers Day timeline
650 B.C.
Weather Prediction Using Cloud Patterns
The Babylonians use astrology and cloud patterns for weather prediction.
1835
Modern Era of Weather Forecasting
The invention of the telegraph ushers in modern-day weather forecasting.
1859
Weather Forecasting is Introduced
FitzRoy develops charts to report weather phenomena he describes as “forecasting weather,” thereby inventing the term ‘weather forecast.’
1989
National Weather Observers Day is Created
Alan Brue creates National Weather Observers Day on May 4.
National Weather Observers Day FAQs
What do weather observers do?
A weather observer collects, records, and maps weather conditions, both good and bad. Observers need to be willing to gather weather information in the rain, blinding heat, and other extreme conditions.
What equipment do weather observers use?
Observational data is collected using buoys, radiosondes, doppler radar, and weather satellites, among others. The data is fed into the N.W.S. forecast models that use present and past weather information to develop forecast guidance for meteorologists.
How is weather data used?
Climate and weather data are utilized in different ways. Decision-makers in towns and cities use this information to plan for extreme weather conditions, water management, and even energy needs.
National Weather Observers Day Activities
Sign up for a weather spotter’s course: If you have a passion for observing weather phenomena, you should take a course for Weather Spotters. These courses teach everything from identifying clouds to tracking shifting weather and so on.
Play a prediction game: Play a prediction game with friends and family where you all try to predict the weather for the next week and see who is right. The winner can get a gift, and everyone gets to sharpen their weather-watching skills.
Make your very own barometer: Making a barometer is an excellent way to spend Weather Observers Day. It can be put together quite easily using a few materials around the home. Look up tutorial videos and get to work!
5 Important Facts About The Weather
Amateur league: There is a group for amateur weather enthusiasts called the Association of American Weather Observers.
Incoming: Storm spotters came to the fore during WWII, alerting fighting forces of incoming lightning.
Judge of the skies: Honorable William Rehnquist, the U.S. Supreme Court’s former Chief Justice, was a weatherman.
Blinding speed: Raindrops can reach a maximum speed of 18-mph.
Doing the numbers: The first-ever mathematical weather forecast lasted six hours and took about six weeks to calculate.
Why We Love National Weather Observers Day
Weather predictions save lives and property: The National Weather Service’s vision is to use the weather observations and reports to protect life and property. Without these timely bits of information, storms and other weather phenomena would wreak even more havoc.
We get to learn a lot: Weather observation gives us valuable insight into the peculiarities of different weather phenomena. We get to explore and gain more understanding, enjoying nature in all its magnificence.
Appreciation for weather people: National Weather Observers Day is dedicated to all the players that contribute to the amazing work done by the National Weather Service. On this day, we get to show our appreciation for their work that often goes unnoticed.
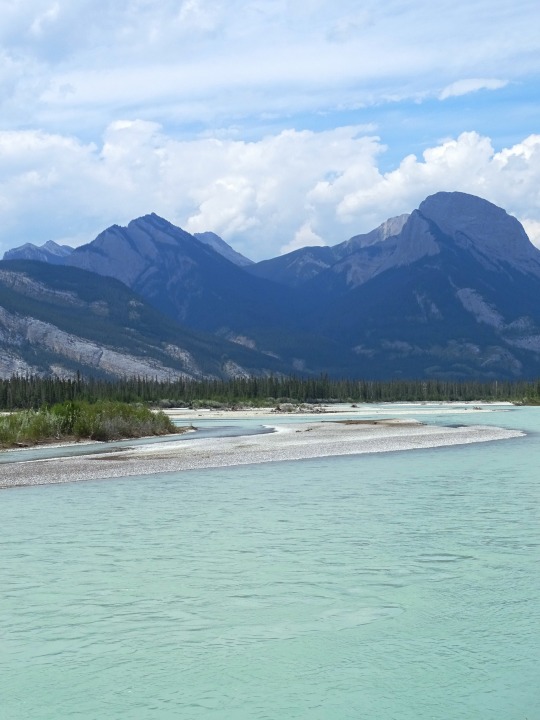
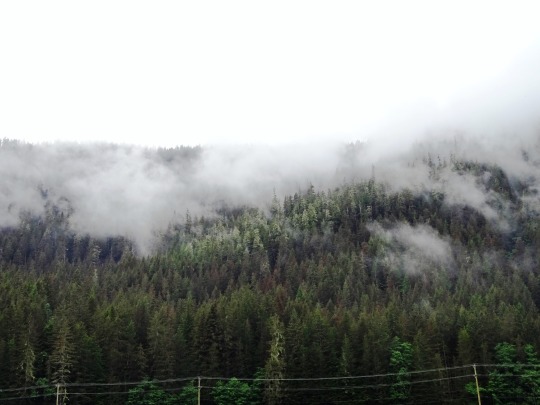
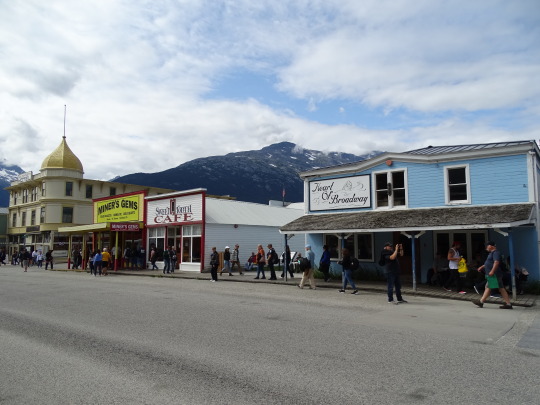
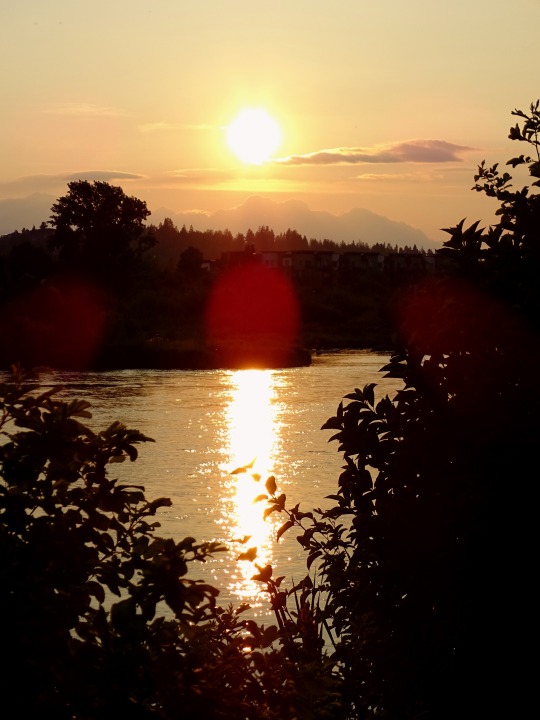
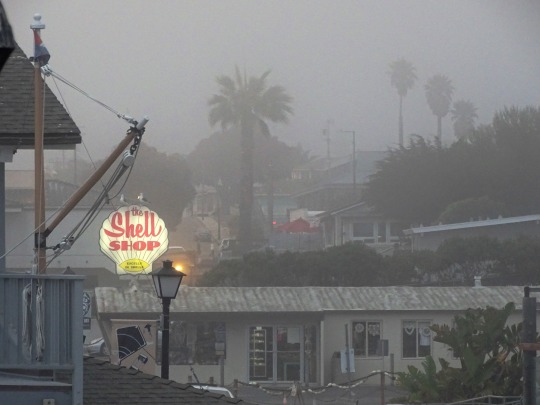
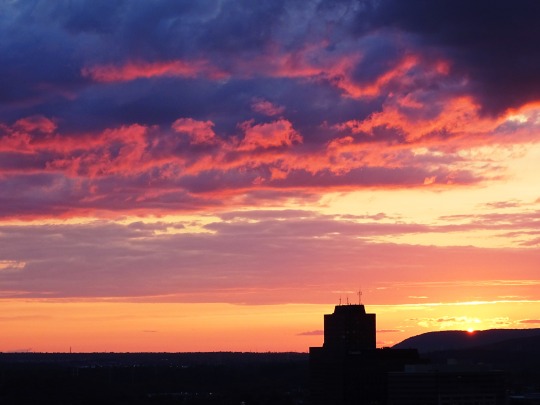
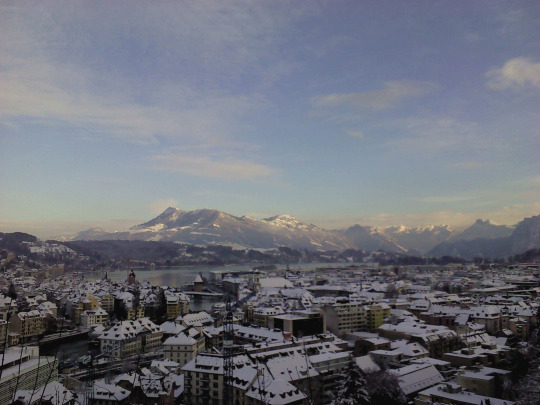
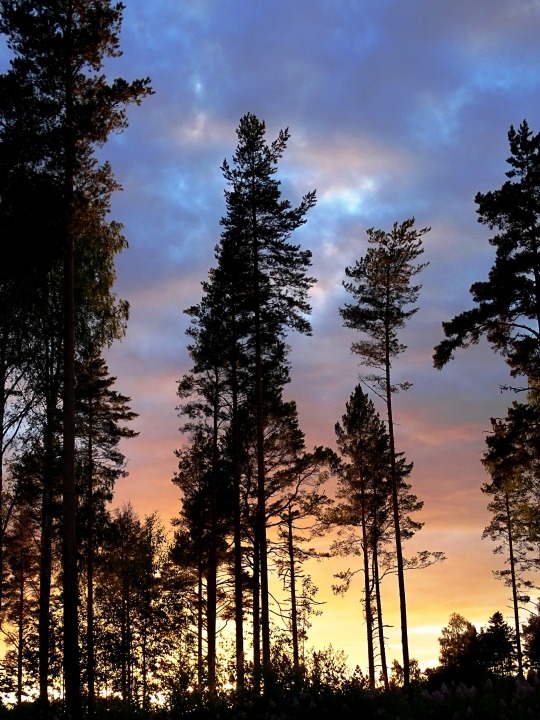
#summer 2023#Alberta#British Columbia#Yukon#Canada#National Weather Observers Day#NationalWeatherObserversDay#4 May#fog#snow#Lucerne#Luzern#Schweiz#Switzerland#original photography#landscape#cityscape#architecture#Sweden#Spain#USA#travel#vacation#tourist attraction#landmark#sky#countryside#rain#clouds#nature
6 notes
·
View notes
Text
[chp 5 pike/spock fic]
“You’re half human, but your physiology is mostly Vulcan. I guess I’m curious what it was like. How different it really was to be human for a few days, now that you’re back to yourself.”
“Confusing,” Spock replied honestly. “I have always been taught emotions run deeper in Vulcans than in humans. And that difference plays a large role in how we have always explained to our human allies our need for the strict controls offered by the path of pure logic, as well as why we do not expect humans to do the same. But that difference was so negligible as to be absent in my altered state. VSA medical experts opined that the late-onset regressive puberty that was triggered by the change was responsible for my heightened emotions during that time, rather than my humanity itself, but I am not convinced.”
“Wait, the VSA talked to you about this?”
“Yes, after reading Christine’s paper about changing me back using ancient medical arts, they had…questions.”
“That sounds invasive.”
“Their curiosity was logical. There are no records of any Vulcan experiencing the human condition.”
Chris hummed in understanding. For all that Spock’s tone was exceedingly dry, Chris knew well enough that extra attention from Vulcan doctors wasn’t exactly high on Spock’s list of desirable things. He was sure Nurse Chapel hadn’t predicted her paper would precipitate them going around her back and interrogating the subject patient, whose identity wasn’t rocket science to figure out given the small number of Vulcans serving in Starfleet. Chris wasn’t even sure whether Spock told her the Vulcans had followed up with him about it.
“So because your hormones were all out of whack, they discarded any challenge to the prevailing theory about the emotional gulf between our peoples.”
“Precisely.” Spock closed his eyes. “And of course my hormone spikes were not the only affliction impeding the baseline of my suppositions.”
Chris sighed. He knew what ‘affliction’ many Vulcans treated Spock as suffering from. “Your human half.”
“Indeed. In any event, it was convenient that my people were not given cause to reassess their superiority in light of my unique condition both before and during the anomalous event.”
“Convenient,” Chris repeated sadly. “And what do you think? Because I think you’re the product of a loving and intentional desire for a bridge between us. And I think you were uniquely situated to offer insightful physiologically-based philosophical commentary. To be blunt, they should care what you think about it. I know I do.”
Spock’s brown eyes held many emotions – an echo of Chris’s sadness, playful amusement at Chris’s steadfast declaration, and maybe a sliver of hope. “I think we have more commonalities than differences. However, the differences in our brain chemistries cannot be denied. Like Vulcans, humans have a war-torn past. But billions of humans, who wholly lack Vulcan physiological controls, are capable of living peacefully under the terms of the Federation. Some of the Vulcans that T’Pring works with have abdicated those controls. The results are never…peaceful. Vulcans who eschew Surak’s path are often irrepressibly violent.” Spock paused. “I have reached no particular conclusion. I do wonder if with more time to acclimate to my humanity, past the settling point, I might have reached a deeper understanding. Still, despite the limitations on my data acquisition, I do not regret Christine’s brave efforts to restore me to my usual if unique state of being.”
“I could give her another valor medal,” Chris offered.
Read the full chapter on AO3.
#what if I took SNW Charades and made it sadder#snw spock#snw charades#pikespock#pike x spock#fic update#fic rated E#Vulcans#this snippet rated g for everyone
5 notes
·
View notes