#Acoustics
Explore tagged Tumblr posts
Text

"The movie below shows the interference pattern generated in a ripple tank (in 2 dimensions) where water waves are generated by two small vibrating sources. The location of the sources is marked by the purple circles." https://salfordacoustics.co.uk/sound-waves/superposition/interference-from-two-point-sources
20 notes
·
View notes
Text
Dry Plants Warn Away Moths

Drought-stressed plants let out ultrasonic distress cries that moths use to avoid plants that can't support their offspring. In ideal circumstances, a plant is constantly pulling water up from the soil, through its roots, and out its leaves through transpiration. This creates a strong negative pressure -- varying from 2 to 17 atmospheres' worth -- inside the plant's xylem. (Image credit: Khalil; research credit: R. Seltzer et al.; via NYTimes) Read the full article
155 notes
·
View notes
Text
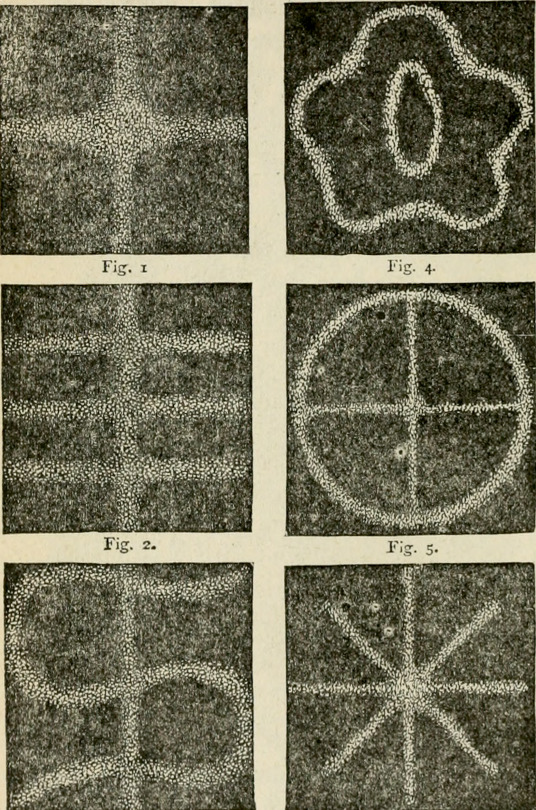
"Marvelous sound forms." Marvelous wonders of the whole world. 1886.
Internet Archive
683 notes
·
View notes
Text

Sound
I've already posted a few videos and text explanations from others about what sound is, so I'm not going to go too in detail again here on this post, but a few terms for you to start off the month:
Sound can be defined in a variety of different ways using different terms. It is often described as a mechanical wave, a pressure wave, as longitudinal waves that travel through a medium (though sound can also take the form of shear or surface waves), or as an energy, and is all of these things. (Ultrasounds and infrasounds are simply sounds the average human can't hear, with infrasounds being lower in hertz and ultrasounds being higher in hertz than the human range, where hertz are a measure of the frequency of sound waves.)
Acoustics is the science of sound, its "production, control, transmission, reception, and effects", and so on.
Here are a few resources if you're interested in diving more into exactly what sound is, beyond those posts already shared:
NASA
Iowa State University, Center for Nondestructive Evaluation
Brigham Young University
Stanford University
For the rest of this month, posts will be about the applications of sound and the study of acoustics in the field of materials science and engineering (or adjacent field), including (but not limited to) going into more detail on the speed of sound, nondestructive evaluation methods using sound, and acoustic levitation.
22 notes
·
View notes
Text


ianward_e
#Sting#fieldsofgold#atkinguitars#acousticguitars#acoustics#acousticlove#acousticguitarist#acousticmusic#handmadeguitar#boutiqueguitars#agedguitar#handpainted#britishmade#guitarbuilding#guitarcollection#guitarcollector#guitarworldmagazine#guitarphotography#guitarsofinstagram#guitarheaven
36 notes
·
View notes
Text
Physics Friday #14: Sound (Part 2/2)
Preamble: Let's get straight into it
Education Level: Primary School (Y5/6)
Topic: Sonic Physics (Mechanics)
The previous part 1 of my sound post is here.
Pitch and Frequency
Pitch and frequency are related to eachother, the only difference being that frequency is a physical interpretation of sound and pitch is our own mental interpretation of it.
But what exactly is frequency?
Go back to last time's example of a tick sound occurring at regular intervals ... because this sound is repeating, we can describe it's behaviour by measuring mathematical properites:
How much time passes in-between each tick (Period)
How many ticks occur every second (Frequency)
These two ideas are related to eachother, in fact Frequency is 1/Period. If you have a tick every half-second, then you can say the tick occurs twice every second.
We measure sound in Hertz, which is effectively a measure of ticks per second.
Most sounds, however, don't work this way, with repeated ticks. They act as proper waves. With zones of high pressure (peaks), and low pressure (troughs). This is where we have to introduce another variable into our equation:
The physical difference separating each peak (Wavelength)
Since these waves travel forward in the air, a detector (like our ears) will pick up the peaks and troughs as they reach our ear. We can measure frequency or period by recording the speed at which our peaks reach our ear.
But we also can relate frequency to wavelength. After all, the further apart the waves are separated, the more time it'll take for a peak to reach us after the previous one.
We quantify this relationship using c = fλ. Where c is the speed of the wave, f is the frequency, and λ is the wavelength.
Notice that we can also say cT = λ, where T is the period. This demonstrates that the physical wavelength is proportional to the amount of time between each peak.
So where does pitch come in?
As mentioned in part 1, if we continue to decrease the time between each tick, or increase the frequency, at some point we'll begin to hear a sound.
This is our brain playing a trick on us. It's like frames-per-second but for our ears. Below some fps threshold, we can see the individual pictures of a video, but above the threshold, it looks like a continuous film. Notice that fps is also another form of frequency.
When we reach this level, our brain can't distinguish between each tick and sees it as one sound. We begin to hear our first sound.
At this point, frequency becomes tied to pitch. The more rapid the ticking becomes, the higher of a pitch we hear. This is a choice that our brain makes - it's purely psychological.
Mixing different pitches
Combining different pitches allows us to create a foundation for music. In western music, our source of harmonics comes from Pythagoras, who kinda fucked it up by not using irrational numbers.
An octave is defined as a higher sound that has twice the frequency of the lower sound i.e. a ratio of 2:1. One octave above middle C (at about 262 Hz) gives us C5 (at about 524 Hz).
We can create further subdivisions like a perfect fifth, where frequencies form a 3:2 ratio. Or a perfect fourth, which has a ratio of 4:3.
Volume, Intensity, and the Inverse Square Law
Volume is directly related to the amplitude of a sound wave. Effectively, how strongly is the air being compressed at each peak?
Again, volume is just another psychological interpretation of a physical phenomena. Similar to how our eyes see brightness.
Amplitude isn't just interpreted as volume, it is also the power that the sound waves carry. Smaller amplitudes correspond to less energy contained within the moving particles.
We measure intensity logarithmically, because that's what our ears here. Effectively a wave sounds twice as loud only if the wave is 100 times as amplified. It's a similar effect to pitch, where we multiply frequencies instead of adding them.
That's where the decibel scale comes in. 1 dB = a 10x increase in the sound's power output. The decibel scale is used generally for a lot of measurements of wave/power intensity. However it just so happens that our ears behave in very similar ways.
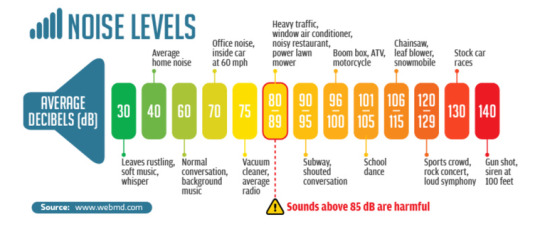
Image credit: soundear.com
Notice that louder sounds are more likely to damage our ear. That's because when loud sounds reach our ear, it causes the inner components to vibrate. This vibration amplitude generally is proportional to the amplitude of the waves.
Too loud of a sound means that our eardrums are vibrating with too great of a physical movement. This can create tears in tissue that damage our ears' sensitivity to sound.
Sound looses power over distance
If you stand far away enough from a sound source, it sounds fainter, eventually becoming unhearable.
This is because of the inverse square law. As sound spreads out over distance, it has to emanate in the form of a sphere, going outward in every direction, in order to maintain consistency of direction.
The same amount of power gets spread thinner and thinner over the bubble that it creates. The surface area of a sphere increases to the square of it's radius.
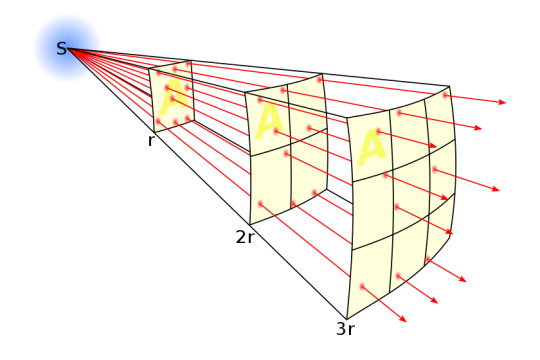
Image Credit: Wikipedia
Thus we get a decrease in volume over time.
What the Actual Fuck is Timbre, and how do you pronounce it? (also Texture too)
Unfortunately I still don't know how to pronounce it.
Timbre is defined as the quality and the colour of the sound we hear. It also includes the texture of the sound. It's sort of the catch-all for every other phenomena of sound.
Timbre is a bit more complex of a phenomena. In that, it combines basically everything else we know about how we hear sound. So I'll go one by one and explain each component of what makes Timbre Timbre.
Interference
Wave interference is an important property that needs to be understood before we actually talk about timbre. Sound waves often can overlap eachother in physical space, normally caused by multiple sound sources being produced at different locations.
These sound sources often will create new shapes in their waveform, via interference.
Constructive interference is when the high-pressure zones of two sound waves combine to produce an even-higher-pressure zone of wave. Effectively pressure gradient add onto eachother.
Destructive interference is when a high-pressure zone overlaps with a low-pressure zone, causing the pressure to average out to baseline, or something close to the baseline.
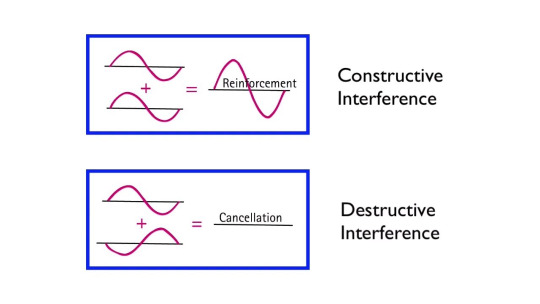
Image Credit: Arbor Scientific (Youtube)
We can look at multiple waves acting continuously over a medium to see how their amplitudes will add up together using interference. This is the origin of more unique wave patterns.
The shape of a wave
Sound waves can come in different varieties. While the most basic shape is the sine wave. We can add different intensities, frequencies and phases of sine waves to produce more complex patterns.
I won't go into how this combination works because that's better left for a Fourier series topic. Just know that pretty much any sound can be broken down into a series of sine waves.
These patterns have a different texture, as they combine multiple different monotone sounds. Take a listen to a sawtooth wave vs a sine wave:
Warning: the sawtooth wave will sound a lot louder than the sine wave.
This gives us a different sound texture.
Resonance
When you play a musical instrument at a particular frequency, the instrument is often resonating.
Say you produce sound within an enclosed box. Producing it at one end. Eventually the sound will reach the end of the box and bounce back from reflection (as we'll see later).
The sound will bounce back and forth, combining itself with the previous waves to produce more and more complex waveforms.
But there is a particular frequency, at which, the waves will perfectly interfere with eachother to produce what's known as a standing wave.
A standing wave will oscillate, but it will appear as if it's not moving forward. Of course, power is still moving throughout the wave, as we'll still be able to hear something.
This standing wave can only occur at a particular frequency, one in which the wave perfectly interferes with it's reflection within the box.
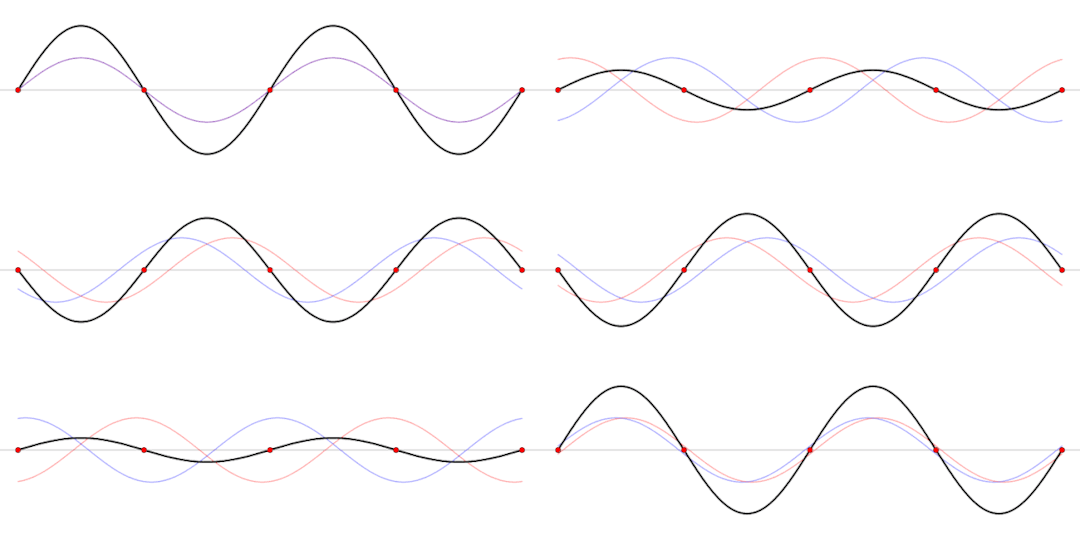
A standing wave (black) that is produced by two sine waves (blue and red) moving in opposite directions Image source: Wikipedia
This frequency is called the resonant frequency of the box. This frequency depends on several factors like the speed of the wave, the material inside the box, the shape of the box, and the length of the box.
The resonant frequency can be activated by our voices, as our voices or just blowing air is already a combination of different sound frequencies. The non-resonant frequencies will eventually loose all of their power as they destructively interfere, leaving only the resonant frequency, which gets amplified by what we put in
For example, you can fill a glass bottle halfway with some water, blow in it, and it will produce a particular sound. Fill it with more water, and the pitch increases - i.e. by adding the water we increase the resonant frequency.
All instruments have one or more resonant frequencies based on their material and shape (I say multiple because some instruments can me modelled as multiple boxes. Like a violin will have the inside of the wood, the wood itself, the strings, etc.).
Instruments also allow us to alter the resonant frequency by playing it differently (like putting a finger over your recorder's hole (phrasing)).
These differences in how we obtain resonance can also affect the quality of the sound.
Overtones
Resonance is not just generated with a single resonant frequency, we can create resonance with higher multiples of the the same fundamental frequency.
This is because in our box model, multiplying the fundamental frequency will allow us to create a standing wave, just with a shorter wavelength:
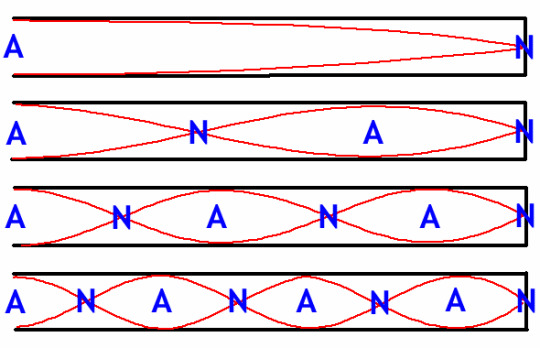
The A's stand for antinodes, which vibrate in the standing wave with the maximum amplitude. The N's stand for nodes, which do not move at all.
Image Credit: Macquarie University
Direct multiples of the fundamental frequency are called harmonics. Instruments can also produce other frequencies not directly harmonic depending on the structure of the 'box' they utilise.
These additional frequencies, ones which come often in fractional multiples of the fundamental are called partials. Both partials and harmonics represent the overtones of an instrument.
Overtones are what give sound additional character, as they allow instruments to not just resonate at the note they play, but at other combined frequencies. In some instruments, the overtones dominate over the fundamental - creating instruments that can play at much higher pitches.
Envelopes and Beats
Say we add two sine waves together (red and blue), each with slightly different frequencies, what we get is this:
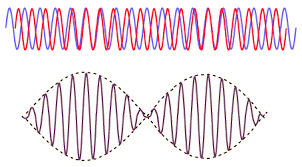
Image Credit: HyperPhysics Concepts
We can see that the brown wave has a singular oscillation frequency, but also it's amplitude continuously scales with reference to this hidden envelope frequency, called the beat frequency (dotted line).
This difference between the actual wave's real frequency and the wave's overall frequency envelope. Is another source of timbre.
Notes, and the way we play them will often generate unique and different envelopes depending on how they are played. For example a staccato quarter-note will have a different envelope to a softly played quarter-note.
Other properties of Sound
Reflection
Different mediums mean different speeds of sounds e.g. molecules in wood (solid) are harder to move than molecules in air (gas).
These different speeds create several effects. Including the reflection of waves. Often waves require a bit of power in order to physically overcome the resistances to vibration of a particular medium.
Often this leads to sound waves bouncing back off harder-to-traverse surfaces.
Say that a sound wave travels through the air and reaches a wooden wall. The atoms vibrating in the air will hit against the wooden wall, transferring only some of their energy to the resistant wood.
The wood atoms on the border of the wall will bounce back, as expected. But this time they will transfer energy back into the air at a much greater magnitude due to newton's third law.
Thus while some of the sound wave ends up going deeper into the wood, the wood will push back and cause the air to vibrate in the opposite direction, creating a reflected wave.

Image credit: Penn State
We characterise the amount of power being reflected versus transmitted versus absorbed using portions:
A + R + T = 1
A = Power absorbed into the material (e.g. warms up the material)
R = Power reflected back
T = Power transmitted into the new medium
This is both an explainer as to why rooms are both very good, and very bad at keeping sound inside them. It really depends on the rigidity and shape of the material they are bordered by.
Refraction
Just like light, sound waves can also refract. Refraction is actually a lot simpler to understand once you already realise that waves will both reflect and transmit across medium changes.
Refraction is just combining the results of incomplete reflection (i.e. transmission) with some angle.
I won't go into refraction in too much detail, as it's worth a different topic. But effectively we experience snell's law but modified for sound.
Diffraction
Sound waves, like all waves propagate spherically (or circularly in 2D).
When travelling around corners, sound can often appear louder than if you were further away, looking at the source more directly.
This is because spherical waves will often 'curve' around corners. This is better described by light diffraction. Which is something for another time.
Conclusion
In conclusion, that's how sound works, mostly. This is a topic that is a little less closer to my expertise. Mainly because it delves into more musically-inclined phenomena that I am less familiar with. But I'm sure I did a good job.
Unfortunately, it seems like the plague of the long post is not yet over. Perhaps I need to get into a lot more specific topics to make things better for me and you (the reader).
Anyways, my exams are done. I am done. I do not have to do school anymore. Until I remember to have to get ready for my honours year (a.k.a. a mini-masters degree tacked on after your bachelor's degree).
Until next time, feel free to gib feedback. It's always appreciated. Follow if you wanna see this stuff weekly.
Cya next week where I will probably try another astronomy topic, or something like that.
87 notes
·
View notes
Text
youtube
Is this not the coolest shit you've ever seen??They figured out levitation using acoustics and how to use it for contactless construction. I love you acoustics I love you resonance frequency
28 notes
·
View notes
Text
you know about musical tuning right? harmonics? equal temperament? pythagoras shit? of course you do (big big nerd post coming)
(i really dont know if people follow me for anything in particular but im pretty sure its mostly not this)
most of modern western music is built around the 12-EDO (12 equal divisions of the octave, the 12 tone equal temperament), where we divide the octave in 12 exactly equal steps (this means that there are 12 piano keys per octave). we perceive frequency geometrically and not arithmetically, as in that "steps" correspond to multiplying the frequency by a constant amount and not by adding to the frequency
an octave is a doubling of the frequency, so a step in 12-EDO is a factor of a 12th root of 2. idk the exact reason why we use 12-EDO, but two good reasons why 12 is a good number of steps are that
12 is a nice number of notes: not too small, not too big (its also generally a very nice number in mathematics)
the division in 12 steps makes for fairly good approximations of the harmonics
reason 2 is a bit more complex than reason 1. harmonics are a naturally occurring phenomena where a sound makes sound at the multiples of its base frequency. how loud each harmonic (each multiple) is is pretty much half of what defines the timbre of the sound
we also say the first harmonics sound "good" or "consonant" in comparison to that base frequency or first harmonic. this is kinda what pythagoras discovered when he realized "simple" ratios between frequencies make nice sounds
the history of tuning systems has revolved around these harmonics and trying to find a nice system that is as close to them while also avoiding a bunch of other problems that make it "impossible" to have a "perfect tuning". for the last centuries, we have landed on 12 tone equal temperament, which is now the norm in western music
any EDO system will perfectly include the first and second harmonics, but thats not impressive at all. any harmonic that is not a power of 2 is mathematically impossible to match by EDO systems. this means that NONE of the intervals in our music are "perfect" or "true" (except for the octave). theyre only approximations. and 12 steps make for fairly close approximations of the 3rd harmonic (5ths and 4ths), the 5th harmonic (3rds and 6ths) and some more.
for example, the 5th is at a distance of 7 semitones, so its 12-EDO ratio is 2^(7/12) ~= 1.4983, while a perfect 5th would be at 3/2=1.5 (a third harmonic reduced by one octave to get it in the first octave range), so a 12-EDO fifth sounds pretty "good" to us
using only 12-EDO is limiting ourselves. using only EDO is limiting ourselves. go out of your way, challenge yourself and go listen to play and write some music outside of this norm
but lets look at other EDO systems, or n-EDO systems. how can we measure how nicely they approximate the harmonics? the answer is probably that there is no one right way to do it
one way we could do it is by looking at the first k harmonics and measuring how far they are to the closest note in n-EDO. one way to measure this distance for the rth harmonic is this:

adding up this distance for the first k harmonics we get this sequence of measures:
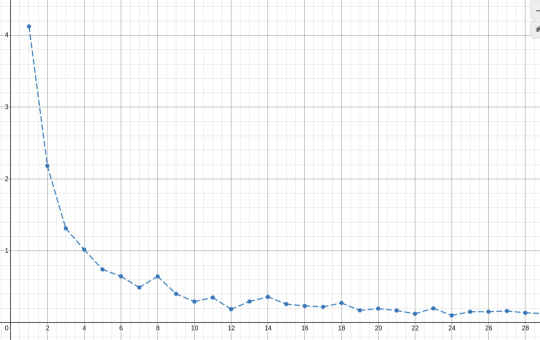

(this desmos graph plots this formula as a function of n for k=20, which seems like a fair amount of harmonics to check)
the smallest this measure, the "best" the n-EDO approximates these k harmonics. we can already see that 12 seems to be a "good" candidate for n since it has that small dip in the graph, while n=8 would be a pretty"bad" one. we can also see that n=7 is a "good" one too. 7-EDO is a relatively commonly used system
now, we might want to penalize bigger values of n, since a keyboard with 1000 notes per octave would be pretty awful to play, so we can multiply this measure by n. playing around with the value k we see that this measure grows in direct proportion to k, so we could divide by k too to keep things "normalized":

plotting again, we get this

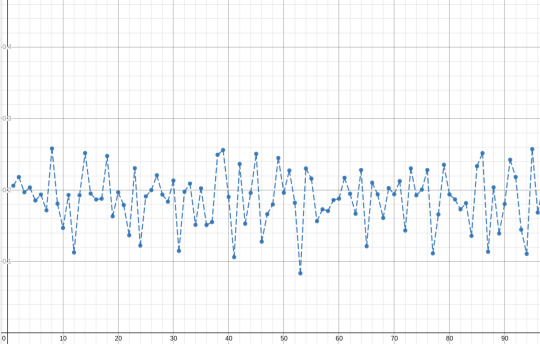
we can see some other "good" candidates are 24, 31, 41 and 53, which are all also relatively commonly used systems (i say relatively because they arent nearly as used as 12-EDO by far)
increasing k we notice something pretty interesting
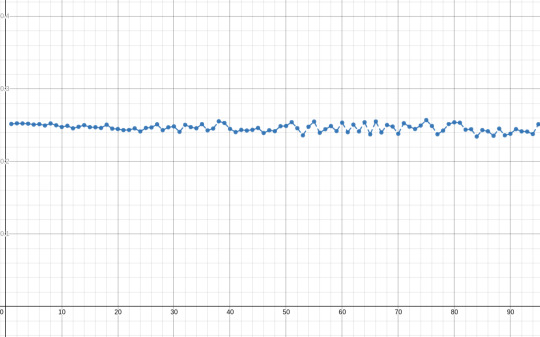

(these are the same plots as before but with k=500 and k=4000)
the graph seems to flatten, and around 0.25 or 1/4. this is kinda to be expected, since this method is, in a very weird way, measuring how far a particular sequence of k values is from the extremes of an interval and taking the average of those distances. turns out that the expected distance that a random value is from the extremes of an interval it is in is 1/4 of the interval's length, so this is not that surprising. still cool tho
this way, we can define a more-or-less normalized measure of the goodness of EDO tuning systems:

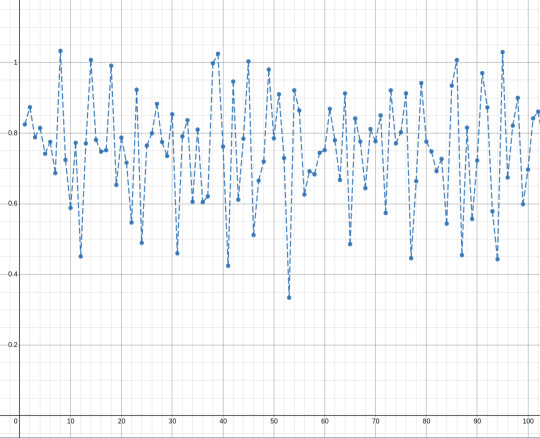
(plot of this formula for k=20)
this score s_k(n) will hover around 1 and will give lower scores to the "best" n-EDO systems. we could also use instead 1-s_k(n), which will hover around zero and the best systems will have higher scores
my conclusion: i dont fucking now. this was complete crankery. i was surprised the candidates for n this method finds actually match the reality of EDO systems that are actually used
idk go read a bit about john cage and realize that music is just as subjective as any art should be. go out there and fuck around. "music being a thing to mathematically study to its limits" and "music being a meaningless blob of noise and shit" and everything in between and beyond are perfectly compatible stances. dont be afraid to make bad music cause bad music rules
most importantly, make YOUR music
77 notes
·
View notes
Text
I began to notice this animal dimension in my own speaking—conscious now not only of the denotative meaning of my terms, but also of the gruff or giddy melody that steadily sounds through my phrases, and the dance enacted by my body as I speak—the open astonishment or the slumped surrender, the wary stealth or the lanky ease. Trying to articulate a fresh insight, I feel my way toward the precise phrase with the whole of my flesh, drawn toward certain terms by the way their texture beckons dimly to my senses, choosing my words by the way they fit the shape of that insight, or by the way they finally taste on my tongue as I intone them one after another. And the power of that spoken phrase to provoke insights in those around me will depend upon the timbre of my talking, the way it jives with the collective mood or merely jangles their ears.
David Abram, Becoming Animal: An Earthly Cosmology
#quote#David Abram#Abram#Becoming Animal#language#linguistics#sound#acoustics#ecology#nature#Earth#environment#landscape#ecosystem#voice#words
16 notes
·
View notes
Text
Tracking Tonga's Boom

When the Hunga Tonga-Hunga Ha’apai volcano erupted in January 2022, its effects were felt -- and heard -- thousands of kilometers away. A new study analyzes crowdsourced data (largely from Aotearoa New Zealand) to estimate the audible impact of the eruption. (Image credit: NASA; research credit: M. Clive et al.; via Gizmodo) Read the full article
56 notes
·
View notes
Text
youtube
Acoustic Engineer on Redesigning Cities to Eliminate Noise | WSJ Pro Per... by The Wall Street Journal
#sound#acoustics#design#engineering#science#city design#urban design#city planning#urban planning#Youtube
7 notes
·
View notes
Text

Sound Attenuation and Impedance
Just as waves of light can be reflected, refracted, absorbed, etc., so to can waves of sound. Even just traveling through the air results in a gradual loss of sound as the atoms and molecules that make up the air interact with the energy. Acoustic attenuation is the measurement of the energy that is lost during the propagation of sound through a medium. As energy can never be created or destroyed, part of the sound energy that is lost is converted into heat energy. The energy of sounds can also cause deformation in materials.
In general, soft and porous materials (including liquids and gases) tend to absorb more sound energy, while harder and denser materials, such as metals, absorb less. The angle at which sound interacts with an object, and it's frequency, also has an important effect. The degree of a material's attenuation is measured by its attenuation coefficient; the higher the value, the more sound energy is lost, resulting in quieter sounds at a distance. It is often measured in units of decibels per meter. In materials characterization methods that rely on acoustics, the attenuation of a material is significant, affecting the depth of penetration of sound waves.
Acoustic impedance, meanwhile, is the measure of a material's opposition to the movement of sound waves through that medium. It is typically given in units of pascal second per cubic meter. Impedance is directly affected by (and can be calculated with) the density of a material.
Sources/Further Reading: (Image Source—Hush City Soundproofing) (Wikipedia—Attenuation) (Wikipedia—Impedence) (Modern Physics) (Acoustiblok UK) (Engineer Your Sound) (Cambridge University) (ISU CNDE) (University of Wisconsin)
19 notes
·
View notes
Text
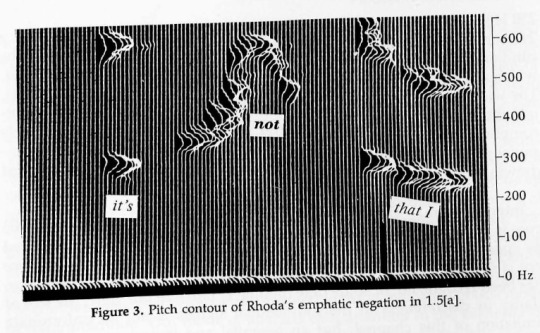
Pitch trace of the utterance "it's not that I", showing a peak on the negation not. A funky way of illustrating pitch? Pitch before Praat?
Labov, William & David Fanshel. 1977. Therapeutic discourse: psychotherapy as conversation. New York: Academic Press. [Figure 3, page 45]
A footnote explains the visualization this way: "Spectral Dynamics Real-Time Analyzer 301C with output displayed on a Tektronix 611 storage oscilloscope. The analyzer synthesizes 500 filters every 50 milliseconds over a variety of frequency ranges; the analysis can be terminated after any given number of filters and a new sweep started immediately. The pitch contour display used throughout this volume is made with a frequ ency range of 5,000 Hz. Each filter has a nominal bandwidth of 10 Hz and an effective bandwidth of 15 Hz. The sweep is terminated after the first 110 filters, so that a spectrum is generated every 11 milliseconds. The display on the oscilloscope is logarithmic and cuts off at 54 db below maximum. High-pass filtering at 12 db per octave begins at 3,000 Hz, and, in addition, the roll-off of the Nagra IV-S tape recorder - LS + FA - is used. Volume is then adjusted so that only the peaks of the wave forms are visible, thus tracing the path of the fundamental frequency without the interference of other signals"
#linguistics#phonetics#pitch#acoustics#William Labov#David Fanshel#1977#Therapeutic discourse#Academic Press
14 notes
·
View notes
Text

The Treasury of Atreus
16 notes
·
View notes
Text
NOAA Deep Sea Acoustics
My favourite bit of soundscape.
Most likely generated by a very large iceberg grounded in the Ross Sea by Antarctica in 1997. The haunting sound is generated as the iceberg is slowly moving and dragging its keel on the seafloor.
9 notes
·
View notes
