#time_series
Explore tagged Tumblr posts
Visit Tumblr Blog
Explore Tumblr blogs with no restrictions, modern design and the best experience.
Last Seen Tumblr Blogs


Fun Fact
Tumblr.com rank in the US is 25.
Text
Time series analysis

Time series analysis is a tool for the analysis of natural systems. For eg., climatic changes or fluctations in economy.In other words, you can predict the future. it can give you valuable insight of what happend during the course of the week, weeks, months or years.
What are the 4 components of time series? Trend component. Seasonal component. Cyclical component. Irregular component.
Check out our master program in Data Science and ASP.NET- Complete Beginner to Advanced course and boost your confidence and knowledge.
URL: www.edujournal.com
#trend#seasonal#cyclic#irregular#time_series#predict#machine_learning#insight#data_visualization#data_science#edujournal
0 notes
Link
LinDB is an open-source Time Series Database. If you want to know more about that, read this.
0 notes
Text
What are Time Series Changes MCQs 101 to 105
What are #Time_Series Changes MCQs 101 to 105
What are Time Series Changes MCQs 101 to 105 are here. You can practice these MCQs frequently to prepare your exams. Stay Connected for more. What are Time Series Changes MCQs What are Time Series Changes MCQs Exponential smoothing is a forecasting method which…It a time series changes at exact constant percentage then…The seasonal variation in the time series is computed by…The seasonal…

View On WordPress
0 notes
Text
Displaying Sensor Data in Node-RED Dashboard
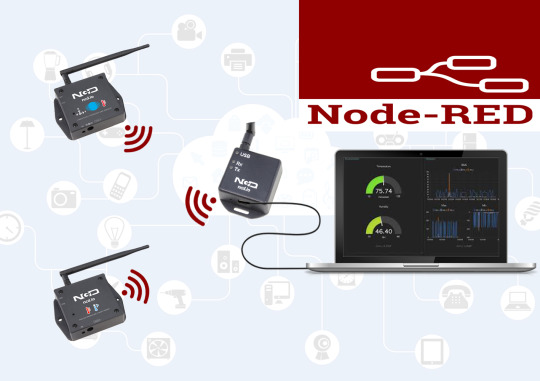
The manufacturing and production needs of 21’s century global trade are growing at an extraordinary pace, developing commercial demanding situations that rely upon sensors for absolution. The trifecta of 24-hour international manufacturing needs, reliable real-time asset tracking, and the high aid value required to manipulate assets in far off places have led to the emergence of the economic IoT and its adoption of wireless sensors. Sensors are necessary for harsh business settings; the key lies in choosing the precise sensor.
Hardware and Software Required
Hardware
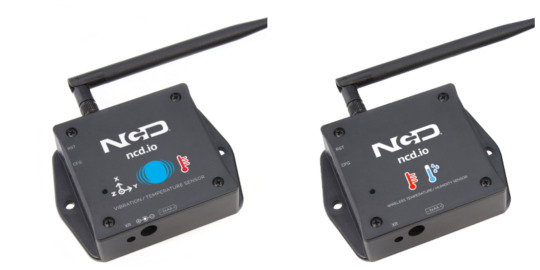
NCD Long-range Wireless Temperature and Humidity Sensor
NCD Long-Range Wireless Vibration and Temperature sensor
NCD 900HP-S3B Long-Range Wireless Mesh Modem with USB Interface
Software
Node-RED
Introducing NCD’s Long Range variety of commercial IoT wireless Temperature/Humidity and Vibration/Temperature sensor, boasting as much as a 2-mile range using a wireless mesh networking architecture. Incorporating a 16-bit Vibration/Temperature sensor and a Temperature/Humidity sensor, these sensor transmits pretty accurate vibration, temperature and humidity statistics at user-defined intervals.
These sensors can be powered with 2 AA batteries and can work up to 500, 000 wireless transmissions, a 10 years battery life may be expected relying on environmental situations and the data transmission intervals.
Optionally, these sensors can be externally powered, making it the best choice for wireless data tracking tool for the commercial equipment. Information can be transmitted to a PC, a raspberry pi, to Losant IoT cloud, Microsoft® azure® IoT, and an embedded machine all at the identical time.
To send these wireless sensors’ data to any system as we discussed above, we need a 900HP-S3B Wireless Modem.
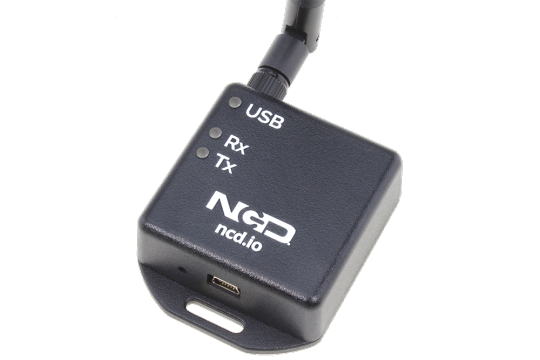
Plug the 900HP-S3B USB Mesh Modem into your computer and then install the required drivers. The 900HP-S3B modem will mount as a COM port on your PC.
In this tutorial, we are learning how to display these sensors data in Node-RED dashboard. So, first of all, we have to install Node-Red.
Installing Node-Red
Now you will be having your sensors in running mode, we need to use that data efficiently.
At first of all, you’ll have to install Node-RED.
Once it’s done, you need to start your command line or Power Shell for Windows users, and then navigate the same to the directory where “Node-RED” is installed.
Now type the command given below in your terminal.
npm i ncd-red-wireless node-red-dashboard
This will install the required nodes to receive data from your wireless sensors and you can start Node-RED once it’s done.
To start node server, you need to write node-red in the command prompt or terminal and then press enter.
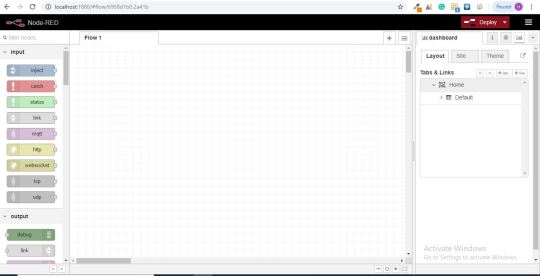
Assuming at this point you’ve started up Node-RED, you should be able to open a browser and navigate to http://localhost:1880, this will open the flow builder that is the heart of the Node-RED experience.
youtube
Steps to build the flow
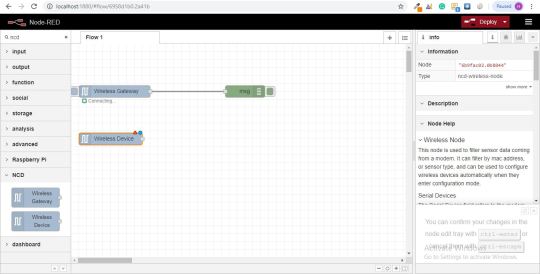
As you have started node-red, you'll be viewing a large blank flow with a list of nodes on the left side, which is known as the palette.
Now type ncd in the search bar of the palette, go ahead and drag a Wireless Gateway node over to your flow canvas to get started.
Finding your wireless Sensors
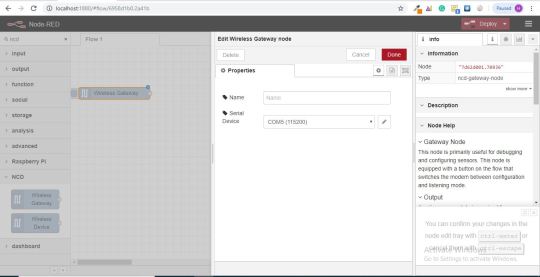
The next element we want to do is configure the node, when you first add it you’ll note that there is a small triangle at the top right corner, next to a blue dot, that triangle indicates that the node needs extra configuration, the blue dot indicates that the node has no longer but been deployed as part of the flow.
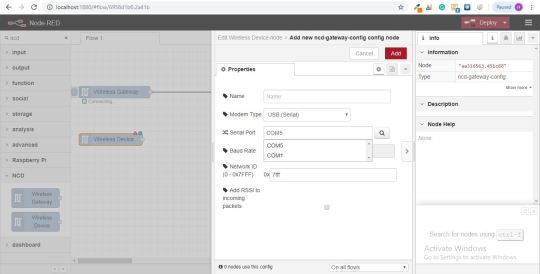
Double click on the node to open up the configuration options.
Click on the pencil icon next to the Serial Device field to configure your USB router, which will open the 2nd configuration panel that will be having a few options.
Click on the magnifying glass next to the Serial Port field and select the port that corresponds with your router, then click the “Add” button on top.
The serial device subject will now be populated based totally on that selection, and you may click “done”, you currently have direct access to your wireless sensors!
youtube
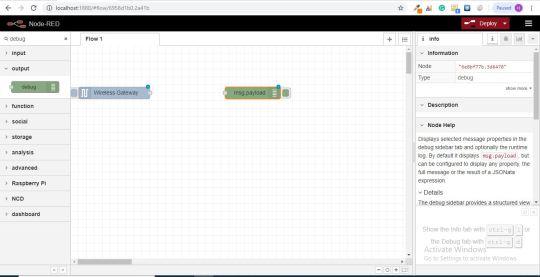
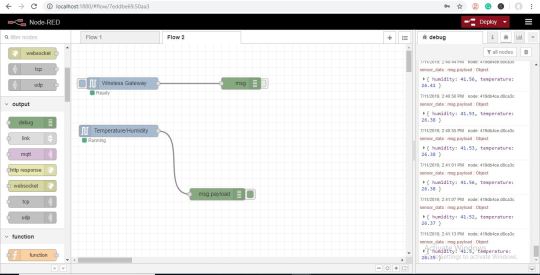
If you want to see the data that your wireless sensors are sending in, you can attach debug node to your wireless gateway.
Working with the data
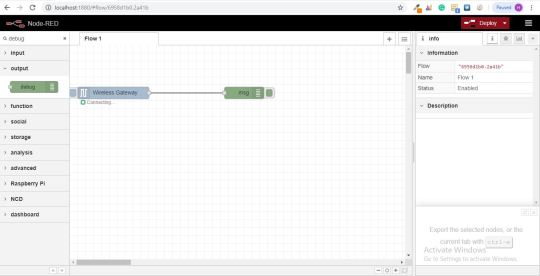
Now out of your wireless sensors, data is gathered and it will be the output of the “debug��� tab, this "debug tab" is placed on the right sidebar which will be subsequent to the information tab. To see the information is available to hit the reset button. In node-red, records will be passed among nodes in a JSON packet. When the msg object comes into the debug tab you may make bigger it to view the overall list of information that comes with it. This will be useful in case you need to check that which all sensors are being added in. The other issue this node gives is an easy way to interchange your router to the network identity that devices in configuration mode document on, simply hit the button on the left of the node and the tool will switch to the configuration network, hit it once more to return it to listening mode.

Adding the wireless sensors
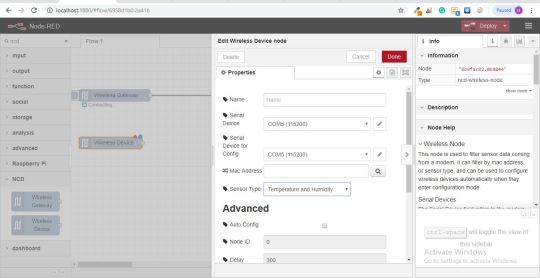
Grab a Wireless device Node from the palette and drag it onto the flow, double click on it to get it configured.
Click on the magnifying glass next to the Serial Port field and select the port that corresponds with your router, then click the “Add” button on top.
Click on the pencil icon next to the Serial Device and Serial Device for Config, now fields will now be populated based on that selection.
Select the Sensor as Temperature and Humidity or Vibration and click done.
youtube
You’ll notice this automatically sets the sensor type for you, you can also give it a name to make it easier to identify.
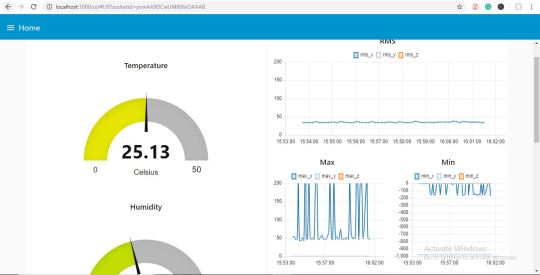
Node-RED Dashboard
Provides the ability to create a UI using the flow builder, provides charts, graphs, and a number of other visual elements we can use to display data, along with nodes to trigger a flow using user input. We will use some of these nodes to display the data from your wireless sensors.
Let’s check it out! There is a tab on the top right that says “Dashboard”.
On the top right of that tab is the little “new window” icon, click on it to view your UI.
youtube
Output
Node-RED Flow
[{"id":"2b202371.51803c","type":"ncd-wireless-node","z":"567e6d06.afbf84","name":"","connection":"e23241e4.e6b9d","config_comm":"b6b09e51.3f42","addr":"","sensor_type":"8","auto_config":"","node_id":0,"delay":300,"destination":"0000FFFF","power":4,"retries":10,"pan_id":"7FFF","change_enabled":"","change_pr":"0","change_interval":"0","cm_calibration":"60.6","bp_altitude":"0","bp_pressure":"0","bp_temp_prec":"0","bp_press_prec":"0","amgt_accel":"0","amgt_mag":"0","amgt_gyro":"0","impact_accel":"0","impact_data_rate":"4","impact_threshold":25,"impact_duration":1,"activ_interr_x":1,"activ_interr_y":2,"activ_interr_z":4,"activ_interr_op":8,"filtering":0,"data_rate":5,"time_series":0,"reading_type":1,"x":60,"y":480,"wires":[["f32912c4.8a4a7"]]},{"id":"e23241e4.e6b9d","type":"ncd-gateway-config","z":"","name":"","comm_type":"serial","ip_address":"","tcp_port":"2101","port":"COM6","baudRate":"115200","pan_id":"7fff","rssi":false},{"id":"b6b09e51.3f42","type":"ncd-gateway-config","z":"","name":"","comm_type":"serial","ip_address":"","tcp_port":"2101","port":"COM6","baudRate":"115200","pan_id":"7fff","rssi":false}]
0 notes
Text
@chainofflowers qui il JSON. Se chiami “PLEROMA” La tua data source, dovrebbe replicartela. { "annotations": { "list": [ { "builtIn": 1, "datasource": "-- Grafana --", "enable": true, "hide": true, "iconColor": "rgba(0, 211, 255, 1)", "name": "Annotations & Alerts", "type": "dashboard" } ] }, "editable": true, "gnetId": null, "graphTooltip": 0, "id": 1, "links": [], "panels": [ { "aliasColors": {}, "bars": true, "dashLength": 10, "dashes": false, "datasource": "PLEROMA", "fieldConfig": { "defaults": { "custom": {} }, "overrides": [] }, "fill": 1, "fillGradient": 0, "gridPos": { "h": 9, "w": 21, "x": 0, "y": 0 }, "hiddenSeries": false, "id": 2, "legend": { "alignAsTable": true, "avg": false, "current": false, "hideEmpty": false, "max": true, "min": true, "rightSide": true, "show": true, "sort": "total", "sortDesc": true, "total": true, "values": true }, "lines": false, "linewidth": 1, "nullPointMode": "null", "options": { "dataLinks": [] }, "percentage": false, "pointradius": 1, "points": false, "renderer": "flot", "seriesOverrides": [], "spaceLength": 10, "stack": false, "steppedLine": false, "targets": [ { "format": "time_series", "group": [ { "params": [ "15m", "none" ], "type": "time" }, { "params": [ "local" ], "type": "column" } ], "metricColumn": "actor", "rawQuery": false, "rawSql": "SELECT\n $__timeGroupAlias(inserted_at,15m),\n actor AS metric,\n count(id) AS \"id\"\nFROM activities\nWHERE\n $__timeFilter(inserted_at)\nGROUP BY 1, local,2\nORDER BY 1,2", "refId": "A", "select": [ [ { "params": [ "id" ], "type": "column" }, { "params": [ "count" ], "type": "aggregate" }, { "params": [ "id" ], "type": "alias" } ] ], "table": "activities", "timeColumn": "inserted_at", "timeColumnType": "timestamp", "where": [ { "name": "$__timeFilter", "params": [], "type": "macro" } ] } ], "thresholds": [], "timeFrom": null, "timeRegions": [], "timeShift": null, "title": "Activities per time", "tooltip": { "shared": false, "sort": 2, "value_type": "individual" }, "transparent": true, "type": "graph", "xaxis": { "buckets": null, "mode": "time", "name": null, "show": true, "values": [] }, "yaxes": [ { "format": "short", "label": null, "logBase": 1, "max": null, "min": null, "show": true }, { "format": "dateTimeAsUS", "label": null, "logBase": 1, "max": null, "min": null, "show": false } ], "yaxis": { "align": false, "alignLevel": null } } ], "refresh": false, "schemaVersion": 25, "style": "dark", "tags": [], "templating": { "list": [] }, "time": { "from": "2020-05-28T09:00:00.000Z", "to": "2020-05-28T21:00:00.000Z" }, "timepicker": {}, "timezone": "", "title": "Pleroma Activities per time", "uid": "LcZNd1zGk", "version": 1}
@chainofflowers qui il JSON. Se chiami “PLEROMA” La tua data source, dovrebbe replicartela. { “annotations”: { “list”: [ { “builtIn”: 1, “datasource”: “– Grafana –“, “enable”: true, “hide”: true, “iconColor”: “rgba(0, 211, 255, 1)”, “name”: “Annotations & Alerts”, “type”: “dashboard” } ] }, “editable”: true, “gnetId”: null, “graphTooltip”: 0, “id”: 1, “links”: [], “panels”: [ { “aliasColors”: {}, “bars”: true, “dashLength”: 10, “dashes”: false, “datasource”: “PLEROMA”, “fieldConfig”: { “defaults”: { “custom”: {} }, “overrides”: [] }, “fill”: 1, “fillGradient”: 0, “gridPos”: { “h”: 9, “w”: 21, “x”: 0, “y”: 0 }, “hiddenSeries”: false, “id”: 2, “legend”: { “alignAsTable”: true, “avg”: false, “current”: false, “hideEmpty”: false, “max”: true, “min”: true, “rightSide”: true, “show”: true, “sort”: “total”, “sortDesc”: true, “total”: true, “values”: true }, “lines”: false, “linewidth”: 1, “nullPointMode”: “null”, “options”: { “dataLinks”: [] }, “percentage”: false, “pointradius”: 1, “points”: false, “renderer”: “flot”, “seriesOverrides”: [], “spaceLength”: 10, “stack”: false, “steppedLine”: false, “targets”: [ { “format”: “time_series”, “group”: [ { “params”: [ “15m”, “none” ], “type”: “time” }, { “params”: [ “local” ], “type”: “column” } ], “metricColumn”: “actor”, “rawQuery”: false, “rawSql”: “SELECT\n $__timeGroupAlias(inserted_at,15m),\n actor AS metric,\n count(id) AS \”id\”\nFROM activities\nWHERE\n $__timeFilter(inserted_at)\nGROUP BY 1, local,2\nORDER BY 1,2”, “refId”: “A”, “select”: [ [ { “params”: [ “id” ], “type”: “column” }, { “params”: [ “count” ], “type”: “aggregate” }, { “params”: [ “id” ], “type”: “alias” } ] ], “table”: “activities”, “timeColumn”: “inserted_at”, “timeColumnType”: “timestamp”, “where”: [ { “name”: “$__timeFilter”, “params”: [], “type”: “macro” } ] } ], “thresholds”: [], “timeFrom”: null, “timeRegions”: [], “timeShift”: null, “title”: “Activities per time”, “tooltip”: { “shared”: false, “sort”: 2, “value_type”: “individual” }, “transparent”: true, “type”: “graph”, “xaxis”: { “buckets”: null, “mode”: “time”, “name”: null, “show”: true, “values”: [] }, “yaxes”: [ { “format”: “short”, “label”: null, “logBase”: 1, “max”: null, “min”: null, “show”: true }, { “format”: “dateTimeAsUS”, “label”: null, “logBase”: 1, “max”: null, “min”: null, “show”: false } ], “yaxis”: { “align”: false, “alignLevel”: null } } ], “refresh”: false, “schemaVersion”: 25, “style”: “dark”, “tags”: [], “templating”: { “list”: [] }, “time”: { “from”: “2020-05-28T09:00:00.000Z”, “to”: “2020-05-28T21:00:00.000Z” }, “timepicker”: {}, “timezone”: “”, “title”: “Pleroma Activities per time”, “uid”: “LcZNd1zGk”, “version”: 1}
@chainofflowers
qui il JSON. Se chiami “PLEROMA” La tua data source, dovrebbe replicartela.
{ "annotations": { "list": [ { "builtIn": 1, "datasource": "-- Grafana --", "enable": true, "hide": true, "iconColor": "rgba(0, 211, 255, 1)", "name": "Annotations & Alerts", "type": "dashboard" } ] }, "editable": true, "gnetId": null, "graphTooltip": 0, "id": 1, "links": [], "panels": [ { "aliasColors":…
View On WordPress
0 notes
Link
Posted by mbush91 via /r/artificial. Join Discussion: https://ift.tt/2SaUkFp. Curated by: www.eurekaking.com
0 notes

Link
Time series data present an additional layer of complexity. By nature, the value of each time series data point diminishes over time as the granularity of the data loses relevance as it gets stale. So it is crucial for teams to carefully plan data integration strategies into time series databases (TSDBs) to ensure that the analysis reflects the trends and situation in near real-time. In this article, we'll examine some of the most popular data integration solutions for TSDBs
0 notes
Text
Sending data of wireless Temperature and Humidity sensor to Excel
Things used in this project
IoT Long Range Wireless Temperature Humidity Sensor with power source Battery Or External DC.
Zigmo/Router for PC
PC/Laptop with an OS installed or Any IoT Embedded Device.
Story
Introducing NCD’s long-range wireless temperature humidity sensor, boasting up to a 28 Mile range using a wireless mesh networking architecture. Incorporating the Honeywell HIH9130 temperature humidity sensor transmits highly accurate temperature and humidity samples at user-defined intervals.
The on-board temperature sensor is rated for -25°C to 85°C or -13°F to 185°F and the humidity sensor is rated for 0 to 100% RH. It can be powered by just 2 AA batteries and an operational lifetime of 500, 000 wireless transmissions. Battery life can be extended up to 10 years depending on environmental conditions and the data transmission interval. Optionally, this sensor may be externally powered.
With an open communication protocol, this IoT wireless temperature humidity product can be integrated with just about any control system or gateway. Data can be transmitted to a PC, a Raspberry Pi, to Microsoft Azure® IoT, or Arduino. Sensor parameters and wireless transmission settings can be changed on the go using the open communication protocol providing maximum configurability depending on the intended application.
The long-range, price, accuracy, battery life and security features of Long Range Wireless Temperature Humidity Sensor make it an affordable choice which exceeds the requirements for most of the industrial as well as consumer market applications.
Setting up Node-RED
The sensor and Zigmo/Router come pre-programmed and work out of the box. In this section, we will set up a sensor and Zigmo link and start receiving data on our PC.
Steps to install Node-RED
Now that you have sensors running, we need a way to do something useful with that data.
First of all, you’ll have to install Node-RED.
Once that’s done, you’ll need to enter your command line, or Power Shell for Windows users, navigate to the directory Node-RED is installed in.
Now type “npm I ncd-red-wireless node-red-dashboard“. This will install the nodes required to receive data from your wireless sensors and you can start Node-RED once this is done.
To start node server write Node-RED in the command prompt or terminal and press enter.
Setting up the nodes
Assuming at this point you’ve started up Node-RED, you should be able to open a browser and navigate to http://localhost:1880, this will open up the flow builder that is the heart of the Node-RED experience.
Steps to build the flow
At this point you’ll be viewing a large blank flow with a long list of nodes on the left-hand side, this sidebar is called the palette.
Go ahead and drag a Wireless Gateway node over to your flow canvas to get started.
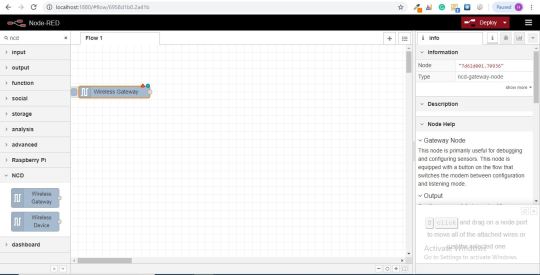
ncd-red-wireless Provides the nodes that manage the serial connection, parse incoming sensor data, filter it by specific parameters, and allow you to configure the wireless sensors.
Finding your wireless sensors
Once you’ve added the node you’ll be able to view the info tab, which contains information about the node’s functionality, this tab is well-populated for most Node-RED packages and contains valuable information, many times you will not need to view any other documentation outside of the info tab, so keep it in mind while you are building your flows if you have a question about how a node works. The next thing we need to do is configure the node, when you first add it you’ll notice that there is a small triangle on the top right corner next to a blue dot, the triangle indicates that the node needs additional configuration, the blue dot indicates that the node has not yet been deployed as part of the flow.
Double click on the node to open up the configuration options.
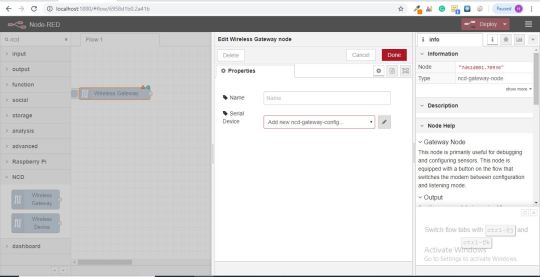
Click on the pencil icon next to the Serial Device field to configure your USB router, this will open a second configuration panel that only has a few options.
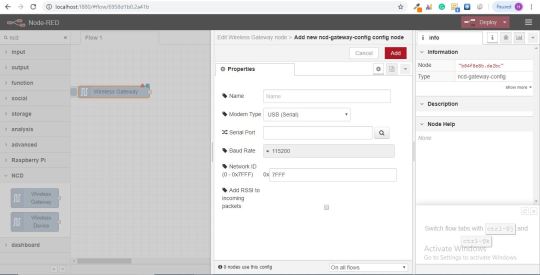
Click on the magnifying glass next to the Serial Port field and select the port that corresponds with your router, then click the “Add” button on top. The Serial Device field will now be populated based on that selection, and you can click “Done”, you now have direct access to your wireless sensors! To view the data coming in.
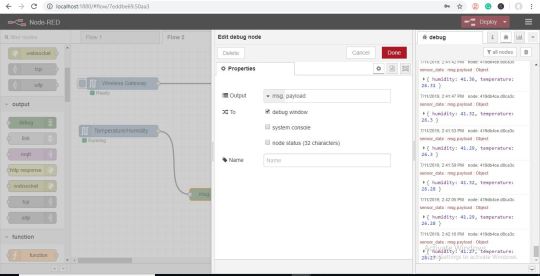
Now go back to your palette and type “debug” into the search field at the top, grab one of these nodes and drag it to the right of your Wireless Gateway.
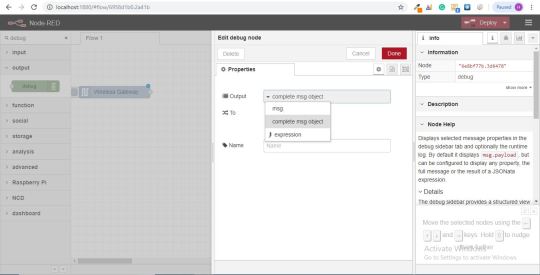
Double click on it and change “msg.” to “complete msg object” click done.
Now draw a line between the two nodes, and click “Deploy” on the top right of the window...
Working with the data
Now out of your wireless sensors data is gathered and it is output to the “debug” tab, this “debug tab” is placed within the right sidebar subsequent to the information tab. To see the information are available in to hit the reset button. In Node-RED records is surpassed among nodes in a JSON packet. When the msg object comes into the debug tab you may make bigger it to view the overall list of information that comes with it. This is extraordinarily useful in case you need to quickly see which sensors are checking in. The other issue this node gives is an easy way to interchange your router to the network identity that devices in configuration mode document on, simply hit the button on the left of the node and the tool will switch to the configuration network, hit it once more to return it to listening mode. Once we get the wi-fi tool nodes set up, they may be set to routinely configure a sensor whilst it enters configuration mode, so it’s always available to maintain such gateway nodes present at the flow for speedy configuring a device.

Adding the wireless sensors
we need to separate wireless sensor records domestically in order that we are able to display it, we could use a switch node to split out the messages from the gateway based totally on the mac address with or sensor type, but as I referred to, the wireless nodes truly incorporate extra functionality for configuring the sensors, so we’ll start with them to give you an extra entire image of how those structures can work. In case you haven’t already seen packets coming in from both of your sensors, cross in advance and hit the reset button on the only that hasn’t stated. While a sensor assessment in thru any serial device configuration node, the mac address and kind of sensor is cached in a pool so we are able to quickly find it for the duration of this next step.
Grab a Wireless Node from the palette and drag it onto the flow, double click on it to get it configured.
select the serial device from the drop-down that you used for the Wireless Gateway, now click the magnifying glass next to “Mac Address” and select one of the available options.
You’ll notice this automatically sets the sensor type for you, you can also give it a name to make it easier to identify. As noted in the info tab, the Serial Device for Config field is optional, and we won’t worry about it right now. The node you have just added effectively works as a filter on incoming sensor data, only passing through data for the mac address, or sensor type if no mac address is present.
Now go back to your palette and type “debug” into the search field at the top, grab one of these nodes and drag it to the right of your Wireless Gateway.
Double click on it and click done.
Adding Function Nodes
The function node is used to run JavaScript code against the msg object. The function node accepts a msg object as input and can return 0 or more message objects as output. This message object must have a payload property (msg.payload) and usually has other properties depending on the proceeding nodes.
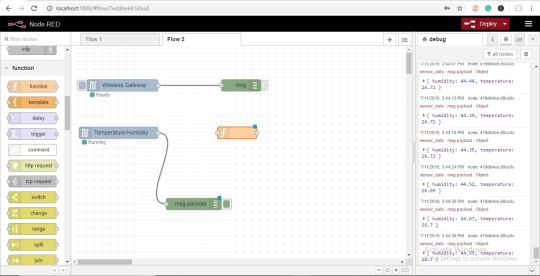
Now grab a “function” node from the palette, and place it to the right of the Temp/Hum node.
Double click on the node to open up the configuration options.
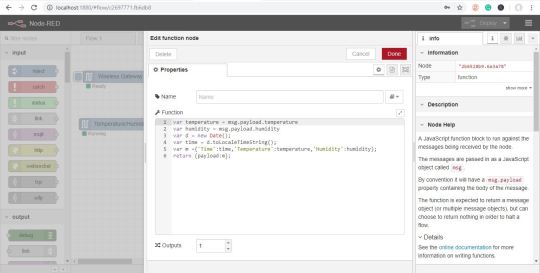
Here you have to write little javascript code to create a condition, so the temperature and humidity values will be written in the excel.
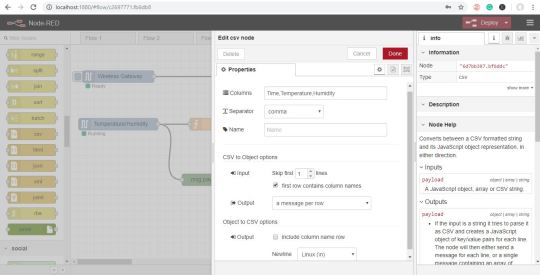
Now grab a CSV node from the palette and place it to the right of the function node, it will convert the values CSV format i.e comma-separated values.
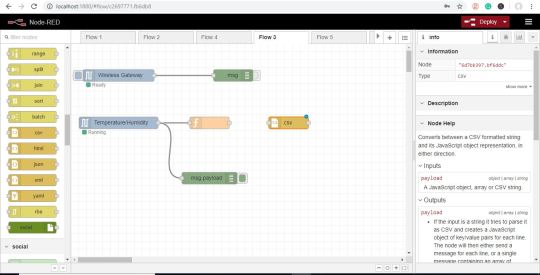
Now double click on it and type the column names separated by comma and output as “a message per row” as shown in the picture below.
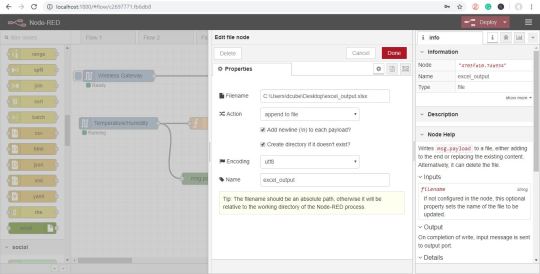
Now go back to your palette and type “file” into the search field at the top, grab the one which shows “Writes msg.payload” to store the values and place it right to the CSV node. You can also attach the debug node to check the out of the file node.

Double click on it to edit the file node, enter the file name where you want to store the values as shown in the figure.
Now connect all the wires and click on the deploy button.
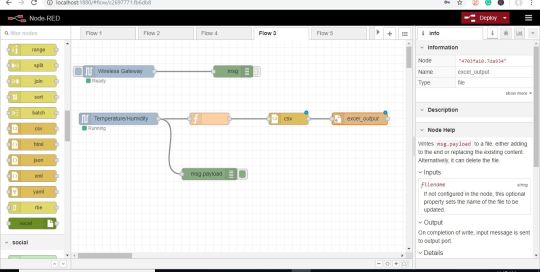

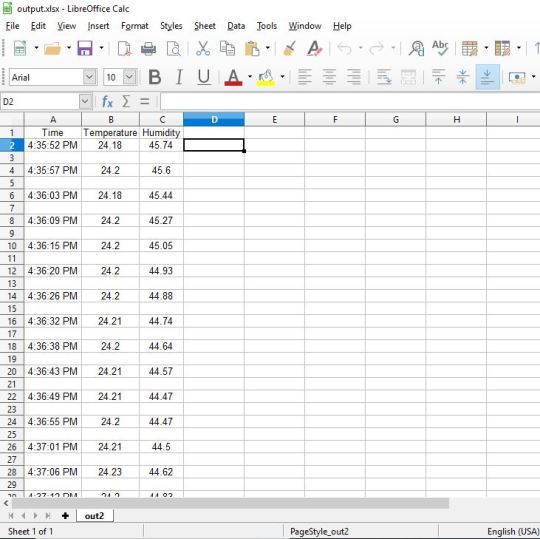
OUTPUT
Here you can check the excel output.
Node-red_flow_json
[{"id":"c2697771.fb6db8","type":"tab","label":"Flow 3","disabled":false,"info":""},{"id":"2ecc9d14.42a2a2","type":"ncd-gateway-node","z":"c2697771.fb6db8","name":"","connection":"7cc0565b.898ba8","x":120,"y":80,"wires":[["f0354fde.82ef1"]]},{"id":"f0354fde.82ef1","type":"debug","z":"c2697771.fb6db8","name":"","active":false,"tosidebar":true,"console":false,"tostatus":false,"complete":"true","targetType":"full","x":410,"y":80,"wires":[]},{"id":"176a6bea.9967a4","type":"ncd-wireless-node","z":"c2697771.fb6db8","name":"","connection":"3a63a78.66c7858","config_comm":"be3e53dd.346c8","addr":"","sensor_type":"1","auto_config":"","node_id":0,"delay":300,"destination":"0000FFFF","power":4,"retries":10,"pan_id":"7FFF","change_enabled":"","change_pr":"0","change_interval":"0","cm_calibration":"60.6","bp_altitude":"0","bp_pressure":"0","bp_temp_prec":"0","bp_press_prec":"0","amgt_accel":"0","amgt_mag":"0","amgt_gyro":"0","impact_accel":"0","impact_data_rate":"4","impact_threshold":25,"impact_duration":1,"activ_interr_x":1,"activ_interr_y":2,"activ_interr_z":4,"activ_interr_op":8,"filtering":0,"data_rate":5,"time_series":0,"reading_type":1,"x":120,"y":200,"wires":[["2b6528b9.6a3a78","390e7f7.e94e48"]]},{"id":"2b6528b9.6a3a78","type":"function","z":"c2697771.fb6db8","name":"","func":"var temperature = msg.payload.temperature\nvar humidity = msg.payload.humidity\nvar d = new Date();\nvar time = d.toLocaleTimeString();\nvar m ={'Time':time,'Temperature':temperature,'Humidity':humidity};\nreturn {payload:m};","outputs":1,"noerr":0,"x":350,"y":200,"wires":[["6d7bb397.bf6ddc"]]},{"id":"390e7f7.e94e48","type":"debug","z":"c2697771.fb6db8","name":"","active":true,"tosidebar":true,"console":false,"tostatus":false,"complete":"payload","targetType":"msg","x":350,"y":340,"wires":[]},{"id":"6d7bb397.bf6ddc","type":"csv","z":"c2697771.fb6db8","name":"","sep":",","hdrin":true,"hdrout":"","multi":"one","ret":"\\n","temp":"Time,Temperature,Humidity","skip":"1","x":550,"y":200,"wires":[["4703fa10.7da934"]]},{"id":"4703fa10.7da934","type":"file","z":"c2697771.fb6db8","name":"excel_output","filename":"C:\\Users\\dcube\\Desktop\\excel_output.xlsx","appendNewline":true,"createDir":true,"overwriteFile":"false","encoding":"utf8","x":730,"y":200,"wires":[[]]},{"id":"7cc0565b.898ba8","type":"ncd-gateway-config","z":"","name":"","comm_type":"serial","ip_address":"","tcp_port":"2101","port":"COM6","baudRate":"115200","pan_id":"7fff","rssi":false},{"id":"3a63a78.66c7858","type":"ncd-gateway-config","z":"","name":"","comm_type":"serial","ip_address":"","tcp_port":"2101","port":"COM6","baudRate":"115200","pan_id":"7fff","rssi":false},{"id":"be3e53dd.346c8","type":"ncd-gateway-config","z":"","name":"","comm_type":"serial","ip_address":"","tcp_port":"2101","port":"COM6","baudRate":"115200","pan_id":"7fff","rssi":false}]
Also, there is another way to send the data to excel by using “JSON” node and “excel” node.
First of all, close the terminal or command prompt if you were doing with the above method.
Then you have to install excel node to store the data.
So you’ll need to enter your command line, or Power Shell for Windows users, navigate to the directory Node-RED is installed in.
Now type “npm install node-red-contrib-excel“. This will install the “excel” node required to store data from your wireless sensors and you can start Node-RED once this is done.
To start node server write node-red in the command prompt or terminal and press enter.
Now open a browser and navigate to http://localhost:1880 to open the flow builder.
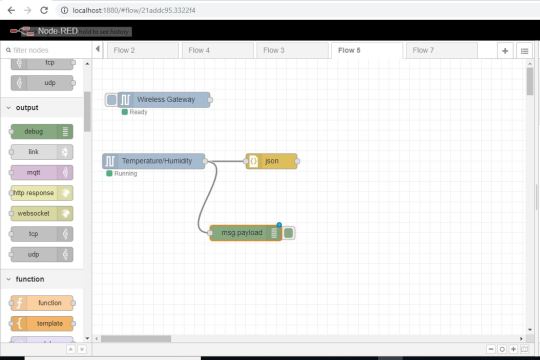
Now the steps are the same up to adding the wireless sensor.
To build the flow same as shown above up to adding the wireless sensor.
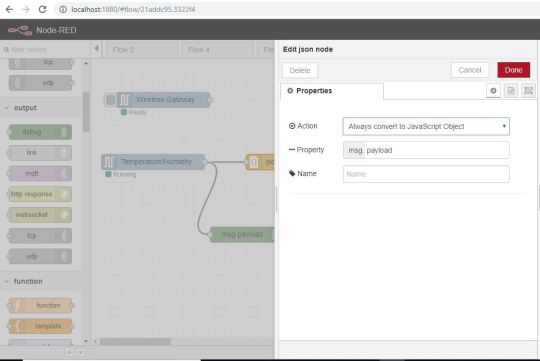
Then grab the JSON node from the palette and place it right to the Temperature/Humidity node.
Double click on it edit JSON node, edit it as shown in the picture below and click done.
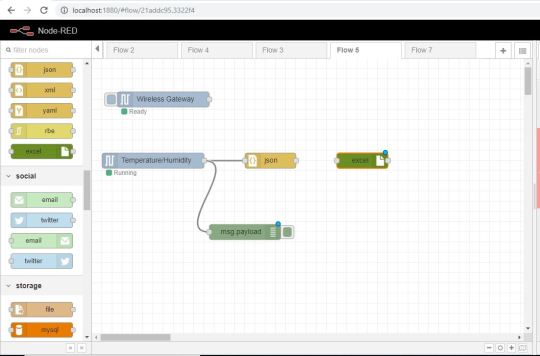
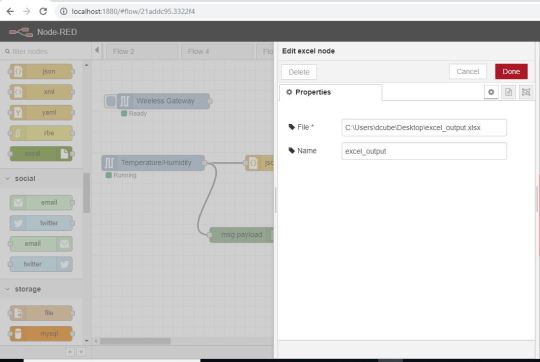
Now grab the “excel” node that you have installed from the palette and place it to the right of “JSON” node.
Double click on it to enter the file name where you want to store the temp/hum data and click done.
Now connect all the wires and hit the “deploy” button.
OUTPUT
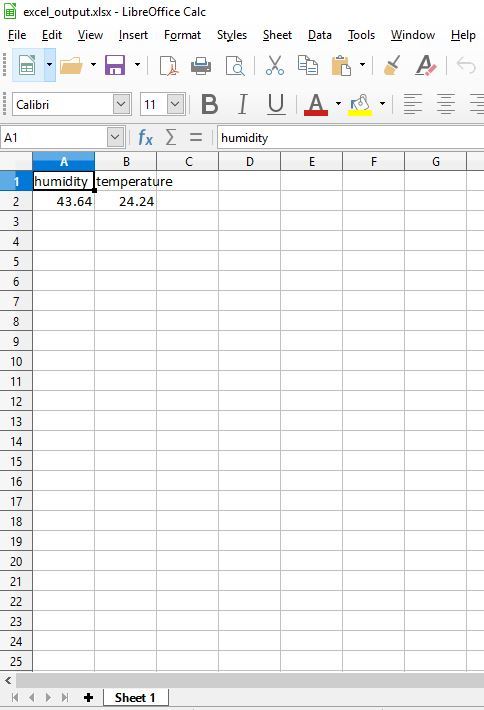
But the limitation with excel node is that it overwrites the data in a single row.
Node-red Flow Excel node
[{"id":"21addc95.3322f4","type":"tab","label":"Flow 5","disabled":false,"info":""},{"id":"df396104.3078b","type":"ncd-gateway-node","z":"21addc95.3322f4","name":"","connection":"b2933c2.fec5dc","x":140,"y":80,"wires":[[]]},{"id":"b938e310.ba4ef","type":"ncd-wireless-node","z":"21addc95.3322f4","name":"","connection":"220af376.1c24cc","config_comm":"fb46f24e.c4341","addr":"","sensor_type":"1","auto_config":"","node_id":0,"delay":300,"destination":"0000FFFF","power":4,"retries":10,"pan_id":"7FFF","change_enabled":"","change_pr":"0","change_interval":"0","cm_calibration":"60.6","bp_altitude":"0","bp_pressure":"0","bp_temp_prec":"0","bp_press_prec":"0","amgt_accel":"0","amgt_mag":"0","amgt_gyro":"0","impact_accel":"0","impact_data_rate":"4","impact_threshold":25,"impact_duration":1,"activ_interr_x":1,"activ_interr_y":2,"activ_interr_z":4,"activ_interr_op":8,"filtering":0,"data_rate":5,"time_series":0,"reading_type":1,"x":120,"y":200,"wires":[["169f12eb.2edaad","47ed6c99.4d9f54"]]},{"id":"169f12eb.2edaad","type":"json","z":"21addc95.3322f4","name":"","property":"payload","action":"obj","pretty":false,"x":350,"y":200,"wires":[["d98f712.f8b199"]]},{"id":"47ed6c99.4d9f54","type":"debug","z":"21addc95.3322f4","name":"","active":true,"tosidebar":true,"console":false,"tostatus":false,"complete":"payload","targetType":"msg","x":300,"y":340,"wires":[]},{"id":"d98f712.f8b199","type":"excel","z":"21addc95.3322f4","name":"excel_output","file":"C:\\Users\\dcube\\Desktop\\excel_output.xlsx","x":550,"y":200,"wires":[[]]},{"id":"b2933c2.fec5dc","type":"ncd-gateway-config","z":"","name":"","comm_type":"serial","ip_address":"","tcp_port":"2101","port":"COM6","baudRate":"115200","pan_id":"7fff","rssi":false},{"id":"220af376.1c24cc","type":"ncd-gateway-config","z":"","name":"","comm_type":"serial","ip_address":"","tcp_port":"2101","port":"COM6","baudRate":"115200","pan_id":"7fff","rssi":false},{"id":"fb46f24e.c4341","type":"ncd-gateway-config","z":"","name":"","comm_type":"serial","ip_address":"","tcp_port":"2101","port":"COM6","baudRate":"115200","pan_id":"7fff","rssi":false}]
0 notes