#dashboards
Explore tagged Tumblr posts
Visit Tumblr Blog
Explore Tumblr blogs with no restrictions, modern design and the best experience.
Last Seen Tumblr Blogs


Fun Fact
There are dozens of funny blogs to kill time on Tumblr.
Text
we need more yuri on our dashboards
13 notes
·
View notes
Note
Tumblr keeps removing you from my following list, just thought I'd share the glitch find.
Oh that’s just an old crazy lady hacker named Gladys, she’s been plaguing me with crazy glitches since 2014
#pix answers#she has removed me from friend group chats#following lists#dashboards#and the algorithm altogether#but it’s aight she just needs a healthier hobby#I’d say this is a joke but if you know you know 😔#totally unrelated I have not slept but trust me I have friends who can vouch for me 😭 she’s out there she’s not just a sleepparalysis glitch#wait I forgot if she had a tag#Gladys
18 notes
·
View notes
Text

You still been using outdated design tools to create dashboard mockups? 🥴 OOF. Issokay We've all been there.
Now create hi-fi dashboard wireframes with Mokkup.ai in under 30 mins. Share, comment, export and present your designs to the world! 🌎
#data analytics#dashboard#data#powerbi#tableau#visualization#dashboards#dashboard simulator#datascience#free#freetools
2 notes
·
View notes
Text

Looking for some feedback!
I'm working on The Podfic RePawsitory, and tinkering with the dashboard on mobile.
If you were going to use a Podfic website, what would you want in a dashboard? Please comment if you have design tips or ideas!
I've got bookmarks, an update feed for subbed authors and fandoms, and notification icons that will hook to various elements.
What else? I'd love some input.
---
I really like the header ("Hello, Guest!), but the rest of it just isn't right. I'm thinking of moving the notification icons to the header, that'll help. Expanding the "Recent Updates" to be full width within formatting.
Definitely want to keep it within 1 viewport height, and aligned in drawer style, ie, off the page until you drag the tab. Possibly as a lightbox or modal window.
#wix#responsive web design#website#website design#coding#programming#headers#dashboards#html css#javascript#html#css
3 notes
·
View notes
Text
Navigating Real-Time Operations: The Power of Operational Dashboards
Operational dashboards are dynamic visual interfaces that provide real-time insights into an organization's day-to-day activities and performance. These dashboards are particularly valuable for monitoring short-term operations at lower managerial levels, and they find application across various departments. They stand as the most prevalent tools in the realm of business intelligence.
Typically, operational dashboards are characterized by their comprehensive nature, offering junior managers detailed information necessary to respond to market dynamics promptly. They also serve to alert upper management about emerging trends or issues before they escalate. These dashboards primarily cater to the needs of managers and supervisors, enabling them to oversee ongoing activities and make rapid decisions based on the presented information. Operational dashboards often employ graphical representations like graphs, charts, and tables and can be customized to display information pertinent to the specific user.
Examples of data typically showcased on an operational dashboard include:
Sales figures
Production metrics
Inventory levels
Service levels
Employee performance metrics
Machine or equipment performance data
Customer service metrics
Website or social media analytics
It is crucial to emphasize that operational dashboards are distinct from other dashboard types, such as strategic and analytical dashboards. These different dashboards serve varied purposes and audiences and contain dissimilar datasets and metrics. Here are a couple of examples.
Below, you can see a Revenue overview dashboard for QuickBooks. It provides month-by-month overviews of invoices, products, customers, profit and loss. Such a dashboard can be used on a daily basis and help monitor and manage operating activities.
This data visualization is connected to a data automation solution, Coupler.io. It automatically transfers fresh data from QuickBooks to the dashboard, making it auto-updating. Such a live dashboard can be an important instrument for enabling informed decision-making.
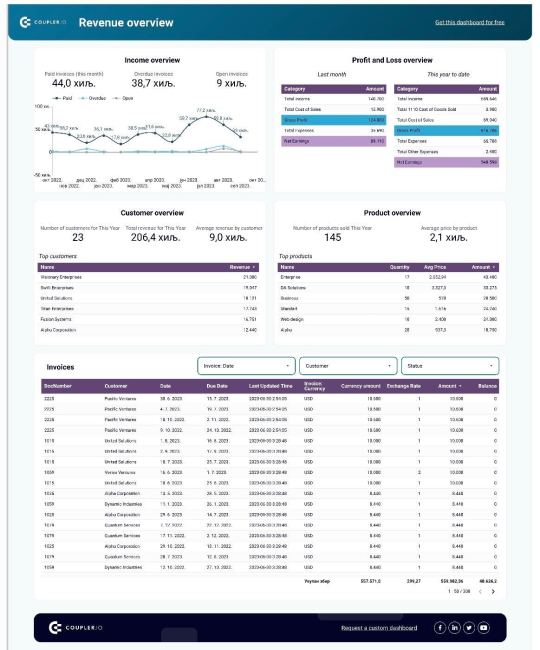
This Revenue overview dashboard is available as a free template. Open it and check the Readme tab to see how to use it.
Here’s another example of an operational dashboard, the Facebook Ads dashboard. It allows ad managers to closely track their ad performance. This dashboard is also powered by Coupler.io, so it depicts ad data in near real-time. This allows marketers to quickly define what works and what doesn’t and make adjustments on the go.
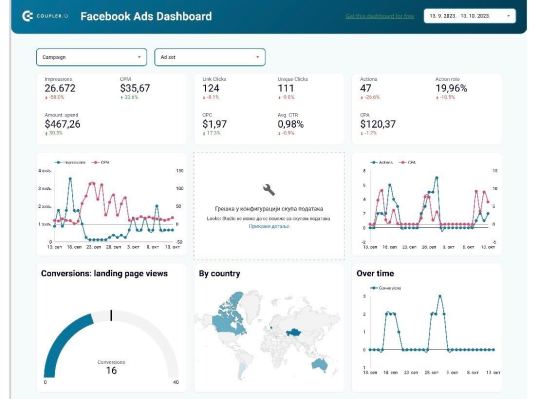
Facebook Ads dashboard is available as a free template. You can grab it and quickly get a copy of this dashboard with your data. In conclusion, operational dashboards are indispensable tools for organizations seeking to thrive in a dynamic business landscape. These real-time visual displays offer invaluable insights into day-to-day operations, equipping managers and supervisors with the information to make swift, informed decisions. As the most widely used business intelligence instruments, operational dashboards empower businesses to adapt to market changes, identify emerging trends, and maintain a competitive edge. Their versatility and capacity to monitor a wide range of metrics make them an essential asset for managing the intricacies of modern operations.
#marketing dashboards#digital marketing#dashboards#data analytics#data visualization#operational dashboards
2 notes
·
View notes
Text
You all disappoint me. Not one (1) drawing of a personified tumblr mourning the lifeless corpse of 4chan? Not ome? They were our rivals you sick fucks. Nary a whiff of 1 (one) fix-it AU? Im going to hibernate now..youve pirssed me off
#4chan#liusten. listen tho.#once upon a time this would have been like a 3+day dashboard event. maybe up to a week if people really caught on#itd be a real fucking pain for anyone genuinely uninterested to be on tumblr!#we cant ALL be shambling corpses now
18K notes
·
View notes
Text
Your Dashboard is Slower Than It Should Be – Here’s How to Fix It!
We've all been there. You log into your dashboard, expecting instant insights, but instead, you're greeted with a painfully slow loading screen. Your frustration grows, and by the time your data finally loads, you’ve lost valuable minutes—or worse, your patience.

A slow dashboard isn’t just an inconvenience; it’s a business killer. It frustrates users, delays critical decision-making, and can even impact revenue. But don’t worry! Whether you're a dashboard developer, business owner, or product manager, I’ve got you covered. Let’s break down why your dashboard is slow and, more importantly, how to fix it.
1. Understanding Why Your Dashboard is Slow
Before we dive into solutions, let's diagnose the common performance bottlenecks:
Heavy Queries & Database Overload
If your dashboard relies on a database to fetch real-time information, poorly optimized queries can cause significant slowdowns. Think about it like a crowded coffee shop: if every customer orders a highly customized drink (complex query), the barista (database) gets overwhelmed.
Inefficient Data Fetching
Fetching too much data at once or making too many API calls leads to sluggish performance. Imagine trying to carry 15 grocery bags in one trip—it’s just not efficient.
Front-End Rendering Issues
Even if your backend is lightning-fast, a poorly optimized front-end can slow everything down. Unnecessary re-renders, unoptimized JavaScript, or rendering massive amounts of data all contribute to sluggish performance.
Lack of Caching
If your dashboard fetches the same data repeatedly without caching, it’s like checking your fridge every five minutes to see if food magically appeared. Instead, cache frequently used data to improve speed.
Poor Data Structure
If your data isn’t indexed properly, finding what you need can be like searching for a needle in a haystack.
2. Diagnosing Dashboard Performance Issues
Before we start fixing things, let's find the root cause. Here are some tools and techniques to help:
Google Lighthouse & PageSpeed Insights
Use these tools to check your front-end performance. They pinpoint render-blocking scripts, slow-loading assets, and other issues.
Database Query Profilers
If your dashboard pulls data from a database, tools like MySQL EXPLAIN or PostgreSQL EXPLAIN ANALYZE can help identify slow queries.
Chrome DevTools & Network Analysis
Monitor API response times, find unnecessary requests, and optimize network traffic.
Server Logs & Load Testing
Check backend performance by analyzing server logs and running load tests to see how well your system handles heavy traffic.
3. Optimizing Backend Performance
Efficient Query Design & Data Management
Use Indexed Databases: Indexing speeds up searches significantly. Think of it as a well-organized library versus one with books scattered everywhere.
Optimize SQL Queries: Avoid using SELECT * when you only need specific fields.
Implement Pagination: Load data in chunks rather than all at once to improve responsiveness.
Normalize vs. Denormalize Data: Balance between reducing redundancy (normalization) and speeding up queries (denormalization).
Caching Strategies for Speed Boost
Redis or Memcached: Store frequently accessed data to reduce database queries.
Edge & Browser Caching: Cache static content so it doesn’t reload unnecessarily.
Pre-aggregated Data Storage: If your dashboard requires heavy calculations, consider storing pre-computed results.
4. Optimizing API Calls & Data Fetching
Reduce the Number of API Calls
Instead of making multiple small API requests, batch them to reduce network load.
Use WebSockets for Real-Time Data
Polling APIs every few seconds? Switch to WebSockets for faster real-time updates with less load on the server.
Optimize API Response Payloads
Only send the data you need. A bloated API response slows down everything.
Leverage GraphQL
Unlike REST APIs that return fixed responses, GraphQL lets you request only the fields you need, improving efficiency.
5. Front-End Optimization for Faster Dashboards
Minify & Bundle JavaScript and CSS
Large scripts can slow down dashboard loading times. Minify and bundle them to improve performance.
Lazy Loading & Async Loading
Only load content when needed. For example, don’t load a chart until the user scrolls to it.
Optimize Component Rendering
If you’re using React, Vue, or Angular, avoid unnecessary re-renders by using memorization and state management best practices.
Use Virtualization for Large Data Tables
Rendering thousands of rows at once is a bad idea. Instead, use virtualization techniques like React Virtualized to load only what the user sees.
Choose the Right Visualization Library
Not all charting libraries are created equal. Use lightweight options like Chart.js instead of more complex libraries if you don’t need advanced features.
6. Preventing Future Slowdowns
Regular Performance Audits & Load Testing
Schedule periodic performance reviews to catch slowdowns before users complain.
Monitor API Latency & Server Response Times
Use tools like New Relic, DataDog, or Prometheus to keep an eye on your backend.
Set Up Automated Alerts for Performance Drops
Be proactive—set up alerts for when response times exceed a certain threshold.
Keep Your Tech Stack Updated
Old versions of frameworks and libraries can be less efficient. Regularly update your stack for performance improvements.
Conclusion
Slow dashboards are frustrating, but the good news is they’re fixable. By diagnosing performance bottlenecks, optimizing your backend and front-end, and implementing long-term monitoring, you can create a dashboard development services that loads in seconds, not minutes.
Take action today—start with a performance audit and apply at least one of these improvements. Your users (and your business) will thank you!
0 notes
Text
Human Factors: Decision making in the real world

It’s not enough for one person to know what happened yesterday—teams need to spot long-term trends to predict anomalies. Data is streaming, so static analysis doesn’t cut it. Unparsed data dumps don’t help. Being able to visualize data through dashboards or graphs helps to make sense of patterns. It is not about becoming data scientists. You do not need a degree in mechanics to drive a car. Your driving instructor tells you in simple terms how an engine works, where the oil goes, how to turn the steering wheel and which pedal to press.
Data should not be siloed. Maintenance, logistics, management, production teams — everyone needs to know some basics to make cohesive decisions. Cross-functional training is a key element to a deployment. There is a natural reluctance to embrace new things. Knowledge empowers and concurrently dispels fear of change. In hierarchical organizations there can be an aversion to the wider distribution of real-time information outside the management cadre. Inertia comes bottom up or top down, usually it is both at the same time.
#Change Management#Charts#Dashboards#Data#Data Modelling#Education#Ergonomics#Information Flow#Learning#Statistics#Tools#Training#visualization#Visuals
0 notes
Text
Stuffed Animal dashboard simulator

🐻feltedfur Follow
pray for me human put me in the wash on fucking hot water im never gonna be the same colors
23 notes
🐇velveteen-everything Follow
got left outside in the backyard but this is kinda nice actually im okay with this (:
🐇velveteen-everything Follow
the hawks
14.1k notes
🐉shinyscales Follow
this is bullshit ive been bragging to everyone in the toy chest because my tag says i was made with love but i got torn today and guess what. its just stuffing inside
🥽pooltoy82 Follow
lol imagine having stuff inside you lmao
🐉shinyscales Follow
i literally see you outside the window looking smug. log off
4 notes
🦭 sealofapproval Follow
FELL OFF THE BED HELP HELP HELP HELP
🐭 m4m4_p0ssum Follow
WHY ARE YOU POSTING ON PLUSHBLR INSTEAD OF KEEPING WATCH FOR MONSTERS THATS YOUR HUMANS ROOM
990 notes
🐭 plushiepolls Follow
🐉shinyscales Follow
lets not spread body dysmorphia on plushblr guys
🧑 thatoneweirdhumanplushie Follow
op casually ignoring stuffed animals with different colored fabric for eyes
▶️ stuffedyoutooz Follow
some of us dont even have eyes!
13k notes
🐶 newdogtoy22 Follow
i know animals are allowed to see normal plushies moving and talking but whats the rule for dog toys.
▶️ stuffedyoutooz Follow
what breed of dog op
🐶 newdogtoy22 Follow
poodle? does it matter?
▶️ stuffedyoutooz Follow
no i just wanted to remind you your lifespan can be measured in days
🐶 newdogtoy22 Follow
man come on
20 notes
36K notes
·
View notes
Text
Whether you're tracking sales performance, customer service metrics, or marketing campaigns, the right dashboards can make all the difference. Discover actionable insights with these 5 powerful Salesforce dashboard examples: Click the link to elevate your data visualization game!
1 note
·
View note

Text
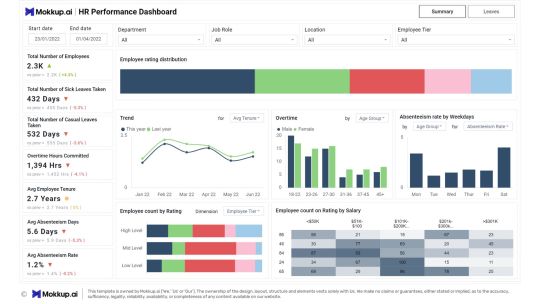
HR Performance dashboard done in under 30 mins on Mokkup.ai.
#dashboard simulator#dashboard#dashboards#data#visualization#datascience#data analytics#powerbi#tableau#hr#recruitment
1 note
·
View note
Text
Temperate Lake Dashboard Simulator

🐦⬛2xcrested_cormorant Follow Going to try and eat this weird fish

♻️🐦⬛2xcrested_cormorant Follow wilmdlife hopital
🐸rana-bufo Follow No one can ever truly understand what BULL4rog's music means to me 😭 this song in particular argrgrgrgrgrg the way he puffs out his vocal sack asdfghjk

BULL4rog: listen here on spotify ♻️🐸rana-bufo Follow I think I huave chytrid
🐟ilikeeatingminnowsFollow I just migrated here from finstagram please be nice

🐠powerbottomfeeder Follow
I have HAD IT with this lake, it’s the third day in a row we’ve had nitrates above 8 ppm and uug the algae, my allergies I can’t do this
♻️🐟carpy-diem Follow
Lol we regularly get nitrates up to 20 ppm in my lake ♻️🦞crawdaddy Follow uhhh you shouldn't be bragging about that, it's really unsafe ♻️🐟carpy-diem Follow suck it you little oligotrophic bitch
🐢snappturt Follow Dear Tumblr, am I the Basshole for the way I catch minnows? I was chatting with some of the guys I bask with and they said the way I catch minnows is problematic; What I do is I sit on the bottom of the lake, I hide myself in the mud and I open my mouth. My tongue looks a lot like a little worm so I wiggle it around- and because of that, minnows swim over and check it out. Once they get close enough, then I bite down and eat them. Some of my rockmates have told me that this is manipulative and toxic behavior- but they also eat minnows...I don't know guys...
🦆tree hole-nester-acorn-eater Follow
is it just me, or is this super homoerotic???

🐟bigpikexxl Follow liveblogging diving down to the bottom
♻️🐟bigpikexxl Follow dark
♻️🐟bigpikexxl Follow big log
♻️🐟bigpikexxl Follow rock
♻️🐟bigpikexxl Follow kinda cold
♻️🐟bigpikexxl Follow oh hi @deepwatersculpin!!!

♻️🐠deepwatersculpin Follow oh hey @bigpikexxl!!!

never thought i'd seen one of my mutuals irl!!! I didn't even know we lived in the same lake!!!
🐠Shadlad Follow I'm not sorry, and I'm not afraid to say it, if you're an introduced species, go dry yourself out. You're not welcome to eat up all of our resources and live in my ancestral longs and rock crags. These things are for us to relate to and not for you to squander.
♻️🦞crevice-steve Follow
Can't believe this type of fishcourse is still popular on this site, introduced species didn't choose to be introduced and have as much of a right to live as anyone else. Bigotry against introduced species is still bigotry and that's a hill I will dry on. ♻️🐠Shadlad Follow Go ahead, dry yourself out then ;) ♻️🪷nootnootnewt Follow Hey man, I hate invasive species as much as anyone else but please stop telling people to beach themselves for political reasons- yeah that includes inavsives too ♻️🦐typical_scud Follow Did you legit just use the word Invas*ve to describe introduced species? ♻️🦢flatfootswimmer Follow anyone in this thread eat pondweed?
♻️🐟largemouthbASS Follow A colab with my mutual @2xcrested_cormorant after they got released from the wildlife hospital. They haven't been on much since the Fish and Wildlife Service released them in the wrong lake and it took them a while to get back to their colony. We hope this guide will help you avoid accidentally eating/engaging with bait!

#fishblr#fishposting#fake post#dashboard simulator#cw thalassophobia#thalassophobia#ecology#freshwater ecology#wood duck#walleye
24K notes
·
View notes