#autofluorescence
Explore tagged Tumblr posts
Visit Tumblr Blog
Explore Tumblr blogs with no restrictions, modern design and the best experience.
Last Seen Tumblr Blogs


Fun Fact
Mobile US users spent an average of 115.8 minutes on Tumblr app monthly.
Text

A fluorescent ant by Dr. Jan Michels.
58 notes
·
View notes
Text

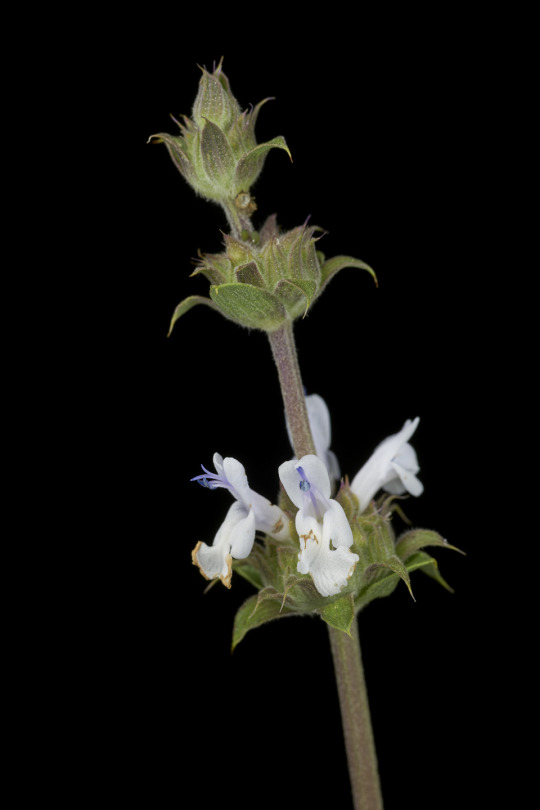
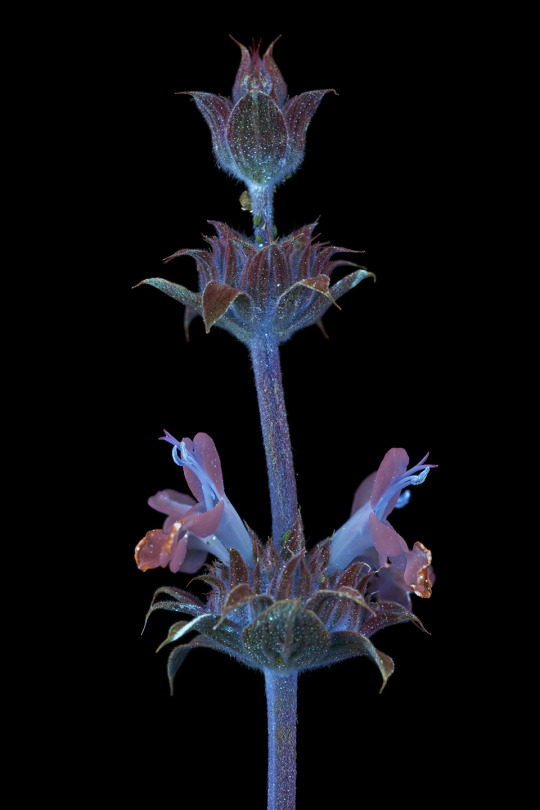
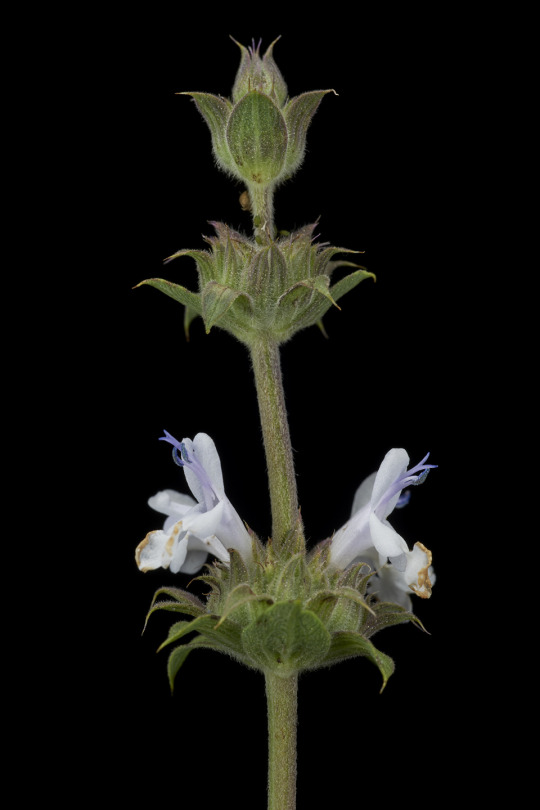

Salvia mellifera, black sage, is a perennial shrub in the mint/sage family native from central California down through the top of Baja California. It is part of the cast of plants present in coastal sage and chaparral habitat, thriving only in a specific range of rainfall in a mediterranean climate. The flowers host a variety of pollinators including butterflies, hummingbirds, and native bees and its seeds, like other Salvia species, are abundant and provide food for animals and birds. The fragrant leaves contain chemicals used by the Chumash to treat pain and a unique spicy honey is derived from the plant in the modern day.
138 notes
·
View notes
Text

Plant root growth under microscope
#cells#biology#photography#explore#nature#science#adorable#plants#education#lol#plant#amazing#awesome#funny#roots#microscope#fluorescence#lightsheet#tissue#growth#autofluorescence
24 notes
·
View notes
Text
Applications in Light-induced Spectroscopy with violet LED lamp: Autofluorescence by Etcheverry in Journal of Clinical Case Reports Medical Images and Health Sciences.
Abstract
Introduction Materials and methods LED lamp construction and its photometric/radiometric characterization Results and discussion Converging lens design: a) Schematic drawing from lens data sheet; b) drawing the profile using the Blender 2.76 program; c) Application of spin tool to obtain the solid of revolution of the profile drawn in b); d) simulated lens with better definition than c), which was exported to Zemax; e) system of lens-LED in Zemax, and analysis of the emission on a detector surface located at 20 cm of the LED; f) photograph of the real lens. number of incident rays (n), wavelength, source-surface distance, and power, were specified. A scheme of the design process can be seen in Fig.3.Blender 2.76 program; c) Application of spin tool to obtain the solid of revolution of the profile drawn in b); d) simulated lens with better definition than c), which was exported to Zemax; e) system of lens-LED in Zemax, and analysis of the emission on a detector surface located at 20 cm of the LED; f) photograph of the real lens. Application of spin tool to obtain the solid of revolution of the profile drawn in b); d) simulated lens with better definition than c), which was exported to Zemax; e) system of lens-LED in Zemax, and analysis of the emission on a detector surface located at 20 cm of the LED; f) photograph of the real lens.
The main objective of the present study was to develop a violet LED light source suitable for medical application devoted to the diagnostic and treatment of non-melanoma skin cancers. For this propose, we constructed a 12 W violet LED lamp (with maximum emission peak at 405 nm) made up of four mobile 3 W LED. The LED lamp was characterized employing a spectrometer coupled to an optical fiber. The irradiance, the radiant power and the radiant intensity for different distances between the lamp and the detector was assessed. Data were compared with a simulated LED lamp by using the Zemax optic software for the realization of luminaries with the desired characteristics as required for medical applications.
The developed lamp in combination with a portable spectrometer was employed under medical supervision to detect differences in the emission spectrum of skin suspicious regions and healthy ones of a patient with non-melanoma skin cancer. The light of the LED lamp was concentrated in the examined region by means of the proper focusing of the four individual LEDs, rendering a high intensity homogeneous spot. Thus, endogenous chromophores at the skin were excited, and the emission intensity appeared to be enough to detect an enhanced peaked structure around 600 nm for some suspicious regions before treatment, and that were absence in healthy regions. These differences can be related to the augmented protoporphyrin IX content in neoplastic regions.
Results presented in this work indicates the usefulness of the developed LED lamp as an easyto-use device for the non-invasive detection of skin neoplastic pathologies, before and after treatment, with the aim of better define the malignant regions as well as predict the outcome of a certain treatment.
Key words: Non-melanoma skin cancer, one-point fluorescence detection, violet LED lamp.
The early detection of a neoplastic disease, as well as the development of more efficient treatments, are crucial for improving the survival rate. A variety of new and emerging diagnostic strategies based on spectroscopic techniques such as non-invasive one-point fluorescence (PF) detection, are available to improve the screening procedure [1,2]. PF technique provides useful information for monitoring the evolution of the abundance and distribution of endogenous fluorophores associated with the neoplastic disease in low-pigmented superficial neoplasia [3,4].
Currently, the use of devices emitting light is an indispensable element of many non-invasive diagnostic procedures. Non-invasive fluorescence detection techniques are available for point measurement which provides information useful for monitoring the abundance and location of the fluorophores in lowpigmented superficial neoplasia. These fluorophores could be classified into three main categories: endogenous fluorophores that are responsible for native tissue fluorescence (autofluorescence) like keratin, porphyrins, vitamins and lipids [1,3,5-8]; fluorophores synthetized in the tissue after external administration of a precursor molecule, specifically protoporphyrin IX (PpIX) induced by 5aminolevulinic acid (ALA) [9]; and fluorophores administrated as exogenous drug such as tetra(mhydroxyphenyl) chlorin (mTHPC), a typical photosensitizer used in photodynamic therapy (PDT) [10]. In this case, because of the optimal dose during and after PDT are extremely variable [2], the prognosis of PDT treated patients is required. In this vein, it has been reported that fluorescence measurements of PpIX in the skin of patients showed changes in PpIX levels during therapy (photobleaching) and was a good predictor of clinical results [11].
The influence of tissue optics on fluorescence measurements were comprehensively reviewed in literature [12]. Thus, there are important properties that influence fluorescence measurements in tissues, namely, attenuation of light in the tissue, presence of endogenous fluorophores which cause autofluorescence, absorption, scattering, and reflection of light. Light-induced autofluorescence spectroscopy is a very attractive tool for early diagnosis of cancer due to its high sensitivity, easy-to-use methodology for measurements, lack of need for contrast agents’ application on the tissue under investigation, possibilities for real time measurements and non-invasive tumor detection [3, 5]. This procedure allows the discrimination between pathological and normal tissue regions based on the differences in the content and metabolic state of a fluorescent compound. Fluorescence measurements are, in principle, straightforward. By filtering the reflected excitation light, it is possible to obtain rather strong signals from the tissues. Problems arise for interpreting the fluorescence signal as the fluorescence peaks are mostly broad and various fluorophores can overlap. Different optical properties in excitation and detection wavelengths also influence the signal. Furthermore, for the excitation wavelength range, generally in the UV region, the penetration depth is a few hundred micrometers, while for detection, the visible region is used, and light can go more than a couple of millimeters. These facts suggest that the intensity of fluorescence cannot be directly interpreted as the corresponding fluorophore concentration. Another consequence is that the measurement configuration, both in excitation and detection, strongly influences not only the signal level but also the shape of the spectrum. Moreover, when the lesion is highly pigmented the obtained fluorescence signal is too weak to be used for diagnostics. In such cases exogenous fluorescent markers could be applied [12,13].
In this work, we develop a violet LED light source suitable for medical application devoted to the diagnostic and treatment of non-melanoma skin cancers. The developed lamp, in combination with a portable spectrometer, is employed to detect differences between the emission spectrum of skin regions with non-melanoma skin cancer and healthy ones at the head of a patient.
Software for the LED lamp modeling:ZemaxOpticStudio 18.4.1 is a commonly used optical design program used for lighting systems design and image analysis [14-17]. Finished designs of optical devices can be exported as manufacturing-ready results such as ISO drawings and common CAD file formats. We simulated the LEDs source utilizing Blender 2.76 to create a three-dimensional model of the lens and the ZemaxOpticStudio 18.4.1 to describe the light emission performance. For this purpose, the following variables were considered: numbers of simulated rays (n), distance between the source and the sensing surface (d), dimension (12 cm x 12 cm) and number of pixels on the sensing surface (100 x 100 pixels), emission wavelengths of the source, its output power (W), and the light diffusion considered through the Lambertian fractions (1/10, 1/12, 0.55/1). Furthermore, we set the wavelength profile for the light source with a central maximum that falls off following a Gaussian curve. Results from simulations were utilized for guiding the LED lamp construction and then the outcome of the real and simulated lamps were compared.
The LED lamp was constructed employing four 3 W LEDs, coupled to individual lenses and heat sinks. Each LED is fed by an independent electrical circuit with variable electric power to modulate the light intensity.
To characterize the constructed LED lamp, illuminance/irradiance parameters such as irradiance (W/cm2), radiant power (W) and radiant intensity (W/sr) were determined. For this purpose, an AvaSpec-ULS3648-USB2-UA-25 spectrometer with a CCD detector (3648 pixels) provided with a DUV3648 filter for reduction of second-order effect, and coupled to an optical fiber (200 μm in diameter and 2 m in length) for UV / VIS / NIR range (250- 2500 nm), was utilized. A cosine law CC-VIS / NIR diffuser was adapted to the fiber optic lens. The signal was registered by Avasoft-Full Software. The optical fiber couple to the spectrometer was located at one end of an optical bench, and the light source at a known distance, at the other end of the bench (Fig.1).
Spectroscopic measurements on the skin of a patient: The lesions on the skin are registered employing a point monitoring system.
Scheme of the experimental arrangement for characterizing the LED lamp. At one end of the optical bench the LED source is located, and the tip of the fiber optic connected to the spectrometer, is placed at the other end, at a known distance. The spectrometer records the illuminance and allows expressing radiometric analogue units.
The excitation light come from the violet LED source developed, and the detection is made by an optical fiber measuring in the 300-800 nm range. The fiber during measurement is supported by hand on the surface of the targeted detection tissue (Fig.2.). For comparison, emission spectra from suspicious skin regions, as well as healthy zones were registered.
Light source Modeling:The final light pattern generated by a LED is the result of the sum of the light directly refracted by the encapsulating lens, the light internally reflected inside the lens, and the light from the reflecting cup [20]. The first step to carry out the simulation is to build the emitting source based on a LED and the corresponding lens. Thus, an 8 ° lens was designed using the Blender 2.76 program. In this software, by drawing the profile of the lens and using the tool “spin”, a solid of revolution was created. The draw lens was exported as CAD file to Zemax OpticStudio where PMMA for lens material, Lambertian lens type (Lambertian fraction) [18],
Scheme of autofluorescence point monitoring system: the excitation is external to the detector, and the detected emission light travels apart through an optical fiber.
Application of spin tool to obtain the solid of revolution of the profile drawn in b); d) simulated lens with better definition than c), which was exported to Zemax; e) system of lens-LED in Zemax, and analysis of the emission on a detector surface located at 20 cm of the LED; f) photograph of the real lens. Multiple variations were tested to model the exit beam of the light source. For example, the radiant intensity is represented for different variables (Fig.4). For n = 50.000 and Lambertian fraction 1/10, the image achieves acceptable definition on the detector surface (Fig.4c).Construction of the LED lamp: Each 3 W LED coupled to a heat sink and a lens was mounted on a mobile arm which can be displace in order to focus the lens-LED-heat sink systems on a convenient small region . The real image of the illumination area generated by the LED source with central axis-oriented lenses at 20 cm distance, is shown in Fig.5e.Comparison between simulated and constructed LED lamp:We obtained the simulated irradiance from the source (W/cm²) for different Lambertian fraction and compared it with the irradiance of the constructed LED lamp measured with the spectrometer described above. For a Lambertian. Radiant intensity for different n and Lambertian fractions for d = 20 cm and detector area 12 cm x 12 cm, i.e., 100 x 100 pixels: a) n = 10,000, Lambertian fraction: 1/10; b) n = 50,000, Lambertian fraction: 0.55 / 1; c) n = 50,000, Lambertian fraction: 1/10.
Application of the violet LED source to detect non-melanoma skin cancer:As know, the PpIX exhibits maximum light absorption (the Soret peak) at 405 nm and an emission peak in the red region. PpIX concentration is expected to be increased in pathological skin [21]. For this propose, we used the constructed violet LED lamp with maximum excitation peak at 405 nm to illuminate suspicious points in the head of a patient with a non-melanoma skin cancer before (Figure 7a) and after (Figure 7b) the treatment with a red medical laser emitting at 652 nm.
Photographs of the lesion at the head of a patient before (a) and after (b) the treatment with a clinical red laser source. (c) Average fluorescence spectrum from lesions before treatment (black circles), and fluorescence spectrum from the skin of the hand (red circles) taken as healthy skin. The reference curve obtained from the decaying tail of the peak at 505 nm is shown in dashed lines. (d) Fluorescence spectrum from treated lesions. After subtracting the reference curve, a rather clear peak in the 600 – 700 nm range related to an increased amount of PpIX in untreated pathological regions, can be distinguished in comparison to treated ones, as depicted in the insets.
The fluorescence intensity of the PpIX was recorded with a spectrometer couple to an optical fiber with the scheme showed in figure 2. The average spectrum from suspicious areas as well as regions of healthy skin exhibits an emission peak at 505 nm, being the intensity of suspicious points greater than healthy skin area. Furthermore, suspicious points exhibit another structured peak in the 600 - 700 nm range (Fig. 7c, black squares). The later feature appears as a shoulder for the case of the average emission spectrum taken from the hand skin (Fig. 7c, red squares) or from different treated points at the head (Fig. 7d). A reference curve can be obtained from the decaying tail of the peak at 505 nm to be subtracted from emission intensity at the 550 – 700 nm range [22]. The inset in Fig. 7d shows a rather clear peak, while a noisy signal is obtained for red laser treated regions (inset in Fig. 7c). This description is consistent with the increased amount of PpIX in pathological regions in comparison with a healthy skin and treated regions. A similar interpretation has been proposed in literature [23].
Fluorescence spectroscopy with 405 nm excitation for the detection of non-melanoma tumors in vivo has been reported in literature [4]. In this work, authors have demonstrated the correlation between cancer detection diagnostic accuracy and skin phototype of the patient. With increasing of cutaneous pigmentation, the diagnostic accuracy for tumor detection and differentiation from normal skin fall down. In our case, we followed the fluorescence on a patient with non-melanoma neoplastic disease before and after the treatment. It can be detected a significant decrease in the fluorescence in the 600 – 700 nm range, for treated regions (Figure 7). We employed a point monitoring system like that employed in reference [24]. There, the pharmacokinetics of PpIX in skin tumors, i.e., basal cell carcinomas (BCC) and T-cell lymphomas, as well as in normal skin has been studied utilizing red (652 nm) laser induced fluorescence for the in vivo monitoring. Results from this research showed that the emission spectra indicated the build-up of the PpiX and the tumor selectivity in the superficial layers of the area planned for treatment.
#Light-induced Spectroscopy#Autofluorescence#Non-melanoma skin cancer#one-point fluorescence detection#violet LED lamp#Journal of Clinical Case Reports Medical Images and Health Sciences.#jcrmhs
0 notes
Text

Autofluorescence of the tip of the stamens of flowers at 405 nm, 488 nm, and 561 nm, emitting a greenish blue and emerald green color like peacock feathers.
By Mei Yu (China)
Light Microscopy Awards
#mei yu#photographer#china#light microscopy awards#micro photography#autofluorescence of the tip of the stamens of flowers#nature
52 notes
·
View notes
Text
Hey everyone go to bonecrate dot gov and use promo code Sighialmr for 20 Us dollars off your first monthly crate that ill send you (note some boxes may contain violations of your states protected species act and i am not to be held liable)

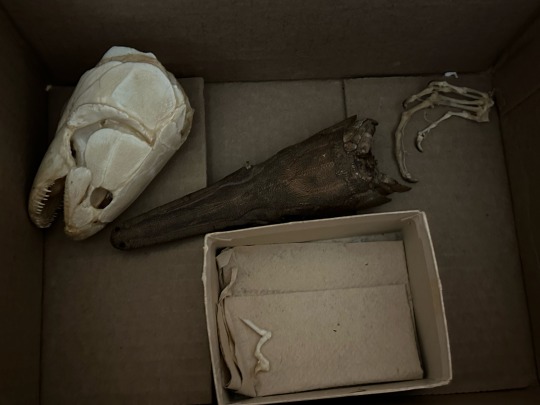


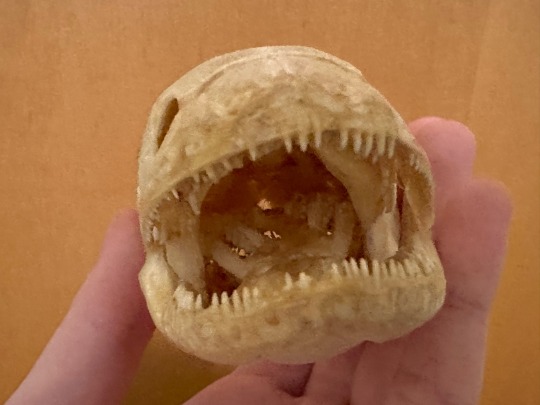
#This is a joke#Using these in microscopy and i find it funny how they were given to me loose in a box#Also these guys are all safe for collection though. they’re 30yo research specimens#bonus you get loose cat finger and a random lizard hand#Planning on taking a tooth from each fish#teeth autofluoresce really well#🦕
5 notes
·
View notes
Text
Microscopic tardigrades—plump, eight-legged arthropod relatives—are nearly indestructible, and their durability superpower may have helped them weather the deadliest mass extinction in Earth’s history, according to a new fossil analysis.
Tardigrades, also called water bears, can withstand extreme heat, cold, pressure and radiation. Two major tardigrade lines survive hostile environments through a process called cryptobiosis, in which they lose most of their body’s water and enter a suspended metabolic state.
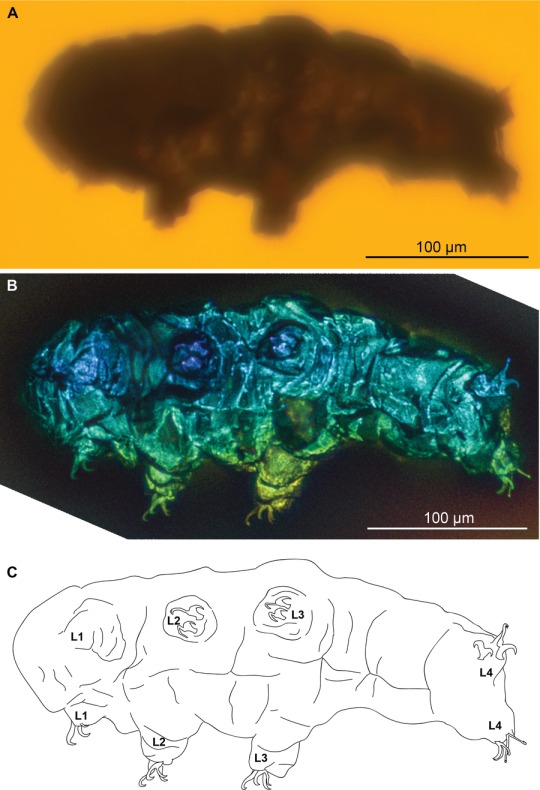
The tardigrade Beorn leggi, photographed with transmitted light under a compound microscope (A), photographed with autofluorescence under a confocal microscope (B) and represented as a schematic drawing (C).
For a new study in Nature Communications Biology, Mapalo and his colleagues used high-contrast microscopy to uncover previously unseen details in both specimens’ claws, “which are very important taxonomic characteristics in tardigrades,” Mapalo says. Tardigrade body plans have varied little for millions of years, so the small visible differences in claw shape offered crucial information about where in the tardigrade family tree these amber-trapped fossils belonged, says University of Chicago organismal biologist Jasmine Nirody (whose own work has also examined tardigrade claws).
The authors determined the smaller tardigrade was a new genus and species: Aerobius dactylus. They also revised B. leggi’s description and classification based on its claw joints. Both species were placed in the same tardigrade superfamily Hypsibioidea, and B. leggi was moved into the family Hypsibiidae. Reclassifying B. leggi based on previously unseen details clarified its relationship to living tardigrades.
The resulting family tree recalibration allowed the researchers to calculate when the two tardigrade lines that perform cryptobiosis could have diverged—putting a latest date on the likely acquisition of that skill. Their work suggests cryptobiosis appeared in tardigrades during the Carboniferous period (359 million to 299 million years ago), predating a deadly event known as the Permian extinction, or the “Great Dying,” which occurred about 252 million years ago. The authors suggest that cryptobiosis may have helped tardigrades survive the event, which wiped out 96 percent of marine life and 70 percent of life on land.
Cryptobiosis’s evolution is challenging to study, partly because tardigrade fossils are so scarce, Mapalo says. Additional fossil discoveries will help scientists pin down details about the appearance of this unique survival strategy. By sharing this result, he says, “we hope we will entice other people to be aware that fossil tardigrades exist and there are still more to be found.”
Editor’s Note (9/16/24): This article was edited after posting to correct the descriptions of the how the findings helped researchers reclassify the tardigrade family tree and when Beorn leggi was first described.
#article#science#fossils#scientific american#tardigrade#water bear#evolution#Carboniferous period#biology
23 notes
·
View notes
Text

Hazelnut (male flower), overlay of 7 channel autofluorescence microscopy. Imaged with ZEISS Axio Observer, Axiocam, Colibri 7.
75 notes
·
View notes
Text

Simple Fix
Treating whole samples for study, such as embryos, whole organisms, dissected or cultured tissues, with the well-known cell sample fixative glutaraldehyde enhances autofluorescence – the natural emission of light from some cell components – revealing structural details in 3D
Read the published research article here
Image from work by Miika Niemeläinen and Anna-Mari Haapanen-Saaristo, and colleagues
Turku Bioscience Centre, University of Turku and Åbo Akademi University, Turku, Finland
Image originally published with a Creative Commons Attribution 4.0 International (CC BY 4.0)
Published in and on the cover of Biology Open, November 2024
You can also follow BPoD on Instagram, Twitter and Facebook
5 notes
·
View notes
Note
you're a researcher!! that's so cool! if you don't mind me asking, what do you do?
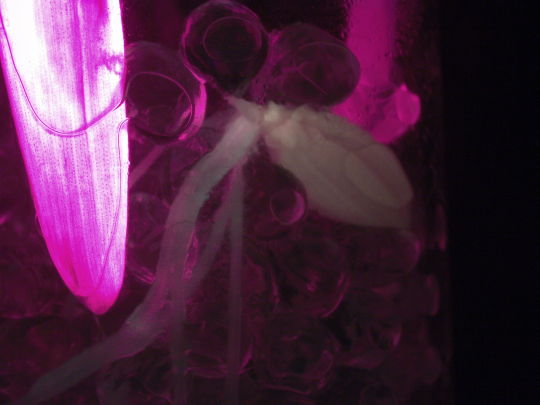
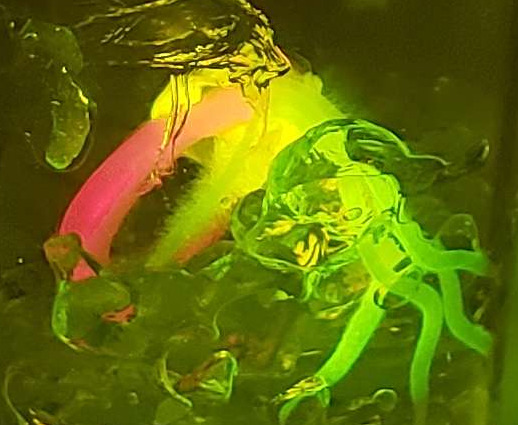
Thank you for the ask, I love talking about my research!! Currently, I'm working on studying barley and its interaction with Pseudomonas fluorescens using a clear hydrogel media instead of soil. I got interested in this project because I think that the ability to grow plants in hydrogel instead of soil to study their roots is such a cool thing, and since I'm majoring in both plant and microbial biotechnology adding the bacterial aspect helps bring everything I'm working on all together (and is something I can make a paper out of). Then to add biotechnology into the equation, we added GFP (green fluorescent protein) into the bacteria, which causes them to glow green when hit with UV light and viewed under a filter. This makes it easier to see the bacteria on the roots.
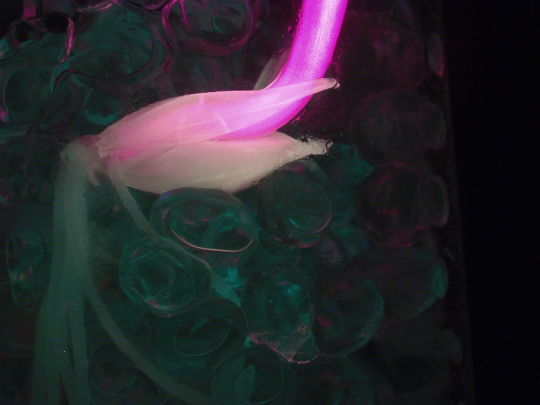
Because this projects excites me so much and has some cool pictures, I have to share some. The first picture are roots without any bacteria and the second one has the bacteria. Feel free to take a second and see if you can identify any differences between the two images.

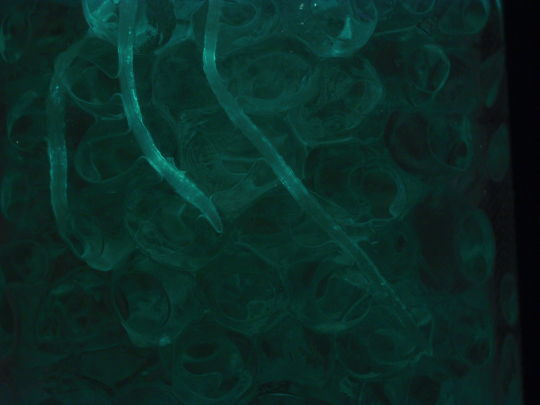
The first noticeable thing I see is within the hydrogel itself. The non-bacterial control has a much darker background, likely because there are no bacteria to fluoresce in it. However, you may notice that the roots still have a glow to them. That's actually because plants have autofluorescence based on the proteins/chemicals they produce which was visible through the filter. Now, the things that stand out to me on the bacterial roots compared to the regular ones are that they almost have a rougher appearance, likely due to the bacteria colonies growing on it. And then there is the bright spots of bacteria that are not present on the bacteria-free roots. Seeing such a stark difference so easily (since I have been looking at images of these for a while now and know what I'm looking for) honestly blew me away when this actually seemed to work.
Also, just to talk about autofluorescence again, the chlorophyll in the leaves make the plants so bright in this system. I mean look at that leaf!! I never though I'd see such a pretty plant (the last one looks slightly different from the rest because it was taken with my phone instead of the microscope camera, but catches the entire autofluorescence really well).
And to wrap this whole spiel up, let me give a little background on where I started with doing research. I actually started out by doing data analysis on differential gene expression, or the differences in expression under different conditions. A lot of analysis uses an "out of 100%" model if you will, and because of this if one gene changes expression a lot but everything else stays the same, it'll look like all those genes have lower expression compared to the one that changed even if they might not. You can see how that might be a bit of a problem. I was testing a new R package that would compare gene expression in a different way to bypass this problem and more clearly see what is actually happening to different genes.
Because I was just helping a bit on this project I never saw its conclusions before moving onto other things. I took a side off of that project to get a grant and do a systematic review on how other researchers are describing their gene expression clustering, since in R you need to define the clustering method (how different groups are compared to one another) and the number of clusters you want. Because these are human entered and can change the outcome of the data you're analyzing, it's important that what you do can be replicated, but a lot of researchers were very vague in even what packages they used to cluster. I'm still finishing up that work so hopefully I'll be able to publish a paper on it soon.
Then I've also had fun helping some of our grad students with barley biomass measurements and, my absolute favorite, soil microbe DNA extraction. That student is using differences in the soil microbiome to see if it has an impact on the growth of the barley, and is actually what inspired me to student plant-microbe interactions!
#I tried to sum all of my research experience up but if there are anymore questions please feel free to ask!#This turned into a bigger ramble than I was expecting whoops#Sorry for the delay I've been traveling and knew I had to share the images that were on my laptop#I have a love-hate relationship with explaining research to a general audience#I love it because it is a skill all scientists should have should have because research should be understandable by all#But with how specialized I've become in what I do it can sometimes be so hard to explain it in a way everyone can understand#It's okay tho because my boss can't understand what I'm doing if I don't explain it in simpler terms because she's not working on this#That being said if anything is confusing I'd love to try and clear it up!#Hoping these projects will be finished before I graduate and turned into published papers
6 notes
·
View notes
Text
From Retinal Scans to OCT: The Evolution of Ophthalmic Diagnostics
Advancements in Ophthalmic Diagnostics have revolutionized the way eye diseases are detected and treated. From traditional retinal scans to modern Optical Coherence Tomography (OCT), technology has significantly enhanced the precision of eye care. Amanat Eye Hospital, recognized as the Best Eye Hospital In Peshawar, integrates cutting-edge diagnostic tools to ensure top-tier eye health solutions.

The Importance of Ophthalmic Diagnostics
Ophthalmic diagnostics play a crucial role in early detection and management of various eye conditions, including glaucoma, macular degeneration, diabetic retinopathy, and retinal detachment. Early diagnosis through advanced imaging techniques allows for timely treatment, preventing vision loss and improving quality of life.
Evolution of Ophthalmic Diagnostic Techniques
1. Traditional Retinal Examinations
Before the advent of modern imaging technology, eye specialists relied on ophthalmoscopy and fundus photography to examine the retina. These methods provided a basic view of the internal structures of the eye but lacked the depth and accuracy needed for precise diagnoses.
2. Fluorescein Angiography (FA)
Fluorescein Angiography became a groundbreaking technique for studying the retinal blood vessels. This procedure involves injecting a fluorescent dye into the bloodstream and capturing images as the dye flows through the eye’s blood vessels. FA helps in detecting conditions like diabetic retinopathy and macular degeneration.
3. Optical Coherence Tomography (OCT)
OCT has emerged as one of the most significant advancements in Ophthalmic Diagnostics. This non-invasive imaging test provides cross-sectional images of the retina, allowing doctors to analyze each layer of the retinal structure in detail.
Benefits of OCT:
High-resolution imaging for accurate diagnosis
Early detection of retinal diseases
Quick and painless procedure
Real-time monitoring of treatment progress
4. Fundus Autofluorescence (FAF) Imaging
FAF imaging is another modern technique used to assess retinal health. It highlights metabolic changes in the retina that are invisible under traditional methods. This technique is especially useful in diagnosing inherited retinal diseases and age-related macular degeneration.
5. Advanced AI Integration in Ophthalmic Diagnostics
With the integration of Artificial Intelligence (AI), Ophthalmic Diagnostics has reached new heights. AI-powered algorithms can now analyze retinal images, detect anomalies, and predict disease progression with remarkable accuracy. Machine learning tools are helping ophthalmologists make faster and more accurate diagnoses, reducing the risk of human error.
Pioneering Ophthalmic Diagnostic Services
As the Best Eye Hospital In Peshawar, Amanat Eye Hospital is at the forefront of advanced diagnostic services. With state-of-the-art facilities and expert ophthalmologists, the hospital offers comprehensive eye exams and personalized treatment plans for patients of all ages.
Why Choose Amanat Eye Hospital?
Cutting-Edge Technology: The hospital is equipped with the latest diagnostic tools, including OCT, FA, and AI-driven imaging techniques.
Expert Ophthalmologists: A team of highly skilled eye specialists ensures precise diagnoses and effective treatments.
Patient-Centered Care: Focused on delivering personalized eye care solutions tailored to each patient’s needs.
Comprehensive Eye Health Services: From routine check-ups to advanced surgical procedures, all eye-related services are available under one roof.
Conclusion
The evolution of Ophthalmic Diagnostics has dramatically transformed the field of eye care. With advancements like OCT, AI-based image analysis, and FAF imaging, diagnosing and treating eye diseases has become more efficient and accurate. Amanat Eye Hospital, recognized as the Best Eye Hospital In Peshawar, continues to lead the way in innovative eye care, ensuring the best possible outcomes for patients.
0 notes
Text
Movie illustrating 18 serially acquired image tiles that have been registered and resampled into a continuous image volume. This volume (3 ×��1 × 6 tiles) spans five adjacent tissue sections. Fine axons are resolvable and all fibers appear continuous. Images were spectrally unmixed to remove autofluorescence of lipofuscin. https://doi.org/10.7554/eLife.10566.009
Video 2: Single axon traced to its terminus.
Depicted path represents the longest continuous axonal segment starting at the cell soma. The terminus is located in the anterior piriform cortex. White dot corresponds to the same location in both panels and corresponds approximately to the path of manually traced segment. The SNR of well-labeled axons remains high along their entire length and branch points are clearly visible. Nuclei (magenta) were counter-labeled using NuclearID-Red. Two axons, originating from distinct neurons, cross in the corpus callosum. Axon identity is straightforward to assign in this example on the basis of trajectory and labeling intensity when viewed in three dimensions. This neuron appears blue in all figures.

Complete reconstruction of axonal morphology. (a) Complete reconstruction of the same five projection neurons depicted in Figure 4 (inset). Reconstructions are overlaid on a horizontal (left) and sagittal (right) outline of the imaged mouse brain. Subset includes pyramidal neurons in layer II (blue, purple), layer V (red, black) and layer VI (green). (b) Illustration of axonal and dendritic reconstruction of the layer 5 pyramidal cell (colored red in a) shown in the coronal plane. Profile of coronal section at the rostrocaudal position of the cell body is depicted by the black dashed line. Segments were colored to highlight axonal arbors originating from common branch points.
Source: Michael N Economo, Nathan G Clack, Luke D Lavis, Charles R Gerfen, Karel Svoboda, Eugene W Myers, Jayaram Chandrashekar (2016) A platform for brain-wide imaging and reconstruction of individual neurons eLife 5:e10566 https://doi.org/
…
^Later cited in “Collaborative augmented reconstruction of 3D neuron morphology in mouse and human brains" (Zhang, Lingli et al., 2024):

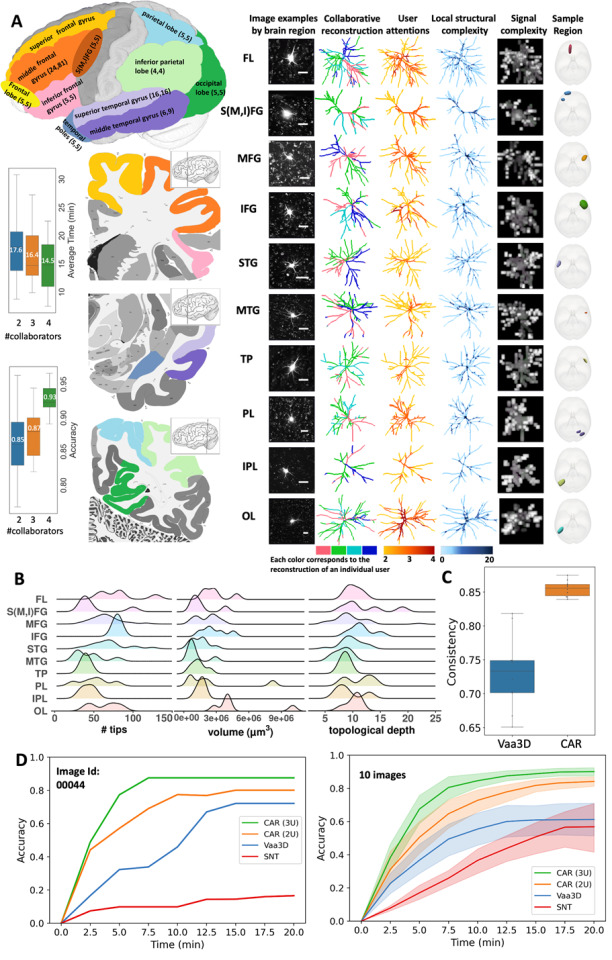
Extended Data Fig. 5. Display of 80 human neurons reconstructed using CAR. These neurons originate from 10 distinct brain regions, specifically S(M,I)FG, FL, MFG, IFG, STG, MTG, TP, PL, IPL, and OL.
More on the development of the collaborative augmented reconstruction (CAR) platform for neuron reconstruction at scale...
Within our study, we confront this challenge by introducing CAR, a tool designed to foster collaboration and facilitate the rectification of morphological and topological errors. Our tool achieves reconstructions that not only align with biological realities but also garner consensus among collaborators. Although there were efforts to develop collaborative tools23–25,46–48, most of them were designed specifically for annotating 2D image sections. In addition, simultaneous annotation was rarely adopted in prior collaborative tools. Through its provision of immersive interaction and collaborative editing of neuron anatomy, CAR empowers researchers to collaborate, capitalizing on their combined knowledge and expertise in solving challenges.
Reconstruction of human cortical dendrites in 10 brain regions:
0 notes
Text
AMD: Disciform scar
In advanced age-related macular degeneration (AMD), a disciform scar represents the end stage of neovascular AMD. Optical Coherence Tomography (OCT) shows hyperreflective fibrotic tissue replacing normal retinal layers, with possible subretinal fluid or retinal thinning. Fundus autofluorescence (FAF) reveals hypoautofluorescence due to retinal pigment epithelium (RPE) atrophy, with surrounding…
0 notes
Text
Parylene Coating: The Future of Optical Biointerfaces in Photonics
Parylene is a trade name for a generic polymer material that is characterized by rather useful properties. Parylene C and Parylene N are two of the most frequently used Parylenes Parylene C is appreciated for its high pinhole resistance and barrier characteristics and Parylene N is appreciated for that it is biocompatible and has low autofluorescence.
Source URL : https://relxnn.com/parylene-coating-the-future-of-optical-biointerfaces-in-photonics/
0 notes
Text
Autofluorescence, my old nemesis...
0 notes
Text

Despite Bright Light
New approach that enables ten RNA and/or protein targets in whole zebrafish embryos and mouse brain sections to be visualised and quantified simultaneously, even in highly autofluorescence (natural emission of light by biological structures) samples
Read the published research article here
Image adapted from figure in work by Samuel J. Schulte and colleagues
Division of Biology & Biological Engineering, California Institute of Technology, Pasadena, CA, USA
Image originally published with a Creative Commons Attribution 4.0 International (CC BY 4.0)
Published in Development, February 2024
You can also follow BPoD on Instagram, Twitter and Facebook
8 notes
·
View notes