#Rprogramming
Explore tagged Tumblr posts
Text
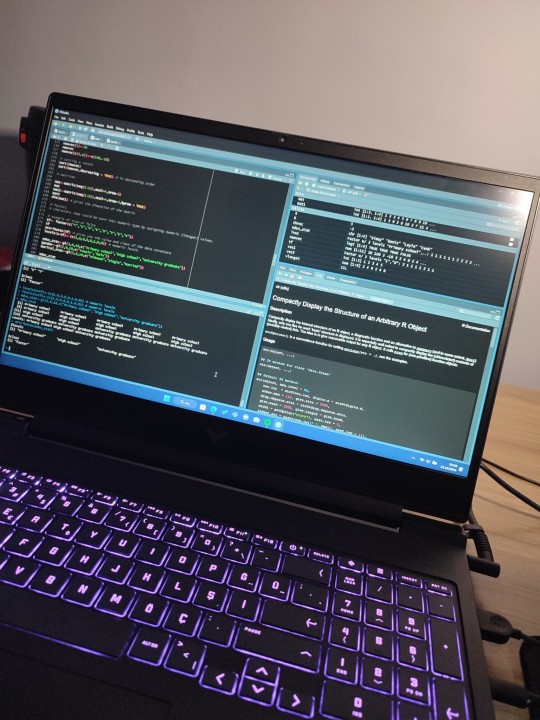
Let's go to the basics then
11 notes
·
View notes
Text
Free R Programming Course – Learn Data Skills and Earn a Certificate! 🚀
Free R Programming Course – Learn Data Skills and Earn a Certificate!
Are you looking to dive into data science or add a powerful programming language to your skill set? This Free R Programming Course is exactly what you need! 🖥️📊
Here’s what’s included:
7 hours of self-paced video lessons
A Completion Certificate for your resume and LinkedIn
90 days of access to all course content
Whether you’re a beginner or just wanting to boost your data skills, this course covers it all—from foundational concepts to data handling, visualization, and more.
👉 Ready to get started?
Free R Programming Course with Certificate | Start Now

#rprogramming#datascience#learntocode#free course#data analysis#programming#futureready#certification course#dataanalytics#codingcommunity
3 notes
·
View notes
Text
📊 R Programming Assignment Help: Simplify Data Analysis
Struggling with R programming assignments? Our team of experts is here to help you with all your data analysis, statistical modeling, and visualization tasks. Whether you’re dealing with basic functions or complex algorithms, we’ve got you covered.
👨💻 Our R Programming Services Include:
📊 Data manipulation with dplyr and tidyr 📉 Data visualization with ggplot2 📚 Statistical modeling and hypothesis testing ✅ Well-documented code and explanations for easy understanding
Don’t let your R assignments overwhelm you—get professional help today!
📞 WhatsApp: +971 50 161 8774 📧 Email: [email protected]
0 notes
Text

In today’s data-driven world, the ability to analyze and interpret data is a critical skill that can open doors to countless opportunities. Whether you're a professional looking to upskill, a student aiming to build a strong foundation, or an entrepreneur seeking to make data-backed decisions, Krishna Training offers comprehensive Data Analysis courses designed to empower you with the knowledge and tools you need to succeed. Ready to take the first step toward a data-driven future? Enroll in Krishna Training’s Data Analysis courses today and unlock your potential!
#DataAnalysis#DataScience#KrishnaTraining#LearnDataAnalysis#DataSkills#DataVisualization#Python#RProgramming#SQL#Tableau#PowerBI#MachineLearning#DataDriven#CareerGrowth#Upskill
0 notes
Text
🌟 best programming language for data science? take the quiz!
what’s the ultimate programming language for data science? python, r, sql, or julia? each language has its own charm, but which one stands out the most? take this fun quiz and find out!
at data science school, we’re here to guide you through the exciting journey of data science. whether you're starting fresh or looking to enhance your skills, we offer courses that cover everything from programming basics to advanced machine learning and data analytics.
📍 visit us:
address: metro pillar no: a689, jntu metro station, 3rd floor, dr. atmaram estates, beside sri bhramaramba theatre, hyder nagar, vasantha nagar, hyderabad, telangana 500072
phone: +91 99488 61888
website: www.datascienceschool.in
email: [email protected]
ready to transform your passion for data into a career? join us at data science school and start building your future today!
#datascience#programminglanguages#python#rprogramming#sql#julia#datasciencequiz#learnprogramming#datascienceschool#hyderabad#machinelearning#dataanalytics#datascienceeducation#techlearning
0 notes
Text
Master R Programming from Scratch: A Guide for Beginners
This course provides a structured introduction to R programming, teaching you from the basics all the way to more advanced features. You'll learn about data structures, analysis tools, and how to use R for solving real-world problems. Ideal for absolute beginners, the course ensures you develop a solid foundation in R programming, giving you the skills needed for data science tasks.
0 notes
Text

Master R programming with Edoxi in Dubai! Get 24 hours of training, mentorship, study materials, and mock tests. Enroll now!
Call us: +971 4380 1666
Mail us, at [email protected]
0 notes
Text
Module 12. Assignment
Question 1
A.
B.
C.
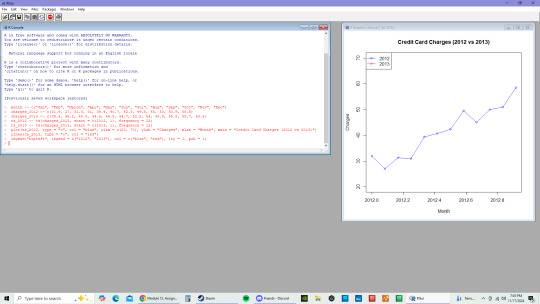
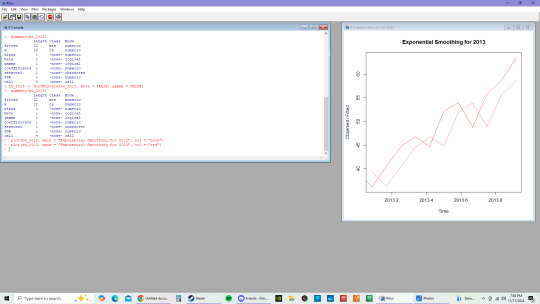
Based on the time series results, both models for 2012 and 2013 indicate that between January and December, there are upward trends. This would suggest that there is growth in spending behaviors over time when there is an increase in monthly charges.
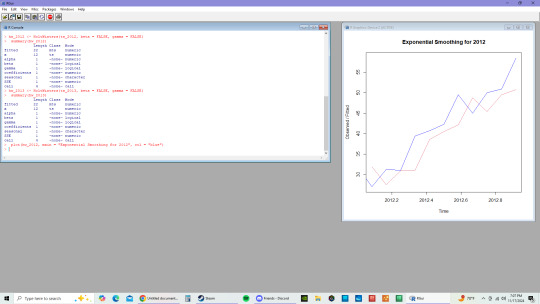
Based on the Exponential Smoothing Model, the 2012 model shows that there are short term fluctuations that are smoothed with the upward trajectory. While the 2013 model, shows a much stronger growth than the previous year as well as less fluctuations in the last half of the year in comparison to 2012.
0 notes
Text
Open Source Tools for Data Science: A Beginner’s Toolkit
Data science is a powerful tool used by companies and organizations to make smart decisions, improve operations, and discover new opportunities. As more people realize the potential of data science, the need for easy-to-use and affordable tools has grown. Thankfully, the open-source community provides many resources that are both powerful and free. In this blog post, we will explore a beginner-friendly toolkit of open-source tools that are perfect for getting started in data science.
Why Use Open Source Tools for Data Science?
Before we dive into the tools, it’s helpful to understand why using open-source software for data science is a good idea:
1. Cost-Effective: Open-source tools are free, making them ideal for students, startups, and anyone on a tight budget.
2. Community Support: These tools often have strong communities where people share knowledge, help solve problems, and contribute to improving the tools.
3. Flexible and Customizable: You can change and adapt open-source tools to fit your needs, which is very useful in data science, where every project is different.
4. Transparent: Since the code is open for anyone to see, you can understand exactly how the tools work, which builds trust.

Essential Open Source Tools for Data Science Beginners
Let’s explore some of the most popular and easy-to-use open-source tools that cover every step in the data science process.
1. Python
The most often used programming language for data science is Python. It's highly adaptable and simple to learn.
Why Python?
- Simple to Read: Python’s syntax is straightforward, making it a great choice for beginners.
- Many Libraries: Python has a lot of libraries specifically designed for data science tasks, from working with data to building machine learning models.
- Large Community: Python’s community is huge, meaning there are lots of tutorials, forums, and resources to help you learn.
Key Libraries for Data Science:
- NumPy: Handles numerical calculations and array data.
- Pandas: Helps you organize and analyze data, especially in tables.
- Matplotlib and Seaborn: Used to create graphs and charts to visualize data.
- Scikit-learn: A powerful tool for machine learning, offering easy-to-use tools for data analysis.
2. Jupyter Notebook
Jupyter Notebook is a web application where you can write and run code, see the results, and add notes—all in one place.
Why Jupyter Notebook?
- Interactive Coding: You can write and test code in small chunks, making it easier to learn and troubleshoot.
- Great for Documentation: You can write explanations alongside your code, which helps keep your work organized.
- Built-In Visualization: Jupyter works well with visualization libraries like Matplotlib, so you can see your data in graphs right in your notebook.
3. R Programming Language
R is another popular language in data science, especially known for its strength in statistical analysis and data visualization.
Why R?
- Strong in Statistics: R is built specifically for statistical analysis, making it very powerful in this area.
- Excellent Visualization: R has great tools for making beautiful, detailed graphs.
- Lots of Packages: CRAN, R’s package repository, has thousands of packages that extend R’s capabilities.
Key Packages for Data Science:
- ggplot2: Creates high-quality graphs and charts.
- dplyr: Helps manipulate and clean data.
- caret: Simplifies the process of building predictive models.
4. TensorFlow and Keras
TensorFlow is a library developed by Google for numerical calculations and machine learning. Keras is a simpler interface that runs on top of TensorFlow, making it easier to build neural networks.
Why TensorFlow and Keras?
- Deep Learning: TensorFlow is excellent for deep learning, a type of machine learning that mimics the human brain.
- Flexible: TensorFlow is highly flexible, allowing for complex tasks.
- User-Friendly with Keras: Keras makes it easier for beginners to get started with TensorFlow by simplifying the process of building models.
5. Apache Spark
Apache Spark is an engine used for processing large amounts of data quickly. It’s great for big data projects.
Why Apache Spark?
- Speed: Spark processes data in memory, making it much faster than traditional tools.
- Handles Big Data: Spark can work with large datasets, making it a good choice for big data projects.
- Supports Multiple Languages: You can use Spark with Python, R, Scala, and more.
6. Git and GitHub
Git is a version control system that tracks changes to your code, while GitHub is a platform for hosting and sharing Git repositories.
Why Git and GitHub?
- Teamwork: GitHub makes it easy to work with others on the same project.
- Track Changes: Git keeps track of every change you make to your code, so you can always go back to an earlier version if needed.
- Organize Projects: GitHub offers tools for managing and documenting your work.
7. KNIME
KNIME (Konstanz Information Miner) is a data analytics platform that lets you create visual workflows for data science without writing code.
Why KNIME?
- Easy to Use: KNIME’s drag-and-drop interface is great for beginners who want to perform complex tasks without coding.
- Flexible: KNIME works with many other tools and languages, including Python, R, and Java.
- Good for Visualization: KNIME offers many options for visualizing your data.
8. OpenRefine
OpenRefine (formerly Google Refine) is a tool for cleaning and organizing messy data.
Why OpenRefine?
- Data Cleaning: OpenRefine is great for fixing and organizing large datasets, which is a crucial step in data science.
- Simple Interface: You can clean data using an easy-to-understand interface without writing complex code.
- Track Changes: You can see all the changes you’ve made to your data, making it easy to reproduce your results.
9. Orange
Orange is a tool for data visualization and analysis that’s easy to use, even for beginners.
Why Orange?
- Visual Programming: Orange lets you perform data analysis tasks through a visual interface, no coding required.
- Data Mining: It offers powerful tools for digging deeper into your data, including machine learning algorithms.
- Interactive Exploration: Orange’s tools make it easier to explore and present your data interactively.
10. D3.js
D3.js (Data-Driven Documents) is a JavaScript library used to create dynamic, interactive data visualizations on websites.
Why D3.js?
- Highly Customizable: D3.js allows for custom-made visualizations that can be tailored to your needs.
- Interactive: You can create charts and graphs that users can interact with, making data more engaging.
- Web Integration: D3.js works well with web technologies, making it ideal for creating data visualizations for websites.
How to Get Started with These Tools
Starting out in data science can feel overwhelming with so many tools to choose from. Here’s a simple guide to help you begin:
1. Begin with Python and Jupyter Notebook: These are essential tools in data science. Start by learning Python basics and practice writing and running code in Jupyter Notebook.
2. Learn Data Visualization: Once you're comfortable with Python, try creating charts and graphs using Matplotlib, Seaborn, or R’s ggplot2. Visualizing data is key to understanding it.
3. Master Version Control with Git: As your projects become more complex, using version control will help you keep track of changes. Learn Git basics and use GitHub to save your work.
4. Explore Machine Learning: Tools like Scikit-learn, TensorFlow, and Keras are great for beginners interested in machine learning. Start with simple models and build up to more complex ones.
5. Clean and Organize Data: Use Pandas and OpenRefine to tidy up your data. Data preparation is a vital step that can greatly affect your results.
6. Try Big Data with Apache Spark: If you’re working with large datasets, learn how to use Apache Spark. It’s a powerful tool for processing big data.
7. Create Interactive Visualizations: If you’re interested in web development or interactive data displays, explore D3.js. It’s a fantastic tool for making custom data visualizations for websites.
Conclusion
Data science offers a wide range of open-source tools that can help you at every step of your data journey. Whether you're just starting out or looking to deepen your skills, these tools provide everything you need to succeed in data science. By starting with the basics and gradually exploring more advanced tools, you can build a strong foundation in data science and unlock the power of your data.
#DataScience#OpenSourceTools#PythonForDataScience#BeginnerDataScience#JupyterNotebook#RProgramming#MachineLearning#TensorFlow#DataVisualization#BigDataTools#GitAndGitHub#KNIME#DataCleaning#OrangeDataScience#D3js#DataScienceForBeginners#DataScienceToolkit#DataAnalytics#data science course in Coimbatore#LearnDataScience#FreeDataScienceTools
1 note
·
View note
Text
Learn how to land your first job as a data analyst with this comprehensive guide. Discover the essential skills, practical experience tips, portfolio-building strategies, and effective networking techniques to kickstart your data analytics career.
#DataAnalyst#DataAnalysis#CareerTips#JobSearch#DataScience#DataSkills#SQL#Python#RProgramming#Tableau#PowerBI#CareerAdvice#JobHunt#Analytics#DataVisualization#TechCareers#EntryLevelJobs#Networking#ProfessionalGrowth#CareerDevelopment
0 notes
Text
📊 Master Data Science with R Programming: Elevate Your Analysis
Discover the depth of R programming for robust data science and analytics. Learn to manipulate data, conduct advanced statistical tests, and create impactful visualizations. From data exploration to predictive modeling, unlock the full potential of R.
👨💻 Practical Examples: Explore R with practical applications, including:
📈 Regression analysis and predictive modeling
📉 Time series forecasting and trend analysis
📊 Data visualization using ggplot2 and interactive plots
📚 Tutorials on data cleaning, statistical methods, and machine learning techniques
🔍 Uncover Insights: Dive deep into your data to reveal hidden patterns and actionable insights with R's powerful analytical tools. From hypothesis testing to model validation, empower your decision-making and drive impactful outcomes.
Ready to transform your data analysis skills with R programming? Let's analyze together!
📞 WhatsApp: +971 50 161 8774 📧 Email: [email protected]
0 notes
Text
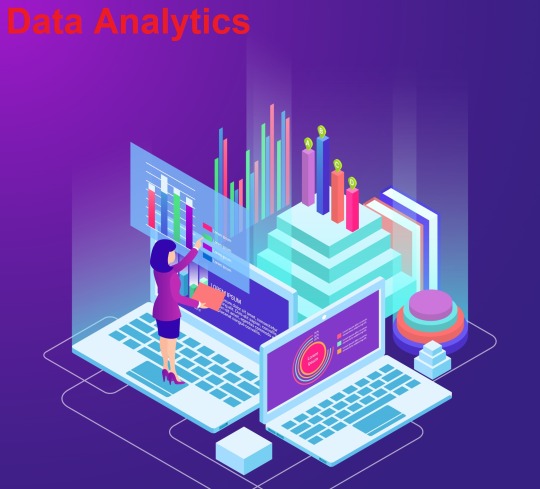
In today's data-driven world, the demand for skilled professionals in data analytics is soaring. If you're aspiring to thrive in this dynamic field, look no further than APTRON Solutions, the premier Data Analytics Training Institute in Noida. With a reputation for excellence and a track record of producing industry-ready professionals, APTRON Solutions stands as your gateway to a lucrative career in data analytics
#DataAnalytics#DataScience#DataTraining#Noida#APTRONSolutions#CareerDevelopment#SkillBuilding#IndustryExperts#HandsOnLearning#PlacementAssistance#Python#RProgramming
0 notes
Text
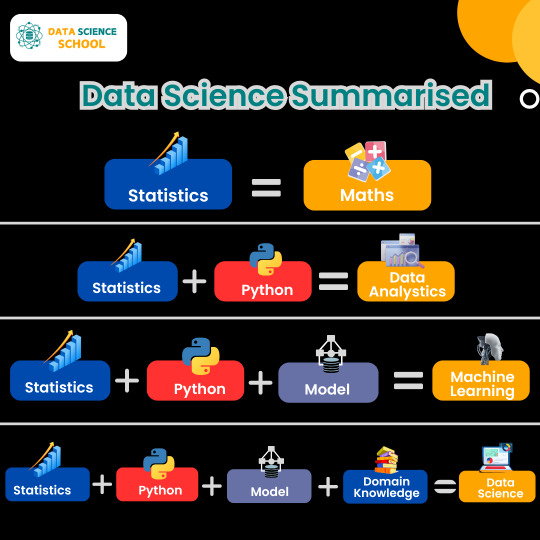
"Unlock the journey to mastering Data Science! 🚀 From Statistics to Machine Learning and beyond, combine tools, models, and domain knowledge to unleash insights. 💡📊
0 notes
Text

Master R programming with Edoxi in Dubai! Get 24 hours of training, mentorship, study materials, and mock tests. Enroll now!
Call us: +971 4380 1666
Mail us, at [email protected]
0 notes
Text
R in data science is a programming language used for statistical analysis, data visualization, and machine learning tasks.
Stay tuned for the next post!
know more: https://www.analyticsshiksha.com
#RProgramming#DataScienceTools#DataAnalysis#super30#artofproblemsolving#analyticsshiksha#checkyoureligibilty#super30dataanalyticsprogram#StatisticalProgramming#DataVisualization#DataScienceBasics#RStats#DataAnalytics#DataScientists#DataDrivenDecisions#StatisticalAnalysis#DataScienceSkills#ProgrammingLanguage#DataMining#MachineLearning#DataAnalysisTools#DataScienceCommunity#DataScienceEducation#DataScienceTutorials#StatisticalModels#RProgrammingLanguage#DataScienceBeginner#DataScienceInsights
0 notes
Text
Module 11. Assignment
Disclaimer: I am having some difficulty with RStudio in trying to get it to run the new update, so I am just using the RGui [R Console] instead.
Question 1
With a t value of -3.2269 and a significance level of 0.005644 as well as a degree of freedom of 15, this suggests that the treatment in comparison to the placebo significantly reduces the outcome measure.

Question 2
In the model with interaction (a*b), it is more susceptible to singularities than the model with only interaction term (a:b). The fit of model (a*b) is more appropriate if the sole influence of z is from combined levels of a and b than model (a:b).

0 notes