#Radarsat-1
Explore tagged Tumblr posts
Visit Tumblr Blog
Explore Tumblr blogs with no restrictions, modern design and the best experience.
Last Seen Tumblr Blogs


Fun Fact
Tumblr has been providing a Korean-language service since 2013.
Link
Ottawa (SPX) Oct 20, 2023 The Government of Canada recently allocated $1.012 billion to the Canadian Space Agency to support immediate and future satellite Earth observation (EO) data needs. This funding will be used to: + design and develop a replacement satellite for the RADARSAT Constellation Mission (RCM) + design a next-generation satellite system to succeed the RCM This initiative is called RADARS
0 notes
Text
SpaceX Starlink 9 launched in to orbit
SpaceX - Falcon 9 / Starlink Mission patch. August 8, 2020
SpaceX Starlink 9 launch
A SpaceX Falcon 9 rocket launched 57 Starlink satellites (Starlink-9) and two BlackSky Earth-imaging satellites from Launch Complex 39A (LC-39A) at Kennedy Space Center in Florida, on 7 August 2020, at 05:12 UTC (01:12 EDT).
SpaceX Starlink 9 launch & Falcon 9 first stage landing, 7 August 2020
Following stage separation, Falcon 9’s first stage (Block B1051) landed on the “Of Course I Still Love You” drone-ship, stationed in the Atlantic Ocean.
Falcon 9’s first stage landed on the “Of Course I Still Love You” drone-ship
Falcon 9’s first stage previously supported Crew Dragon’s first demonstration mission to the International Space Station, launch of the RADARSAT Constellation Mission, and the fourth and seventh Starlink missions.
Starlink Satellite Constellation
A SpaceX Falcon 9 rocket launches the tenth batch of approximately 60 satellites for SpaceX’s Starlink broadband network, a mission designated Starlink 9. Two Earth observation microsatellites for BlackSky Global, a Seattle-based company, will launch as rideshare payloads on this mission. Moved forward from June 24. Delayed from June 23, June 25 and June 26. Scrubbed on July 8 due to poor weather. Scrubbed on July 11 due to technical issue. Delayed from July 29, July 31, Aug. 1 and Aug. 6. For more information about SpaceX, visit: https://www.spacex.com/ Images, Video, Text, Credits: SpaceX/SciNews/Orbiter.ch Aerospace/Roland Berga. Greetings, Orbiter.ch Full article
5 notes
·
View notes
Text
Synthetic aperture radar finally shedding its mystique
https://sciencespies.com/space/synthetic-aperture-radar-finally-shedding-its-mystique/
Synthetic aperture radar finally shedding its mystique
When Capella Space’s first operational synthetic aperture radar satellite launched from New Zealand last month on a Rocket Lab Electron, a team of agriculture specialists at The Climate Corporation watched with excitement.
“We were really happy,” said Steven Ward, the director of geospatial sciences at The Climate Corporation, a San Francisco-based subsidiary of life sciences and pharmaceutical giant Bayer that leverages satellite imagery to help farmers boost crop yields and insure against weather-driven losses. “We actually had a Slack channel where we were celebrating that launch.”
The Climate Corporation processed 600 million satellite images in 2019, most of it optical, Ward said. The company hasn’t integrated synthetic aperture radar, or SAR, imagery into its Climate FieldView product line yet, but is studying how radar, which can peer through clouds, could fill gaps left by optical satellites over notoriously cloudy regions like Brazil, Indonesia and the Niger delta, he said.
“We’re getting bits and pieces of the story of the field,” Ward said. “What adding SAR data into the mix does is it fills in the gaps. We’re missing chapters, and it’s filling in those chapters.”
The Climate Corporation integrates satellite imagery with other data sources, streaming mapped progress directly to computer-equipped farming machinery. Farmers are able to see and analyze the progress of planting, crop protection, and harvesting in real time using satellite imagery. Credit: The Climate Corporation
SAR satellites can gather data day and night, and through all weather conditions, but the resultant imagery is typically more expensive, less available, and more difficult to use than optical imagery.
Technological advances, as much on the ground as in space, are breaking down those barriers, positioning SAR for much more widespread adoption, according to experts.
“For the first time in history, the ground segment is ready, the cloud computing is ready, and the SAR satellite systems are ready,” said Alexis Conte, a Euroconsult analyst specialized in the geospatial sector. “It is promising.”
Before joining Euroconsult in 2017, Conte worked for France’s agriculture ministry where it proved challenging to get SAR imagery quickly because cloud computing was still nascent, he said. Now, SAR customers can easily use cloud platforms like Amazon Web Services, Conte said, or access imagery through web portals from SAR providers Maxar Technologies and Airbus Defence and Space that include analytical tools to process SAR data.
A wave of startups including Capella Space, Iceye, iQPS Inc., PredaSAR, Umbra Labs and Synspective have launched or are preparing to launch SAR smallsats that promise faster revisit times and lower costs, he said.
“They are going to drive the market,” Conte said of the several smallsat SAR constellations in the offing. “They are lowering the price because the [capital expenditure for] each satellite is very low.”
SAR DEMAND ON THE INCREASE
So many new constellations are in development that the U.S. National Geospatial Intelligence Agency conducted a study this year to better understand the state of commercial SAR, said Jared Newton, the special projects officer for NGA’s source commercial and business operations group.
“The U.S. commercial market has really sprung up hot and heavy in the last couple of years, so we had to go back and re-look at opportunities that we think we could apply SAR commercial capabilities,” he said.
That internal study concluded that commercial SAR can help meet U.S. geospatial intelligence needs, Newton said.
“We definitely see expanded opportunities for private sector SAR, particularly RADAR LOVE as that demand for unclassified and sharable geoint has increased,” he said.
NGA will use those findings to inform requirements for the National Reconnaissance Office, the U.S. spy satellite agency responsible for acquiring imagery needed for military and intelligence operations.
The European Union’s maritime safety agency, EMSA, also sees an increasing need for SAR data, particularly for its Copernicus Maritime Surveillance program, which provides Earth-observation products to member governments for law enforcement, fishery management, pollution monitoring, and other applications. The European Union’s 27 member states plus Iceland, Liechtenstein, Norway, and Switzerland are entitled to use the agency’s SAR-derived products, EMSA said in a written response to questions from SpaceNews.
“The demand for [SAR] services has been increasing as users acknowledge the added value of this tool for maritime surveillance when offered in near real time,” EMSA said.
EMSA’s Copernicus Maritime Surveillance program is driving much of that growth, EMSA said, by buying Radarsat-2 data through MDA and TerraSAR-X data through Airbus. EMSA also relies on free SAR data from Europe’s Sentinel-1 satellite to detect oil spills under a separate program called CleanSeaNet.
“The objective of EMSA is to maintain access to as many missions as possible and a portfolio of providers as large as possible to be able to address all requests at any time,” the agency said.
THE NORMALIZATION OF SAR
While defense and intelligence agencies remain the largest consumers of SAR imagery, commercial applications are the fastest growing segment of the market, Conte said. Customers in agriculture, energy, finance, infrastructure and other sectors are all adopting SAR, which they often use in ways that are complementary to optical imagery, he said.
Geospatial data customers accustomed to optical imagery often view SAR as an add-on, not a substitute, for other information sources. The Climate Corporation hopes to add SAR to infotech products that already incorporate data from weather instruments, farm machinery and optical satellites to provide an even fuller understanding of crop health, Ward said. No single source of data provides the whole picture, he said.
Ursa Space Systems, a geospatial analytics company that specializes in SAR, has blended SAR images with optical photos from BlackSky’s nascent satellite fleet and ship-tracking data from Spire’s sizable cubesat constellation to provide more comprehensive maritime products, Ursa CEO Adam Maher said.
Combining SAR with other data helps Ursa sell imagery products to customers in a wide variety of industries, many of which weren’t familiar with SAR until recently, he said.
“In oil and gas, our customers were very used to optical, but now having SAR has become a selling point,” said Maher.
SAR satellite operators face the two-pronged challenge of making potential customers aware of their imagery, and making their imagery readily usable for those customers.
SAR is not as big a business as optical imagery, but it is projected to grow steadily in the years ahead. Credit: Euroconsult
Ursa is one of the “larger consumers” of SAR data, Maher said, relying on e-Geos, SI Imaging Services, Iceye and others for imagery that it feeds into analytics dashboards for provide rapid change detection alerts.
Maher said demand for SAR is coming from virtually every industry. “Being able to understand what’s going on in parts of the world that are not easily accessible to optical satellites is really important,” he said.
Putting SAR imagery to work does come with challenges, Maher added. Details that are obvious in optical images are easy to miss in SAR images without special training or software designed to interpret the data, he said.
To the untrained eye, a SAR image looks like a “bunch of black and white speckled dots,” Maher said. Ursa focuses heavily on training computer algorithms to detect objects of interest from those images, he said.
Even geospatial specialists at The Climate Corporation had a tough time interpreting radar imagery they were working with as part of the company’s recent SAR suitability study, Ward said.
“The data is big and unwieldy, and it doesn’t come cleanly packaged. Even some of my most well versed and best remote sensing scientists didn’t have a lot of experience working with radar data,” he said. “There was a learning curve there because so many institutions focused on teaching purely optical imaging, but we’re seeing a bit of a shift there.”
When it comes to understanding SAR, Euroconsult’s Conte said the onus should lay more heavily on SAR providers to deliver data products their customers understand.
“The operator will have to be educated about end-user expectations and first get a good knowledge about their world in order to deliver the appropriate services,” he said.
Getting familiar with new customers and their markets will help the satellite industry communicate about SAR to an even larger audience, Ursa’s Maher said.
“It’s really important to make sure when we’re educating other folks that we’re educating them in the languages and industry knowledge that they know,” he said.
This article originally appeared in the Sept. 14, 2020 issue of SpaceNews magazine.
#Space
1 note
·
View note
Text
4th Month Tech Update: Slow & Steady
UX research was the primary focus
This month was extremely UX research heavy. So much so, that the team had to divvy up the work and tackle it over the span of weeks. A great deal of the month was spent on the following tasks:
Producing transcriptions of audio interviews with applicants to, and staff of, the MSP (multi-sectoral partnerships) program - thankfully all done via software
Manually reviewing the transcriptions and encoding key ideas into comments on the document, based on a pre-established legend of relevant themes
Writing out those comments on sticky notes
Organizing, reorganizing, and further reorganizing those sticky notes into sensible clusters that lucidly tell the story of staff and applicants regarding the MSP program
With the final research report as yet to be written, our UX research journey continues into our fifth month. We anticipate the report coming out soon. It will be a massive milestone.

Moving forward, slowly
The path has been laid out. The lines are drawn. Out of a chasm of ambiguity a shape has formed. It looks like on November 14th we will be starting our 30 day trial license of a grant management software called Apply. This has been a long time coming. From a germinating possibility among many options, we now see a shoot forming where Apply was planted. To be sure, there are still plenty of potential barriers threatening corrupt, uproot, or otherwise soil the seedling. We have, for our part, done our due diligence to plant it in the right soil, and to provide it with all the nutrients required. (Who knew botany would be part of our work?) As a team we have put forth a document explaining all the reasons why a public cloud, software as a service product like Apply is by far the ideal way to go. Here is a taster of reasons supporting our proposal for Apply: low cost, sustainability, high security, fully end-to-end, easily customized, feature-rich, and satisfying policy ideals.
Presenting at Adobe
After running a Vue.js workshop at Shopify Canada with the Meetup.com group “Ottawa Codes” in September, I followed with an October presentation at Adobe Canada via the Meetup.com group “Javascript Ottawa”. It was the first time I gave the presentation, and it was to a group of ~50 attendees. The slide deck was sparse, as intended. With only 20 minutes to present, I could not run the workshop, and instead opted to give a presentation on the making of the workshop - the what and the why. It went well. There were some awkward pauses and some laughs, most of which were intended.

The part of my presentation that resonated most with audience members was my reiteration of a story told the behavioural economist Dan Ariely in one of his fantastic books. (I highly recommend them all.) He tells the following story (seen here from Psychology Today, and here from the BBC), which unfortunately might misrepresent the true causal effect involved. General Mills released Betty Crocker instant cake batter in the 1950s. Bakers were to just add water, place it in the oven, and voila - the cake was ready! Sales were horrible, however, so the company hired psychologist Ernest Dichter to uncover the cause. Dichter’s research led him to the main culprit: adding water was too easy. Bakers felt a certain moral guilt for not having actually baked the cake from scratch. In other words, you could bake this cake, but exclaiming “I baked this cake!” didn’t sit well with bakers. To resolve the issue - the issue of it being too easy - Ditchter suggested making the addition of eggs mandatory in the baking process. Consequently, the new recipe required adding water and eggs. The addition of the extra step - i.e., the eggs - sufficed to remove the moral guilt stunting prior sales, and sales took off (or so the story goes).
Space Apps Ottawa 2019
From October 18th-20th, I participated in Space Apps Ottawa. Space Apps is a global NASA hackathon, with chapters in major cities all over the globe. There were over 200 similar events occurring simultaneously all over the world. Representatives from the Canadian Space Agency (CSA) were in attendance, and I chose to tackle one of their challenges as opposed to a NASA one. After networking on the Friday night, and came to understand the archival struggles of RADARSAT-1. RADARSAT-1 is a Canadian satellite in service from 1995-2013. It captured radar imagery in a variety (over 20) of beam modes. Images from this satellite have been used for a myriad of reasons. For example, tracking and plotting shipping routes, surveying the military capabilities of other nation states, tracking ice coverage and ice melting, tracking urban development with a historical lens, and so forth. The Canadian government can even use it to verify whether or not farmers are planting the crops they say they are planting, and for which they are receiving certain subsidies.

Of the data captured, 50%, or roungly 800k images, currently resides in Canada. Of that 50%, only 2% of the data has been processed into images. The other 98% remains in its raw format. Processing the images is highly expensive, and many of the images may not be useful considering that many of them are only historically relevant (e.g., tracking melting ice in 1998). Still, the CSA believes there is a great wealth of useful data there, and with the primacy of big data and artificial intelligence within the private sector, the CSA is convinced that much of the data can be economically useful. There is a problem: they aren’t sure which of the 98% of the images are useful. Over the weekend, my team and I built a solution for the CSA. At the moment the public cannot easily express their interest for what data should be converted into images, because the current solution is lacking. It doesn’t enable users to see what data is available where easily, and it quickly leads to frustration. Our solution is to plot all the metadata (the data about the raw images) on a map, so that users can easily see what data is available and where. Through the use of filters, users quickly and easily narrow down the data to what is relevant to them. What is more, there is an analytics service that can automatically track users’ interactions with the map, such that the CSA can passively discover what is of interest to users. The solution built by the team was phenomenal. There is a prototype of it the web app here. (Only the beam mode filters are working at the moment.) Although the hackathon was one of the most modest one’s I have been to in terms of venue, I got the chance to work on a fascinating project with very smart and humble teammates. It was definitely a win. Also, we won our challenge space and will now be participating in national judging soon. With any luck, work on this project will continue, and I will have updates. You can watch a two-minute video of the hackathon here.
Milestones reached

Moved forward on UX research
Acquired trial license of Apply
Gave a talk at Ottawa Javascript
Built something at Space Apps Ottawa
1 note
·
View note
Text
FAWKESNET SPACE INDUSTRIES UNINCORPORATED
Elon made Starlink I have more Earth bound dreams. Current Operations The Remote Ground Terminal is a demonstration system used to directly downlink commercial imagery from the WorldView 1-2, GeoEye-1 and RADARSAT-2 satellites. It utilizes a 2.4 meter antenna and a commercial common imagery processor to process imagery into standard formats (i.e. NITF and SICD). Do not underestimate the remote…

View On WordPress
0 notes
Text
SpaceX’s Falcon 9 booster flies for 9th time as Starlink constellation grows
The Starlink v1.0 L21 mission used a flight-proven Falcon 9 Block 5 booster, B1051-9 — with the “-9” signifying the stage’s ninth flight. This was the first time a booster was used on nine launches, making B1051 the “fleet-leader” of SpaceX’s active Falcon cores. With this milestone, SpaceX will be nearing its goal of launching and landing a booster at least 10 times.
B1051 is the second oldest active booster in the fleet. It made its debut on the uncrewed SpaceX Demo-1 mission from KSC in March 2019. It then supported the RADARSAT Constellation mission from Vandenberg, California, in June 2019.
B1051 later returned to Florida and supported the Starlink v1.0 L3 mission in January 2020, the Starlink v1.0 L6 mission in April 2020, the Starlink v1.0 L9 rideshare mission in August 2020, and the Starlink v1.0 L13 mission in October 2020. It then supported the SXM-7 mission in December 2020, the first time a seven times flown booster launched a commercial mission. เกมสล็อต
0 notes
Text
SpaceX установило очередной рекорд многоразовости РН Falcon 9, выполнив семнадцатую миссию Starlink
#SpaceX установило очередной #рекорд многоразовости РН #Falcon9, выполнив семнадцатую миссию #Starlink
Три рекорда семнадцатой миссии Starlink Сегодня SpaceX осуществило второй старт с начала этого года, и семнадцатый старт по программе развёртывания сети спутников Starlink. Бустер Falcon 9 B1051, использовавшийся в этой миссии, ранее осуществил семь миссий: четыре миссии Starlink, миссия Crew Dragon Demo-1 на Международную космическую станцию в марте 2019 года, запуск RADARSAT в июне 2019…

View On WordPress
0 notes
Text
Juniper Publishers- Open Access Journal of Environmental Sciences & Natural Resources
Natural Resource Mapping Using Landsat and Lidar towards Identifying Digital Elevation, Digital Surface and Canopy Height Models
Authored by Abdul Qayum
Abstract
The evaluation of the natural resource plays a decisive role in management and sustainable developmental planning. The study aims to generate natural resource based maps of rural areas of the USA using remote sensing datasets such as Landsat and LiDAR to analyze generated natural resources for developing digital elevation (DEM) and canopy height models (CHMs). Natural resource maps were generated using Landsat image of the year 2010. The area statistics reveal that the tree class percent (23.21 %) was the second highest after fallow land class (60.44 %) whereas shrubs and grass/agriculture was 6.59 % and 6.47 %, respectively. Later, LiDAR datasets for the same time were used to generate DEM/surface models (DSM) and CHMs. Spatial analysis was done to attempt hypothetical queries pertaining to resource management. Further, all the generated datasets from different sources including slope map, drainage map etc can be integrated in GIS domain for effective decision making. Coarse resolution Landsat data can be effectively used to monitor natural resources up to micro level if used skillfully in conjugation with rectified images. LiDAR datasets have huge potential to generate highly accurate DEM, DSM and CHMs. Such accurate data will be informative for qualitative and quantitative assessment of various natural resources.
Keywords: Canopy Height model; DEM; DSM; Landsat; LiDAR; Natural Resource Map
Introduction
The natural resources signifying available land, water and forest have been serving the mankind by providing valuable services like food items, fuel and fodder, important medicines, regulating the air and water currents, protecting the soil and its components etc. FAO [1]. Moreover still the rural livelihood in every country is dependent on these natural resources and its condition for their sustainability and livelihood World Bank [2]. The major factors like population growth agriculture expansion and increased human well-being have been at the cost of forest depletion. The exponential increase in human population from seven billion to nine billion in the coming years has increased pressure on natural resources which are depleting at a faster rate than expected Millennium Ecosystem Assessment [3]. Further, the analysis of Ivanova et al. [4] has confirmed that some of the ecosystem services are at stake. We may soon face water scarcity, flooding of cities (because of degradation of wetlands) and increase in temperatures (because of overgrazing and overexploitation of forest trees).
Sustainable use of the natural resources would prevent further loss. As defined by Norwegian Ministry for the Environment [5] Sustainability means "the use of services and related products which respond to essential needs and ensure a better quality of life while minimizing the utilization of natural resources and toxic materials as well as control the emissions of waste and pollutants over the life-cycle so as not to jeopardize/ threaten the needs of future generations". Thus, a detailed management plan for the natural resource is needed which would identify clear objectives, evaluate existing natural resources and its uses to develop long term plans. To achieve this, a reliable geo-information database is required to prepare action plans for sustainable development at micro level. Natural resources assessment can be made using these parameters which would help the forest managers in multiple ways Hudak et al. [6]. These days satellite remote sensing data like LANDSAT, LiDAR etc are available for free download, which open up the opportunity for many researchers, government authority, and stakeholders for creation of data base on natural resources Kennaway et al. [7].
The advances in satellite remote sensing technology since few decades have been successful in providing data for detailed inventory and mapping of natural resources at large scale Kasturirangan et al. [8]. The applications of satellite remote sensing data have either been images from passive optical sensors for example aerial photography and Landsat Thematic Mapper Goward & Williams [9], or lesser known active radar sensors such as RADARSAT Waring et al. [10]. Light Detection and Ranging (LiDAR) has drawn tremendous attention among different natural resource managers and planners Hudak et al. [6]. LiDAR data provides the required resolution and detail of forests, rangelands, watersheds, roads, and other valued resources to improve management related decision supporting system Falkowski et al. [11]. LiDAR characterizations of ground and vegetation attributes are consistently accurate, highlighting its potential for various applications Deekshatulu [12]. LiDAR uses an active illumination sensor and can be collected in day or night. Besides, LiDAR data is free of any geometric distortions like side-looking radar. The capacity of LiDAR to capture multiple returns and to penetrate the ground even in dense forested areas opens the opportunity for the generation of a digital terrain model (DTM) and facilitates the estimation of variables Lim et al. [13], Hyyppa et al. [7]. Natural resource inventory at national or regional level can tap the potential of LiDAR data.
The advantages of LiDAR data over traditional remote sensing data is that data can be collected rapidly with greater accuracy (up to the centimeter), surface data has a higher sample density which helps in improving the results for various applications. In a forest, it can collect elevation data where photogrammetry fails to exhibit the accurate terrain surface due to the dense tree canopy cover. It adds another dimension that is "z" dimension to the spatial analysis and also increases the accuracy of biophysical parameters. Its sensors provide data regarding spatial distribution of plant canopies, sub canopy, vegetation height cover and canopy structure Lefsky et al. [14]. A Digital Surface Model (DSM) and the correspondent Digital Elevation Model (DEM) can be used in combination to retrieve by differencing the commonly known Canopy Height Model (CHM). It is a measure of the trees height over the area of interest as in case of woody vegetation or forest. CHM can be utilized to assess many fundamental forest parameters such as tree biomass and volume. Thus is gaining importance in identifying canopy height variability and detecting tree crowns Jakubowski et al. [15], Qin et al. [16].Other features pertaining to forest structure like canopy height, basal area, timber volume and biomass have all been successfully derived from LiDAR datasets Drake et al. [17], Drake et al. [18], Hyde et al. [19], Lefsky et al. [20], Magnussen & Boudewyn [21], Means et al. [22], Naesset [23], Nelson [24], Nilsson [25], Peterson [26], Asner et al. [27].
The LiDAR data can be used in conjunction with other open source data such as Google Earth. The pros of using Google Earth is that it provides freely available high resolution satellite data, which is useful for visual interpretation and delineation of various features Bey et al. [28], Malarvizhi et al. [29]. It also facilitates creation of vector layer for the area of interest and further exporting it in GIS domain can be used as a base map. It provides information (images of different time periods) for temporal analysis and one can also assess the history of a place Bey et al. [28]. All these provide insight about changes taking place with regard to natural resources. The cons of Google Earth are that one cannot obtain the original multispectral band data which limits the image classification analysis and quantification of data. The present study has attempted to generate base maps using a combination of Google Earth, Landsat and other thematic maps and to assess their feasibility to evaluate LiDAR dataset. The study area chosen was a rural area segment of the United States of America (USA) based upon the availability of both Landsat and LiDAR data. Different themes such as DSMs DEM and canopy height model (CHM) were generated using LiDAR dataset.
The Study Area
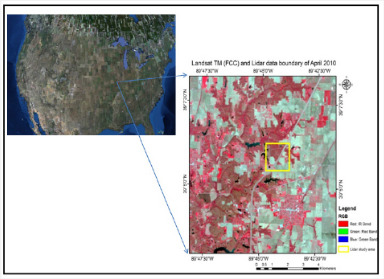
The study area was chosen based upon the availability of free download of LiDAR and Landsat remote sensing data for the same area of interest. It is located in rural USA, which is mostly dominated by trees, shrubs, wetlands (ponds, lakes, other water bodies) and agriculture. The geographical coordinates of the study area ranges from its Latitude 39°02'43.37"N to 39°08'47.71"N and Longitude 89°40'42.71"W to 89°49'07.83"W, whereas total geographical area is 136,81.4 Ha and its elevation ranges from 131 m to 236 m from the MSL (Figure 1).
Material and Methodology
Satellite data acquisition and preprocessing
The satellite remote sensing data of Landsat (April, 2010) and LiDAR (April, 2010) were downloaded from the USGS Earth explorer portal. The Landsat data was radio metrically and geometrically corrected and was devoid of cloud cover and line drop outs. The image processing, interpretation and delineation of different classes of natural resources was done in image processing software ERDAS Imagine, which is designed especially for remote sensing (Figure 2).
LiDAR data was analyzed in ArcGIS (developed by Environmental Systems Research Institute (ESRI)) platform, which is software used to create, display and analyze large geospatial data. Prior to accessing the images from the Google Earth, the study area shape file was created in ArcGIS and was divided into nine grids which were converted to *kmz file. This file was opened into Google Earth for visualizing. Each of the nine grids of Google Earth images were projected and mosaic ked in ERDAS Imagine. This mosaic ked file was used for creating the base map. The detailed schematic flowchart was formulated (Figure 2).
Image Processing and Classification
Landsat data was further subjected to image enhancement and classification to delineate various natural resource classes. For each class, (in false colour composite-FCC) some 10-15 clearly visible training sets were given, which were uniformly distributed throughout the scene. Supervised classification was performed using maximum likelihood algorithm. Seven natural resource classes namely trees, shrub, grassland/agriculture, settlement, water, current fallow and fallow were delineated in the study area. Anderson classification scheme (level I) was achieved by identifying seven natural resource categories in the Landsat image Anderson et al. [30].
Image accuracy assessment
Accuracy assessment determines the quality of the classified image. The accuracy assessment was executed by generating random points for each class in the classified dataset. The points were assigned to the respective classes based on the literature sources. The error matrix was generated and the overall classification accuracy and kappa statistics were calculated.
Base map preparation from the Google Earth
The study area vector (shape) file was divided into nine grids (3x3) in ArcGIS. The Shape file was converted into kmz file. This file was then opened in Google Earth containing all the nine grids. Each Google Earth image was rectified and mosaiced in ERDAS imagine. These mosaic images were taken as the base map. The advantage being that all features were distinct and can be visually interpreted and assist in further analysis.
LiDAR Data Analysis
LAS is the file format for LiDAR point clouds and the maiden step was to add LAS tiles into an LASD dataset, which was done in Arc Catalog by selecting NEW/LAS Dataset. By using LAS data set properties dialogue box, statistics can be created by clicking update button. This will provide a very useful overview on the point cloud data. The points can be viewed as Elevation values. Downloaded LiDAR data set were evaluated to run a quality assessment/ quality control (QA/QC) process on the data to ensure the data meets the delivery specifications. Such a process can also highlight the areas where the point density falls below a threshold level or data points falling below ground level, as well as the quality of the point classification.
All these aspects can affect the output data from any LiDAR processing undertaken. ArcGIS has quality control features for LiDAR point data within the LAS Point Statistics as Raster tool was used to evaluate the quality of data. The datasets in the study has no major issues as highlighted by the QA/QC process then the next step was to generate outputs in form of Digital Elevation Model (DEM) Digital Surface Model (DSM) Canopy Height Model (CHM), Contours and Slope etc. DEM and DSM can be created using LAS Dataset to Raster tool setting the DEM and DSM parameters; respectively. A critical element in natural resource management is the ability to measure tree heights. CHM is derived by subtracting the DEM from the DSM and can be done using the minus function of LIDAR Processing of Arc Toolbox.
Spatial Analysis over Datasets
Once different spatial data sets generated from data source rectified images can be used for spatial analysis quarries as they retain its geometry and projection. To understand this, an example may be taken as if a resource manager is interested in knowing the answer of following questions:
a. Simple query: Maps and area of trees growing on more than 10% slope; this slope is vulnerable due to its steepness towards erosion and needs special attention as regards soil and water conservation. This query needs two layers of natural resource maps and a slope map.
b. Complex query: Maps and area of trees growing in more than 10% slope and is vicinity of 300 m of road; this slope is more vulnerable due to its steepness towards soil erosion as well as accessibility of humans, high priority is required towards soil and water conservation practices. This query needs three layers of natural resource, slope and road buffer of 300 m maps.
Go to
Results and Discussion
Accuracy assessment of Natural resource map
The accuracy assessment was performed in classified images generated from Landsat images for the year 2010. The overall classification accuracy was 88% whereas kappa statistics was 0.80.
Base map preparation
The base maps provide information regarding various land features with considerable accuracy to give a lead to further analysis and interpretation. In this case, the downloaded, rectified and mosaic ked images of Google Earth acted as the base map as all the different features were quite distinct (Figure 3). Roads were digitized on it, which guided in supervised classification process for delineating various natural resource classes for the Landsat data (Figure 3).
Natural resource map class analysis
A natural resource map shows the expanse of natural resources found on and in the surface of the Earth. Based on the classification of Landsat data, natural resource map were generated for the study area, which was dominated by class trees, shrubs, water, grass/ agriculture, current fallow, fallow and settlement (Figure 4).
The Landsat TM data was visually interpreted based on the appearance of these classes in terms of colour and texture. They were used as signature (training sets) required for supervised classification of the dataset. A brief description of various features is given in (Table 1). The area and percent of each class was also calculated and the trees class percent was found to be the second highest after fallow land percent whereas shrub and grass/agriculture percent was 6.59 and 6.47, respectively (Table 2 & Figure 5).
LiDAR Data Analysis
The evaluation of QA/QC of LiDAR data was performed to check point density falling below a threshold level or not and it was found satisfactory (Figure 6).
DEM generation
In order to create DEM, the parameters need to be set on the LAS Dataset then to Raster tool. LAS require classification codes and returns to be defined. It varies depending on the product being derived. For a DEM, in the Layer Properties dialogue box Filter tab, the Classification Code should be set to 2, Ground, and the Returns set to 'ALL', and the DEM may be generated (Figure7). The contour (Figure-8) and slope map (Figure 9) were also generated based on this DEM (Figures 7-9).
DSM generation
Similar steps were followed to create DSM except that the LAS Dataset parameters in the Layer Properties dialogue box Filter tab were set to the classification code as set to 'All Classes', except 7 Noise and Returns set to 'First of Many; Single Return and Return 1'. Consequently, the DSM can be obtained (Figure 10).
Canopy Height Model generation
LiDAR technology has the ability to generate tree heights which is a critical element in natural resource management. Canopy model was derived by subtracting the DEM from the DSM (Figure 11). CHM gradient varies from 0 to 30 m was found (Figure 12). The area with respect to canopy height was also estimated (Figure 13). Furthermore, it was also estimated that the canopy height 22m occupied the maximum area (Figures 11-13).
Spatial Analysis over datasets
For answering queries, road buffer of 300 m was created from road map whereas slope map was grouped into two classes (one greater than 10% and other less than equal to 10%) and classified natural resource map was grouped into two classes (one tree class and other into other than tree class). The maps and area statistics was prepared based on spatial quarry as per the requirement from the resource manager (Figure 14).
Conclusion
The above study has shown that the prospects of mapping natural resource based upon Landsat images, LIDAR data sets and Google map in conjugation as reference map are better than the traditional remote sensing analysis. It has enhanced the mapping ability with more accuracy. The responses of LiDAR address a detailed measurement of all surfaces within a canopy volume which includes foliage, branches and stems. It has the capacity to accurately analyze the forest variables at landscape level and has been found to show more precise and cost effective measurements as compared to the traditional field related studies. At the local level that is at village level, such data can be harnessed for the betterment of rural people. This type of analysis can be incorporated in the making of the Natural Resources Management Plan (NRMP), which requires to the study the natural resource extent, problems and issues and recommending appropriate measures. Utilizing LiDAR data in an appropriate and judicious manner would open an opportunity for sustainable forest management practices by enhancing the existing knowledge and extending the expertise amongst the forest management community.
For more Open Access Journals in Juniper Publishers please click on: https://juniperpublishers.business.site/
For more articles in Open Access Journal of Environmental Sciences & Natural Resources please click on: https://juniperpublishers.com/ijesnr/
To know more about Open Access Journals Publishers
To read more…Fulltext please click on: https://juniperpublishers.com/ijesnr/IJESNR.MS.ID.555580.php
#Juniper Publishers#Juniper Publishers Group#Juniper Publishers in USA#Ecological Validity#Human Ecology#Waste Management and Disposal#Soil Science
0 notes
Text
SpaceX's 2019 Adventure (Video)

In this article, we will take a gander at a short audit of the assignments that SpaceX, the space organization Elon Musk accepted as CEO, during 2019. SpaceX, Elon Musk's space look into organization, has attempted huge advancement in its endeavors to reuse space rockets in the course of recent years. 2019 was per year in which we saw the great consequences of these endeavors. During the year, the organization propelled an aggregate of 13 missions and effectively propelled its rockets in 15 out of 16 preliminaries. The organization's mind boggling progress all through 2019 was aggregated by a YouTube channel, kan STARSNOO OO. In a short sci-fi taste, this video gives us a look at the most significant purposes of the missions performed by SpaceX all through 2019. We should take a gander at this video first, at that point we should quickly discuss SpaceX's 2019 experience. Iridium-8: The video begins with SpaceX's first strategic the new year. The principal crucial 2019 was the last strategic the two-year satellite venture, and the rocket was propelled from the Vandenberg Air Force Base in California to bring 10 satellites into space. The task included 75 satellites, 66 of which are operational, for quicker correspondence. https://youtu.be/JdzHkA4hSQU Nusantara Satu: The weights of this strategic, which a trio of rocket were moved into space, incorporated Indonesia's correspondences satellite, a little trial satellite to be utilized for military purposes, and a unique Israeli-claimed satellite to head out to the Moon. Group Dragon Demo-1: This flight was directed unmanned to test SpaceX's Dragon 2 container, and the case's security was tried all through the mission. Arabsat 6A: This was the primary business trip of Falcon Heavy, the world's most dominant operational rocket. Group Dragon Explosion: The test, which flopped in April, was viral on the Internet. SpaceX then indicated the hole in the contact as the guilty party. CRS-17: Launched with the Falcon 9 rocket, the CRS-17 was a business acquisition administration to the International Space Station with the Dragon 1 container. Starlink v0.9: This strategic, of the pioneers of web access from space, included the dispatch of 60 Starlink satellites. Radarsat Constellation: Canada's Radarsat Constellation strategic to convey 3 surface perception satellites into space. STP-2: With this crucial, Heavy was focused to send two dozen satellites into space. K This will be our most testing flight, Mus Musk said. CRS-18: SpaceX's eighteenth trip to the International Space Station. The Dragon case utilized in this flight conveyed near 3 tons of material and intended to test the limit of the Starship. AMOS-17: A Falcon 9 rocket was utilized for the third time on an official strategic. The rocket effectively moved Israel's Amos-17 satellite, which gauged in excess of 6 tons, into space. Starlink 1: Two delayed missions have at long last been effectively finished. 60 satellites were propelled into space with 9 Falcon rockets. Starship Boca Chica Failure: The Starship MK1 model planned by SpaceX for space ventures detonated during the weight test at the Boca Chica test site in Texas. CRS-19: The last CRS crucial 2019. Inside the extent of the assignment load was moved to ISS. The Dragon case, likewise utilized in the mission, went into space for the third time. JCSAT-18/Kacific1: The departure from Cape Canaveral Air Force Station in Florida expected to take the JCSAT-18/Kacific-1 business correspondence satellite into space. This was a concise arrangement of the undertakings that SpaceX had succeeded or fizzled during 2019. The organization has left a positive impression with its achievement lately, and it appears that it will proceed with its accomplishment in the coming days. Read the full article
0 notes
Text
SpaceX sets booster reuse milestone on Starlink launch
https://sciencespies.com/space/spacex-sets-booster-reuse-milestone-on-starlink-launch/
SpaceX sets booster reuse milestone on Starlink launch

WASHINGTON — SpaceX launched a set of Starlink satellites May 9 on a Falcon 9 whose first stage was making its tenth flight, a long-awaited goal in the company’s reusability efforts.
The Falcon 9 lifted off from Space Launch Complex 40 at Cape Canaveral Space Force Station at 2:42 a.m. Eastern. The rocket’s upper stage deployed its payload of 60 Starlink satellites into low Earth orbit nearly 65 minutes later.
The launch, the third in less than two weeks for SpaceX, brings the total number of Starlink satellites in orbit to more than 1,550. The company is gradually expanding its beta test program for the broadband internet service as the constellation grows. SpaceX noted on the launch webcast that it opened up that beta test program in the last week to people in Austria and France.
The launch itself was noteworthy as it marked the first time a Falcon 9 first stage had flown 10 times. The booster first launched the Demo-1 commercial crew test flight in March 2019. It later launched the Radarsat Constellation Mission, the SXM-7 satellite for SiriusXM and six Starlink missions, most recently March 14, before this launch.
SpaceX had long identified 10 flights as a goal for Falcon 9 reuse in order to justify the significant investment the company made into reusability. In recent months, though, company executives have suggested that the booster can fly more than 10 times.
“There doesn’t seem to be any obvious limit to the reusability of the vehicle,” Elon Musk, chief executive of SpaceX, said at an April 23 NASA press conference after the Crew-2 launch.
The company has been using its own Starlink missions to push the boundaries of booster reuse. That has uncovered issues, such as a February launch where the Starlink payload reached orbit but the booster failed to land. That booster was making its sixth flight, but some engine components, such as “boots” or covers around the engines, were life leaders. One of those covers had a hole that allowed hot gas from the engine exhaust get into other parts of the engine, triggering a shutdown that prevented the stage from landing.
“We do intend to fly the Falcon 9 booster until we see some kind of a failure with the Starlink missions, have that be a life-leader,” Musk said at the briefing, noting at the time that a tenth flight of a booster was upcoming. “We’re learning a lot of about reusability. It’s a hard problem for rockets.”
SpaceX has not disclosed whether it will attempt to use this booster for an eleventh launch, but the successful landing at least preserves that possibility. “This booster gets to live again,” Michael Andrews, the host of the SpaceX launch webcast, said shortly after the landing.
#Space
0 notes
Text
Clearwater founder John Risley part of group repatriating Canadarm company in $1B deal
A Toronto-based investment firm has signed a $1-billion deal to buy the Canadian space technology company behind Radarsat Earth-observation satellites and the Canadarm robotic mechanisms on the International Space Station.
from CBC | Nova Scotia News https://ift.tt/2ZAIZ3X
0 notes
Text
35th Anniversary and User Group Meeting
November 20/2017
For the agenda, names of speakers and all presentations, see this link: www.pcigeomatics.com/UGM2017
November 15th, 2017 marked a special occasion for PCI Geomatics staff, partners, customers and the management team - this event celebrated PCI’s 35th anniversary.
Recognizing the important role our customers have played in pushing PCI forward to continue to innovate, the 35th anniversary was held in conjunction with a User Group Meeting. The event was held at Ottawa’s new innovation hub, Invest Ottawa at Bayview Yards.
A key theme of the event was big data and how the geospatial industry is evolving in response to this important trend. PCI outlined how the company is poised to provide solutions to help users transition from the changing paradigm of downloading images, processing them, and then publishing results. Rigorous data correction and alignment algorithms, cloud based deployments and powerful analytical workflows can be developed and deployed through PCI’s platform which includes not only desktop processing capability (Geomatica), but also large volume production systems (GXL). In fact, PCI Geomatics is actively developing Analysis Ready Data (ARD) tools for ingestion into geospatial data cubes and furthermore, allowing end users to conduct advanced analyses through these types of platforms.
New capabilities presented by PCI Geomatics
PCI’s President and CEO, Terry Moloney, kicked off the event by welcoming users to the event, and highlighting the important work that they do with remote sensing and GIS technology, and how it helps alleviate impacts related to climate change and disasters.

Technical staff then presented three new important capabilities that have been recently developed by PCI Geomatics.
InSAR – Monitoring subtle deformation A validation study done with MDA using RADARSAT-2 imagery was shown, where Geomatica’s InSAR module attained very strong agreement with geophysical models of expected deformation, as well as measured deformation using other InSAR processing projects.

Above: Corner reflectors installed by MDA in Cold Lake, Alberta along an Oil Sands producing pipeline. The geophysical model and measured deformation showed high agreement for all measurements.
Digital Elevation Model Extraction Impressive results were shown from high resolution satellite as well as aerial stereo imagery where PCI has implemented semi-global matching techniques for extracting elevation. This technique yields high detail and can be used on tri-stereo pairs, push broom scanners (ADS 40/80/100) and digital frame cameras (e.g. UltraCam).

Above: Tri-stereo merging and elevation model extraction from ADS aerial dataset, at 10-centimeter resolution.
Object Analyst A live demonstration showcased the ease with which Object Based Image Analysis can now be done within Geomatica. A level 1 Anderson classification was generated using available RGB and Infrared channels, as well as elevation information over the area of interest. Using the Geomatica platform, integrating multiple sources of information to assist with the classification was easily accomplished.

Above: Land use and land cover classification extracted from high resolution aerial imagery using Object Analyst.
User Contributed Presentations
Presentations were provided from private sector (EFFIGIS) and Government (Agriculture and Agri-Food Canada – AAFC and the Canada Centre for Mapping and Earth Observation – CCMEO).
Mapping Natural Habitats using Polarimetric SAR Imagery, Effigis Presented by Mr. Thuy Nguyen Xuan Link to PPT
Thuy provided an overview of how EFFIGIS has used RADARSAT-2 polarimetric data, which was processed in part through Geomatica, to map natural habitats through object based image classification. The optimal combination demonstrated included the use of both optical and SAR to attain the highest levels of accuracy.

Using Earth Observation for Operational Agricultural Monitoring, AAFCs Presented by Dr. Andrew Davidson Link to PPT
Andrew discussed how Canada is leading global efforts to make operational agricultural geospatial information products that are used to monitor climate change impacts through research based techniques.

Monitoring Canada’s Dynamic Water Resources, CCMEO Presented by Dr. Brian Brisco Link to PPT
Brian presented on the innovative use of InSAR techniques to monitor Canada’s dynamic natural water systems. Using Coherent Change Detection (CCD), accurate water level measurements can be derived, making wetlands an important and suitable ecosystem that can benefit from this unique InSAR processing approach.

Closing Keynote
Providing the closing keynote address was the Director General of the Canada Centre for Mapping and Earth Observation (CCMEO), Prashant Shukle. Prashant noted the important role that PCI Geomatics has played in contributing to Canadian scientists’ ability to complete their work on daily basis using software and tools that have been developed over its 35 year history. He noted that the company’s past and present leadership and management has made it a valuable Canadian asset that should be further leveraged to conduct leading and important global science and operational work. He concluded his remarks by emphasizing that despite much recent focus spent on artificial intelligence and other new technology, the true path for Canada to establish a leadership position (as it has done in the past), is through science based research and its operational application.

Celebratory lunch and networking opportunity
Following the technical component of the meeting, a networking lunch was held where participants had the opportunity to discuss ongoing work and where they could potentially collaborate with each other and PCI Geomatics.

The day was capped off with an official cake cutting, noting the 35th anniversary.
PCI Geomatics wishes to thank all who attended the event, and looks forward to continuing the conversation through the many communications channels available.

Happy 35th PCI Geomatics!

1 note
·
View note
Text
Gift Space Relate Merchandise to Let Your Kid Reach Skyhigh
At some point, every kid dreams of becoming an astronaut and travel not just up to the moon but around the universe as well. To ignite the light of achieving dreams and becoming an astronaut one day, gift your toddler space store products. Even the tiniest hamper related to NASA or space brings a wide smile on their faces. Here we have mentioned Kennedy space shop products that one can think of buying for their children.

NASA Medallions - Medallions are not common. As they are unique and limited, Medallions are precious gifts. There are Nasa 60th Anniversary Medallion with COA card, Apollo 11 Robbins Commemorative Silver Plated medallion, Moon landing silver mint coin cards, and more products available online.
NASA Logo pins, patches, and Decals - Decorate your kids’ rooms with Space stickers and let them roam in their imaginary world of moon and stars. Shop for space store products like NASA 60th Anniversary logo sticker, handbook, lapel pin, logo pin, boot print pin, magnets, and pennant. Additionally, there are keychains and playing cards with which kids can play in spare time.
NASA Caps, Hats, and Ties - Buy Space and NASA themed caps and ties for your children, perfect gifts for any space lover. From visor to tucker cap to flex-fit cap, select one of your choices. When ties are on your mind, there are options like Moon Walk Tie, International Space Station and Solar System tie.
NASA Frame Sets - No other gift would be more surprising than NASA pin sets and collectible frames. One can decorate the living room with collectibles like the Lunar Meteorite frame, Moon Landing Footprint frame, Framed Apollo Pin Set, Columbia Space Shuttle Thermal Tile, and more.
SPACEX Apparel - If you want kids to search and learn more about space missions, gift them SPACEX apparel. One can shop for caps, t-shirts, and patches having logos of Dragon, SPACEX FALCON, and SPACEX STARLINK.
SPACEX Products - Give water to the seed of your child’s aspirations by giving SPACEX products as presents. Buy them Space store patches of AMOS-17 mission, STP-2 mission, Starlink mission, CRS 17 mission, RADARSAT mission, ARABSAT-6A mission, DEMO-1 mission, NUSANTARA SATU mission, and more. Additionally, there are covers like SPACEX CREW DEMO-1 cover, SPACEX CREW DEMO-1 ISS RETURN cover, and SPACEX CRS- 16 FLIGHT RETURN cover to shop for.
Proach Models - Miniature and hand-made models of space models are gifts that your child will keep with him or her forever. One can add custom-built replicas and rich in detail space models of Lunar Module Commemorative, Apollo 11 Commemorative, Gemini Spacecraft, Apollo Command, Mercury-Atlas, and more to the collectible lists.
Pick whatever your child would love to have from Kennedy Space Shop and help them dream big.
0 notes
Text
Possibilities of Using Remote Sensing in Archaeological Research in Bengal Delta in Bangladesh - A Human-Influenced Alluvial Terrain- Juniper Publishers

Abstract
Bangladesh, an alluvial country lying in an active tectonic region of the world, has a huge population and rich archaeological heritage. The fluvio-deltaic landforms of the country are continually changing due to geologic processes, natural hazards and anthropogenic activities. In such an actively changing condition it is difficult to preserve and to detect the archaeological sites. From archaeological point of view, it is also important to understand the relationship between the human settlements and migration, and the changing landforms. Remote Sensing can help both to explore the archaeological sites and to understand the relationship. Advantages like multi-spectral, multi-resolution and multi-temporal capabilities of remote sensing can be taken to solve special problems. Over the last few decades, remote sensing technology has tremendously developed, and area of application has also widened. Possibilities of use of this technique in the context of Bengal Delta in Bangladesh have been evaluated. Use of remote sensing data would increase the efficiency of archaeological discovery/research through saving time and money in a country having intense anthropogenic activity and continuously changing alluvial landforms.
Keywords: Remote Sensing; Archaeology; Alluvial Terrain; Anthropogenic Influence; Geoarchaeology; Bengal Delta; Bangladesh
Abbrevations: AMSL: Above Mean Sea Level; DEM: Digital Elevation Model; UAVs: Unmanned Aerial Vehicles; VHR: Very High Resolution; NIR: Near Infrared Red; GPR: Ground Penetrating Radar; MIR: Mid Infrared; TIR: Thermal Infrared; MS: Multi-Spectral
Introduction
In archaeology, research design involves selecting a region or site for survey, excavation and recovering data. Excavation is costly and is increasingly seen as last resort [1]. Remote sensing gives a synoptic view of the surveying sites, frequently, and at low cost, of often inaccessible areas, saving time and money. In favourable circumstances and with the efficiency of the interpreter, it can record details of the buried sites revealed by discolouration in the overlying soil or vegetation [2]. Three-dimensional effect from the terrain can be achieved with the help of stereo pair aerial photographs. However, optimum utilization of remote sensing technology depends on clear understanding of the interaction among electromagnetic spectrum, atmosphere and terrain characteristics.
Bangladesh is covered with Tertiary folded sedimentary rocks (12%), Pleistocene soil (8%) and Holocene alluvial sediments (80%). Moreover, it is in a tectonically active region of the world. These sediments, consisting mainly of unconsolidated sand, silt and clay in varying amounts, come from different geological environments and deposit in different geomorphological conditions. Besides these, the country is tackling anthropogenic activities where population become double within 40 years. Climate is another important factor, which has relevance in shaping of the earth’s surface because the processes that act upon the surface material are different in different climate zones [3]. Bangladesh enjoys a tropical monsoon climate [4]. Mean annual rainfall is 1250 mm in the centre-west, more than 2500mm in the north-west and near the coast and exceeds 5000 mm in the north-east [5]. Mean temperature is about 25 °C, and that ranges from 18 °C to 30 °C in winter and summer respectively. Wind is generally light, but it goes 50-100 km/hr or more during pre-monsoon or cyclones. Evaporation is about 50-75, 100-175 and 100-125 mm/month in winter, pre-monsoon and monsoon respectively.
Application of remote sensing in Bangladesh geology started during the middle of 1950s [6]. For practical reasons aerial photographs were used for geological mapping till the availability of satellite remote sensing data, which is continuing. Scientists of the country have been working with aerial photography, Landsat (MSS, TM, ETM+), SPOT, IRS, Radarsat, JERS-1, Lidar, CORONA satellite photograph, RapidEye, Pleiades data in different fields of geology [6]. Other fields of application include forestry, soil, environment, agriculture, water resources, natural hazards etc. Application in archaeology remains only within geoarchaeological studies.
In the following paragraphs archaeological heritage [7- 9] and fundamentals of geology of the country have briefly been described. At the later part basics of remote sensing with information extraction procedures and requirements for archaeological research are discussed. Current status of remote sensing application in archaeology in the country and elsewhere has been reviewed. Results of few such applications and possibilities of future applications of remote sensing in the archaeological research in Bangladesh are discussed.
Archaeological Heritage of Bangladesh
Majority of the landforms of Bangladesh are originated from fluvial and deltaic processes forming the largest delta of the world. Quaternary sediments and soils cover about 90% area of the country. Among the four favoured general environments for human habitation two -– alluvial and coastal environments [10] exist in Bangladesh. It has huge networks of large and small rivers with their fertile floodplain replenished with sediments and nutrients during annual floods. The floodplain provides food, drinking water and water for irrigation; rivers provide communication networks, sediments are sources of important raw material, gravels are used for constructions. The country has a vast coastal plain that also favours for food, communication for trade and others. All these favourable conditions attracted humans since long. This vast alluvial land holds the settlements having its own people and as well as people from different countries and nations having different ethnicity, religion, race, language and culture from pre-historic age till to date.
However, during the second half of the first millennium, ancient Bengal including present-day Bangladesh, West Bengal and parts of Assam and Bihar of India were roughly divided into several political divisions which consisted of Pundra or Varendra (North Bengal), Rahr (West Bengal and adjacent parts of Bihar), Kamrupa or Anga (Assam), Vanga or Harikel (Southern Bengal) and Samatata (South-eastern and eastern Bengal). However, Dinajpur, Rajshahi and Bogra region (Figure 1) of Bangladesh have signs of the Early Historic settlement that can be assigned to the 3rd century BC [7], although the history of the period between the fall of the Mauryan Empire (2nd century BC) and the rise of the Gupta rule (4th century AD) is unclear. The Pal dynasty ruled Bengal from ~781 to 1124 AD of which Somapura Mahavihara is one of the important evidences. Later Sen Empire ruled during 1158 – 1205 AD. Muslim era started in 1204, Lakhnauti in Dinajpur was conquered. The empire, centring Lakhnauti, was supposedly stretched to the Padma/Ganges River in the south, Rangpur and Dinajpur (Devkot) in the north, Bihar (India) in the west, and the rivers of Tista, Brahmaputra and Karatoya in the east. Later in 1338 AD independent sultanate was established in Bengal which remained for 200 years. Afterwards Delhi-based Mughal rule started that continued till the death of Aurangzeb in 1707 and afterwards became weak gradually. Bengal was ruled by independent rulers till 1757 and British ruled from 1757 to 1947 followed by Pakistani regime of 1947-1971. Afterwards Bangladesh emerged as an independent nation in 1971.
Prehistoric Settlements (Neolithic Settlements)
Archaeologists identified several potential paleolithic, mesolithic and neolothic sites in Bangladesh. All the reported locations of pre-historic archaeological records are confined to the Pleistocene lateritic terraces of Lalmai Hills of Cumilla and uplands of Narshingdi, Sylhet, Habiganj, Rangamati and Chattagram districts [9]. Discovered materials are pre-historic artifacts made mainly from silicified or fossil wood or fossil. These areas lie mostly in the north-eastern and eastern parts of the country that are geologically occupied by hills of Tertiary sedimentary rocks, except those of Cumilla and Narshingdi which are uplifted terraces of Pleistocene time (Figure 1).
Chalcolithic Settlements
Chalcolithic cultures are evidenced by Black-and-Red ware and pit-dwelling were discovered in Wari-Bateshwar area of Narshingdi district, area lies on the uplifted terrace of Pleistocene. Hearths and wells have also been discovered there. The Iron Age began in the middle of the Chalcolithic age (1200 BC) and lasted until the onset of the early historic period (400 BC). In Bangladesh, traces of the settlements belonging to the later part of the Iron Age have been found in Mahasthangarh of Bogura district (Figure 1). Though the iron tools were made in the primitive techniques from 1200 BC to 700 BC, advanced techniques were adopted after 700 BC onwards. Exactly from this period, the human settlements in Bengal started undergoing qualitative changes along with the other parts of the subcontinent. The use of iron played a significant role in the economic, social, cultural and political life. It is consistent to mention here that the Megalithic culture is a specialized form of the Iron Age [7].
Megalithic Culture
The remains of Megalithic culture are found in various countries of Europe, Africa and Asia. In the Indian subcontinent megalithic culture started in Neolithic period, however, it flourished during the Iron Age. In Bangladesh, evidences of megalithic culture are found in Jaintapur (Figure 1) of Sylhet district, which includes upright stone (menhir) and slab stone (dolmen) horizontally resting on several stone posts [9]. This area lies in the north-eastern hilly region of the country and occupied by younger Tertiary sedimentary rocks. Brief descriptions of few important archaeological sites/places of Bangladesh are given below.
Important Historical-Period Settlements
Wari-Bateshwar, Narshingdi The Wari-Bateshwar (Figure 1) region in Narshingdi, Bangladesh is the site of an ancient fort city dating back to 450 BCE. The 2500-year-old ruins lie near the Old Brahmaputra River. The sites are located on the flat-topped surface of the Madhupur Tract [11] underlain by Madhupur clay residuum [12]. Wari-Bateshwar is the rich, well planned, ancient emporium (a commercial city) “Sounagora”, mentioned by Greek geographer, astronomer, mathematician Ptolemy in his book Geographia [13].
Wari-Bateshwar, in 600m X 600m enclosure with four mud ramparts, is called a fort-city or urban centre. So far 50 archaeological sites have been discovered in and around Wari- Bateshwar. From pattern of archaeological sites, discovered artifacts and sandwich glass bead, it is evident that the settlement was developed in flood free zone and it was affluent trade centre and its inhabitants depended on agriculture [14]. The discovery of Janapada coins places Wari-Bateshwar back to the Sodosha Maha Janapada (ca. 600-400 BC) kingdom of Indian subcontinent. In recent archaeological excavation evidence of human settlement has been discovered which bears the character of Chalcolithic culture, the most important discovery of this culture is black and red ware and evidence of pitdwelling. Several neolithic tools have been discovered from this region, though all the tools are chance finds and no prehistoric settlement has yet been identified. The discovery of prehistoric tools indicates the prehistoric settlement in the region which is waiting to be explored [14].
Mahasthangarh, Bogura Mahasthangarh is one of the oldest archaeological sites of Bangladesh, lies on the right bank of the Karatoya River, about 12 km north of Bogura town (Figure 1). The spectacular site is an imposing landmark in the area, having a fortified, oblong enclosure measuring 1524m x 1370m with an average height of 5m from the surrounding areas. Like the Wari-Bateshwar area, similar settlement patterns are evident at Mahasthangarh (Pundranagar) [14]. The elevation of the Mahasthangarh ranges from 15m to 25m and is at a higher in elevation than the surrounding flat plains and relatively flood free. The site lies on the eastern part of the Barind tract covered by Pleistocene Barind clay residuum [12] and sub-Recent sediments borne by Bangali and Karatoya rivers. Karatoya- Bangali meander floodplain has a complex landscape containing sediments of Holocene age. Other important rivers that drain the tract are the Atrai and Karatoya rivers discharging into the Jamuna River to the southeast, and a few small and monsoon-fed seasonal rivers e.g. Ichamati, Bangali and Nagar. Many swampy areas, locally known as beels are also found around the area [14].
Somapura Mahavihara, Paharpur, Naogaon Somapura Mahavihara was one of the most famous Buddhist monastic institutions of ancient Bengal. The excavated monastic complex at Paharpur (Figures 1 & 2) has been identified with the Somapura Mahavihara built by the second Pala king Dharmapala (c 781-821 AD). The monastery flourished until the 11t century AD. The monastery was repaired and renovated during the reign of Mahipala (c 995-1043 AD), and it is recorded in the Tibetan work, Pag Sam Jon Zang that the same king used to visit Somapura Vihara to offer his homage to it. Somapura Mahavihara gradually declined and was finally abandoned during the 13th century, when the area came under Muslim occupation [14]. This site has been included to the UNESCO declared World Heritage.
Mainamati, Cumilla Mainamati archaeological site, dotted with more than 50 ancient Buddhist settlements of the 8th to 12th century AD [14], is located on the Lalmai Hills (Figure 1). Lalmai Hills, lying west of the Cumilla town, is a 19 km long, north-south trending hilly terrain and has an average elevation of 30.50 m above mean sea level (AMSL). It is gently sloping to the east; the western flank is cliff-like, overlooking the Chandina deltaic plain to the west [15]. The elevation of the plain is about 6.7-9.7 m AMSL. The area is drained by three major rivers -- the Gumti, the Dakatia, and the Little Feni and numerous rain-fed channels. The Lalmai hill comprises the Dupi Tila Formation of the Plio-Pleistocene age, blanketed by Madhupur clay residuum of Pleistocene time [12]. Alam [16] gave the impression of Recent uplift in the area based on drainage anomaly, nature of the western scarp, differential soil development, rapid filling of closed depressions at the toe etc.
Nateshwar, Munshiganj Several archaeological evidences of a Buddhist city older than a thousand years have been discovered at Nateshwar (Figure 1) of Tongibari Upazila in Munshiganj district. These include an entrance and walkway, prayer hall, mortar floor, octagonal stupas, pot shreds, baked clay materials and burnt bricks. The aesthetic of these stupas is unique in architectural style. More than 5,000 square meters were unearthed at Nateshwar and a series of significant results were achieved by this time [17]. C14 dating shows that there were two phases of human habitat in the area – first from 780 to 950 AD and the second from 950 to 1223 AD [13].
Coastal Area (Sundarbans) Recently an archaeological site (Figure 1) has been discovered in the Sundarbans mangrove forest in the south-western coastal region of Bangladesh. So far five spots have been identified there. An estimated age of this archaeological site goes back to about one thousand five hundred years. The sites are scattered on the coast to the Bay of Bengal and on the river banks of the area. From the first impression it is thought the site was developed for salt industry and trade centres, but there were permanent human settlements. These sites are in Shyamnagar of Satkhira and at Katka part of Khulna districts [18].
Another archaeological site (Figure 1) was discovered few years ago in the coastal Sundarbans, a huge UNESCO-protected mangrove forest. Discovery includes submerged salt-producing kilns; built just above the winterly spring high-tide level of time but their bases are currently located ~155 cm below the corresponding modern level. Age of the site was calculated from OSL dating and supported by C14 dating to ~300 yr ago [19].
Regional Tectonic Setting, Geomorphology and Geology of Bangladesh
Regional Tectonic Setting
Bangladesh constitutes the eastern continuation of the central broad Indo-Gangetic plains of India between the Peninsular (shield) area to the south and the extra-Peninsular (Himalayan mountains) region to the north and northeast. At the eastern part of the plain the Bengal Basin is located, having varied tectonic history. The Basin consists of major part of Bangladesh and small portion of West Bengal of India. Bengal Basin lies north of the Bengal Deep-Sea Fan and is bounded on the north by the Shillong Plateau, in the west by shield and in the east by Indo-Burma Folded belt. The Dauki Fault Zone forms an active major east-west tectonic element [20] that separates the Shillong Plateau from the subsiding Surma basin of the Bengal Basin [21]. Tectonically, Bangladesh lies on the Indian plate that is gradually closing to Eurasian plate to the north at a rate of approximately 36-45 mm/year [22] and its eastern margin is bounded by Indo-Burma Folded Belt where an atypical continent-continent subduction is going on [23], the Burmese plate (Figure 3) is moving westward at the rate of 20 mm/year.
Based on the results of geophysical surveys, geological mapping and borelog data Bangladesh part of the Bengal Basin could be divided into two major divisions 1) the Rangpur Platform (also known as ‘Indian platform’ or ‘Stable shelf’) and 2) the Bengal Foredeep [4,24]. The Rangpur Platform is further subdivided into three zones (i) the elevated part of the basement complexes the ‘Rangpur Saddle’, (ii) the northern slope of the saddle the ‘Himalayan Foredeep’ and (iii) the southern slope of the saddle ‘Bogra Shelf’. The Hinge Zone, about 25 km wide with NE-SW trending, separates the Bogra Shelf and the Bengal Foredeep, the latter is a region of great subsidence of the crust, accumulating thick sediments. The Foredeep has been subdivided into two major tectonic zones, (i) the deep basinal unfolded or gently folded ‘Platform Flank’ and (ii) the ‘Folded Flank’ comprising hilly regions of the Chittagong Hill Tracts, Chittagong and Sylhet districts.
Geomorphology and Geology
Geomorphologically, major part of the country is occupied by one of the largest deltas of the world formed by the Ganges- Brahmaputra-Meghna river system originated from the uplift of the Himalayas. The delta prograded south accompanied by rapid subsidence in the basin resulting deposition of huge thickness of deltaic to fluvio-deltaic sediments. The delta building process is continuing into the present Bay of Bengal and broad fluvial front of the major system gradually follows it from behind. Major landforms of the country are being produced by fluvial, tidal and estuarine processes resulting floodplains of Ganges-Brahmaputra-Meghna rivers, deltaic and coastal plains, piedmont i.e. alluvial fans, and estuarine plains. Apart from these, there are three tracts viz. Barind Tract, Madhupur Tract and Lalmai Hills [4]. The north-eastern and eastern parts of the country are occupied by hills (Figure 4).
A large alluvial fan, known as Tista alluvial fan, has been developed in the north-western part of the country, rich in archaeological heritage. The alluvial fan is divided into western as old and eastern as young fans. Besides these, a series of small alluvial fans have been developed at the south of the Shillong Plateau and affected by neotectonic activities [25], and at the base of the eastern hills a narrow piedmont plain has been developed. The floodplains and delta are studded all over with clusters of swamps (depressions) locally known as haor or bil/ beel [26]. The most important cluster is Sylhet trough or Surma basin in the north-eastern part of the country. It is a tectonically active and subsiding basin [27]. Another large swamp lies in the north of the Ganges River, known as Chalan beel. Other swamps exist in the central delta.
The coastal region of the country is divided into old Ganges delta plain in the west, Meghna estuarine plain in the middle and Chittagong coastal plain in the east. Each of these units has their own morphological and sedimentary characteristics. Among other factors, active tectonic nature of Bengal basin, occupying major part of the country, results in a highly complex geomorphology [28]. Several studies show that many of the changes in river courses, deposition of sediments and landform development are affected by tectonics operating in the region.Result of the on-going tectonic movements at the Himalayan front is development of alluvial fans developed at the south [29]. Part of one of these vast fans lies in Bangladesh, the Tista fan. Half of the country is lower than elevation of 12.5 m above sea level. The elevation of hilly areas, occupy the eastern and northeastern parts, lies between 70 and 1000 m. The alluvial plains have the elevation from about 90m in the north-western part of the country to 0 m along the coastal part. Among the uplifted tracts, the maximum elevation, about 40m, was observed in the Barind Tract [30], however, Reimann [4] found about 45m above mean sea level.
Geologically, 80% of the surface and near surface of the country is formed of Holocene deposits [12]. The Holocene deposits, consisting of unconsolidated sand, silt and clay of varying amounts, are the products of piedmont, alluvial, fluvial, deltaic or coastal processes. Eight percent area is covered with Pleistocene clay residuum in the three uplifted terraces (Figure 4). These three tracts are underlain by red to brown coloured oxidized soil. Alam [31] found foundry, chimney with slag and laterite deposits etc. on the Madhupur Tract, and he thought that those are products of iron manufacture in the early days of the history of Bangladesh. The Tertiary sedimentary rocks; consisting mainly of sandstone, siltstone, shale and clay; cover 12%. The oldest exposed rock is the Tura Sandstone of Paleocene age but older rocks like Mesozoic, Paleozoic and Precambrian Basement have been encountered in the drill holes in the northwestern part. Through a long geological time (Permian to Recent) the basement of Bengal Basin, below a thick sedimentary cover, has been severely faulted and fractured which are covered under Holocene surficial deposits.
Factors Controlling Changes in Landforms in the Context of Bangladesh
Fluvial environment is dynamic and constantly changing. Constant deposition of sediments and erosion; slow lateral migration and avulsion of channels due to usual geomorphological processes and tectonic process contribute to the changes in the physical appearance of floodplains. But the common factors that control the supply and deposition of sediments are climate change over time, active tectonics, sea level changes, and change in land use due to anthropogenic activities. The coastal environment, the most dynamic of environment on the earth, was one of the earliest choices for human habitation. Changes are brought about by interplay between marine and terrestrial processes, tectonic activities resulting uplift and subsidence, climate effect and meteorological events like storms. Bangladesh coastal zone frequently experiences cyclones, in many cases with surges. Syvitski [32] give an estimated storm-surge area on the delta of Bangladesh to be 10,500 sq. km.
High Sedimentation Rate
The Ganges, Jamuna-Brahmaputra and Tista rivers carry huge amount of sediment whereas the Meghna River carries much less amount. In an estimate, Kuehl [33] showed the total amount to be of one billion ton of which 30% are deposited on floodplains. Most of these sediments are carried during the rainy season. Sometimes episodic floods bring enormous amount of sediments that suddenly bury the depositional surface thickly (Figure 5).
Geomorphic and Neotectonics Processes
Usual fluvio-deltaic processes are continually shaping this largest delta of the world. However, geomorphology of the delta becomes complex because of ongoing tectonics. Many workers [25,30,34-41] show the uplift of the Madhupur Tract, a Pleistocene tract composed of oxidized soil and stands above the active floodplain. with distinct scarp along the western side, hanging and beheaded valleys, incised drainage on the tract and flow direction indicating tilting in the east, west and south-west. Islam [11] detected evidences from the Madhupur tract in central Bangladesh that indicate Holocene tectonics. Bakr [15] described in detail the relationship of archaeological sites of 8-10th century and landscape, how the uplift of the Early Recent Chandina Deltaic Plain including shifting of river courses badly affected the environment of the area which lies in the eastern part of the present-day Bangladesh. Alam & Alam & Islam [21,25] identified several evidences in the areas south of Shillong Plateau indicating recent tectonics.
Shifting of the Tista River from southerly direction to southeast direction occurred in 1787 and that of the Old Brahmaputra River from east of Madhupur tract to west of the tract taking present Jamuna channel occurred sometimes between 1765 and 1830. These changes probably occurred after the major flood of 1787 [34]. As the two large rivers came to the Jamuna valley from opposites sides, it is logical to believe that ongoing tectonics is responsible for these changes. The Jamuna valley follows the Jamuna fault [42] and another significant point is occurrence of two ~7.0 magnitude earthquakes within the valley in 50 years. Besides these, many examples of shifting of rivers courses can be cited although not all of them are due to tectonic effect.
Natural Hazards
Flood occurs every year submerging floodplains of Bangladesh to which people are adapted, but in some years, flood turns abnormal submergence. The later causes damage to property and crops, communications, disrupts economic activity and endangers lives [34]. Floods in Bangladesh are normally associated with annual monsoon rainfall into the Ganges-Brahmaputra-Meghna basin. Monsoon rain and high river flows across the country’s boundaries are the dominant cause, but other factors such as flat and lowlying topography, bank erosion, siltation, earthquake, storm surge, neotectonics activity, man-made-structures also contribute to inundation and sedimentation. In the living memory, the country experienced worst flooding in 1974, 1987, 1988, 1998 and 2004. Sometimes one flood event may carry enormous amounts of sediments, capable of burying the surface deeply (Figure 5).
The Bangladesh coast experienced 149 cyclones between 1891 and 1998 [43]. The storm surge height attained 10.6m in 1970 cyclone, but its range was 3.0-6.7 during 1960-2007 [43]. The cyclones with storm surges carry enormous sediments from the sea and deposit on the coastal zone. Recent evidence shows how much sediments carried by cyclone Sidr of 2007 that buried the roots of mangrove plants under about 1 m depth in the Kuakata coast (Figure 6), SW Bangladesh. This region of the world was shaken by 7.0 or greater magnitude earthquakes during the last two hundred and fifty years e.g. 1762, 1885, 1897, 1918, 1930, 1934, 1950 [25]. These earthquakes had significant impacts on the geology and geomorphology, and on the lives, properties and infrastructures as well. During first half of this decade the country was shaken by 6.9 Sikkim (2011) and 7.8 Nepal (2015) earthquakes, although there was no damage, but Alam [44] and Alam & Ahsan [45] clearly showed the relationship between earthquake shaking and response of geologic materials i.e. local soil condition. Even low magnitude earthquakes, in some instances, were responsible for morphological change, shifting of streams, generation of earth fissures and liquefaction [25,46] causing changes in landform. The above evidences show that natural hazards were capable enough in changing landforms in the past like the present.
Subsidence
The delta is suffering from subsidence due to usual geological processes and tectonic reasons as well. Alam [47] outlined that the Ganges-Brahmaputra delta is subsiding at a rate of 2-4 mm/ year. Higgins [48] show a subsidence rate of 0 to >10 mm/yr in Dhaka. Hanebuth [19] gave a subsidence rate of the outer delta to be 5.2 ± 1.2 mm/yr. From the above results it is clear now that different parts of the delta subside at different rates. The subsidence causes changes on geomorphology.
Anthropogenic Activities
Population of the country increased from 75 million in 1971 to about 150 million in 2011 [49] with a density of population of 976/sq km in 2011. Due to the rapid increase of population land covers are being continually and rapidly changed for urbanization (Figures 7 & 8), cultivation, construction of roads and industries. This is happening throughout the country. Landfills for land development for construction and dumping municipal wastes, digging for soil and sand collection, cutting for levelling lands and hills are common practice, lead to landform changes.
Climate change
It is now widely believed that Global warming, ozone layer depletion in the atmosphere and rain forest destruction are some of the crucial problems. These changes would affect the environment in different ways. Since it is a global phenomenon Bangladesh cannot escape from it. Thus, retreats of sea, subsidence, natural hazards, anthropogenic influence are the causes of the ruins of many of the archaeological sites/places in the delta.
Basics of Remote Sensing
Introduction
Broadly, remote sensing is defined as the acquisition of information about the surface of the land and ocean, and the atmosphere, by air- or space-borne sensors. It includes both passive and active sensors, receiving reflected and emitted electromagnetic radiation respectively. Remote sensing of earth has come a long way from nineteenth century aerial photography, but now it means satellite remote sensing, started with the launch of Landsat-1 in 1972 for civilian applications. Operation of these varies from low altitude Unmanned Aerial Vehicles (UAVs) to high altitude satellites orbiting the Earth. The electromagnetic radiation includes a very wide range of energy, from X-rays through visible light to radio waves. However, only a portion of the huge electromagnetic spectrum is actually used for remote sensing. This paper mainly deals with the satellite remote sensing. Over the time, the field of satellite remote sensing has passed through new developments e.g. higher spatial resolution optical and radar systems, hyperspectral sensors having the capability of generation of digital elevation model (DEM).
Information Extraction Process
Successful use of remote sensing data depends on the ability of extraction of meaningful information from the imagery, where both visual image interpretation done manually and digital image processing using computers. However, both techniques have their respective advantages and disadvantages. Knowledge of the specific geographic region depicted on an image can be equally significant because every locality has unique characteristics that influence the patterns recorded on an image [50].
Visual Image Interpretation
Much interpretation and identification of targets is done manually or visually. This requires recognizing targets, which is the key to interpretation and information extraction. Observing the differences between targets and their backgrounds involves comparing different targets based on any, or all, of the visual elements of tone (or hue), shape, size, pattern, texture, shadow, and association (site and situation) by human knowledge and experience. If a two-dimensional image can be viewed stereoscopically to simulate the third dimension of height, visual interpretation will be much easier. Aerial photograph gives such opportunity. Radar response is controlled by wavelength, incidence angle, polarization, and surface roughness and dieelectric constant of the soil, depends on moisture content. For these Radar images have certain characteristics that are fundamentally different from optical and thermal images [51], include speckle, texture and geometry. During image interpretations this should be borne in mind.
Tone (or hue) refers to relative brightness or colour of objects on an image. To the interpreter it appears as relative lightness or darkness in the region under study. Shape refers to the general form, configuration, or outline of individual objects. Size of objects on images must be considered in the context of the image scale. Pattern refers to the arrangement of individual objects into distinctive recurring forms that facilitate their recognition [50]. The repetition of certain general forms or relationships is characteristic of many objects. Texture is the arrangement and frequency of tonal change on an image. It gives a feeling of apparent roughness or smoothness to the interpreter. It is produced by an aggregation of unit features that may be too small to be discerned individually on the image. Shadows are important, affords an impression of the profile view of the object and subtle variations in terrain elevations. As a rule, images are more easily interpreted when shadows fall toward the observer. Site refers to topographic or geographic location. Association refers to the occurrence of certain features in relation to others [52] but not like pattern. However, collateral information and non-image information are required to assist in image the interpretation [50].
Digital Image Processing
The digital image usually contains of millions of discrete picture elements known as pixels. A digital image is not the same as a photograph, and only becomes a picture when converted from digital to analogue form on a display screen or in a photographic print. The minimum area covered by a pixel is known as resolution of the sensor, also known as ground resolution or spatial resolution. There is another resolution in remote sensing known as spectral resolution that defines which wavelength is used for the pixels of an array. A multispectral or multi-band image is made up of a series of digital images, one for each waveband images. The third resolution is the temporal resolution which indicates how often the sensor of a satellite acquire image over the terrain. Resolution in remote sensing data is very important to the users’ objectives.
Digital image processing is the application of algorithms on digital images to perform, processing, analysis, and information extraction. Before extraction of information from earth surface data, as seen by the sensors in different wavelengths, need to be radiometrically and geometrically corrected. Digital image processing may involve numerous procedures including formatting and such corrections of data, digital enhancement to facilitate better visual interpretation, or even automated classification of targets and features entirely by computer. Modern archaeology increasingly crosses academic boundaries by combining different new methodologies in order to answer research questions about ancient cultures and their remains [53]. Thus, another advantage of modern-day technology may be taken that includes integration of data from multiple sources to extract better and/or more information, and even multitemporal, multi-resolution, multi-sensor or multi-data type may be integrated, depending on the objectives of the work.
Remote Sensing Application in Archaeology
The use of remote sensing has been applied to archaeological prospection and monitoring since the early days of aviation [53- 55]. Lambers [56] found great potential for a truly semantic analysis of remote sensing data for archaeological purposes. At present a vast array of active and passive remote sensing techniques are available. Since the launch in 1999 of IKONOS, the first civilian spaceborne Very High Resolution (VHR) multispectral sensor, archaeologists have access to relatively low cost VHR optical data over areas where airborne campaigns may be difficult or expensive to organize. However, many similar VHR multispectral spaceborne sensors are also available today, such as Quick Bird, WorldView-1 to 4, GeoEye-1, and Pleiades-1A and 1B. Some available satellites are given in Table 1.
Survey for Archaeological Sites
Visual image interpretation has proven particularly useful in locating sites whose existence lost to history [52]. Surface features include visible ruins, mounds, rock piles and various other surface markings. Subsurface archaeological features include buried ruins of buildings, ditches, canals, and roads. When such features are covered by agricultural fields or native vegetation, they may be revealed on aerial or satellite images by tonal anomalies resulting from subtle differences in soil moisture or crop growth. The traces of ancient human transformations of landscape create very subtle spatial features, namely surface anomalies that are only visible from a bird view. The characteristics of these archaeological features strongly depend on vegetation cover and phenology, pedology, soil types and topography, and named soil, shadow and crop marks [57,58]. Soil-marks can appear on bare soil as changes of tone/colour or texture. Shadow marks can be seen in presence of variations of micro-topographic relief visible by shadowing. Crop marks can be evident for vegetated areas, covered by crops or weeds. They can appear as differences in height or tone/colour in crops which are under stress due to lack of water or deficiencies in nutrients. There may have different in texture.
However, Chen [58] describe in detail the rational basis for archaeological marks. Past human occupation and activities have left traces and marks on landscape alterations and environmental changes that can be recognized even after centuries and millennia. For example, archaeological materials e.g. artifacts, bone, pottery or clusters of building materials would cause such changes. Erosional and depositional processes also contribute to changes. All these marks can be detected on remote sensing images, since the alteration they produce can be revealed by satellite sensors as they can influence spectral response and radar return. Bini [59] could identify different types of colour anomalies from SPOT 6 and SPOT 7 images as well as from Sentinel-2 image. Radar signal return from the object is dependent on radar look direction also. Modern day digital image processing technique can enhance the visibility. Micro-topographic relief variation, sometimes important in archaeology, produces shadows on optical images acquired under low angle sunlight condition. But in case of microwave images i.e. shadow producing mechanism is different, depends on angle of incidence. On Radar image subtle relief can provide shadows, significant in neotectonics and useful in terrain analysis. From high resolution satellite images construction of digital elevation model (DEM), such micro-relief can be identified [60].
Vegetation type and pattern on near-surface archaeological site would show different tone and texture from its surroundings on the image. These happen because compositions of the buried archaeological materials are different; this would have different water holding capacity. Thus, the vegetation gets different water and nutrient from underlying materials showing this difference on the image. There are two kinds of crop marks, including negative marks above wall foundations and positive marks [57] above the damp or nutritious soil of buried pits and ditches. The crop marks in SAR images are indicated by backscattering anomalies instead of the Near Infrared Red (NIR) spectral separability of optical remote sensing [58]. The occurrence of archaeological remains can change soil types and contents compared with their surroundings resulting in the well-known phenomenon of soil marks showing change in tone and texture in the absence of vegetation cover. Damp marks appear on bare ground because buried archaeological-remains can alter drainage capability and, in turn, water distribution. The detectability of damp marks is linked to soil type, climate and meteorological conditions.
Bangladesh examples: Examples from two archaeological sites/places may be cited here. Efforts have been taken to evaluate the visibility on remote sensing images for two large archaeological sites in Bangladesh, situated in two different geological environments. These sites/ places are at Dharmapalgarh, Nilphamari and Wari-Bateshwar, Narshingdi. The first site is on Young Tista Alluvial Fan that contains Recent unconsolidated sediments and the site is younger than the later. The second site is on the uplifted terrace containing Pleistocene oxidized soils and about 4th BC old. The walls of the archaeological site at Dhamapalgarh, Nilphmari (Figure 1) are visible on CORONA satellite photograph, Landsat TM and Google images. On the CORONA satellite photograph acquired during late 1960s and Google image acquired in 2011 rampart of this fortified city of Dhormo Pal and structure of another nearby-site in Nilphamari district are easily identifiable (Figure 9). It is a rectangular structure (1mile (N-S) x ½ mile (E-W)) [61], but its eastern wall has been eroded away by one of the paleo-courses of the Tista River. However, on the Landsat TM bands 3 and 4 north and west walls are identifiable, south wall is not visible; whereas the site is not visible on bands 1 and 2, this needs more study. Obviously, Landsat TM FCC shows the north and west walls clearly as white colour in the red coloured background. It is also noticeable the changes that took place during the 1960s and 2010s period due to natural (vegetation and channel morphology) and anthropogenic (agriculture, settlements and road construction) activities. During a field visit, detection of the continuity of the walls was found not easy. This area experiences inundation from annual flooding that brings sediments, deposit on the plain. The area also experiences subsidence due to usual geologic processes. In the field visit to a nearby mound site an elderly local resident informed that the mound was at a higher elevation about 45-50 years ago than that of today. Main anthropogenic activities include intense agriculture and reuse of the bricks for local purposes.
The fort-city or urban centre of Wari-Bateshwar is enclosed with four mud ramparts in a 600m x 600m area [13]. This site (Figure 10) is clearly visible on CORONA satellite photograph and Google images, from their shape, size and association. However, the site was not identifiable on Landsat TM image. This result is only from visual interpretation; enhancement in digital images may help in identification of such features. Due to the position of the site above flood level there is no or very little sedimentation. Little amount of sediments may come from surface erosion. Anthropogenic activities include cultivation of land, cutting red soil for building local mud-house, digging pit for dumping garbage etc. by local people. Luo [62] found GoogleEarth very high-resolution imagery to be powerful for a range of different archaeological and cultural heritage applications.
Comparison of situations at two different times – before and after excavations at an archaeological site/place at Madhabgaon, Dinajpur district is shown in Figure 11. Geologically the site is on the Old Tista alluvial fan, surficial sediments are of early Holocene time. The image before excavation (left) shows only a round-shape land with smooth texture and light tone surrounded by vegetation, although no significant archaeological evidence is identifiable. But the image acquired after excavation (right) gives light tone with rough texture. Substantial changes on the site made during excavation give such changes in tone and texture.
Geoarchaeology
In geoarchaeology, primarily a subset of geosciences is considered [63] that include particularly geomorphology, sedimentology, pedology and stratigraphy. For geoarchaeological research in an alluvial terrain it is important to know the influence of internal (autogenic i.e. caused by infilling of sediments to storage site or sudden channel modification) and external (allogenic i.e. caused by alterations in catchment characteristics and tectonics) forces in channel change. But, changes in catchment characteristics and alteration of sediments in depositional site are related with climate change. Mehdi [64] concluded, based on the available data on sediments, that the buried channels, identified from Landsat ETM+ and SRTM and ASTER DEM data, at depths 6-13m were last active between 6 and 3 Ka B.P., when they supported the archaeological settlements along their banks. Ferentinos [65] opined that geological evidence for disappeared habitation sites can be identified from remote sensing.
Rivers and associated floodplain depositional environments are important in archaeology [66]; they served as notable significant loci for past occupations [67]. These dynamic landscapes exhibit a variety of local sedimentary environments [68] producing terraces, wealth of stratigraphic, paleoenvironmental and geoarchaeological information [67]. Alam & Islam [69] successfully mapped the terraces on the Brahmaputra floodplain using SPOT Pan Imagery. Such information contributes to infer past conditions from floodplain sediments comes from the analysis of contemporary rivers and their sedimentation [68] i.e. the present is the key to the past. The utility of SAR remote sensing to detect the subsurface in sand covered areas has long been known [70,71]. Stewart [72] evaluated X-band SAR data and found to have limited capability for prospection of archaeological structures buried in sand covered areas. Its success depends also on the terrain condition, among other controlling factors.
In Bangladesh, SAR data have so far used in flood assessment [73,74] using RADARSAT data and for measuring subsidence rate [48] in the delta using SAR interferometry (ALOS L-band InSAR). In geomorphological study, Alam [75,76] could identify different features on RADARSAT (C-band) and JERS-1 (L-band) SAR images e. g, dry valleys (not buried) on the uplifted terrace and active channels but lithological discrimination was not possible. In another study, even geomorphological features were not identifiable [25]. Probably high moisture content, influences die-electric property of the materials hampers the process of image interpretation. As the terrain condition of Bangladesh is different from the above-mentioned examples [70,72], potentiality of available SAR images from RADARSAT and ERS (C-band) or JERS may be evaluated and same for the ground penetrating radar (GPR) dependency on water or moisture [66] among others.
Bangladesh examples: Earliest work among the above was done by [15] where he mapped drainages and landforms in the eastern part of Bangladesh from Landsat imagery and aerial photographs and described in detail about landform evolution. Bakr [15,77] showed the relationship of archaeological sites of 8-10th century and landscape, how the uplift of the Early Recent Chandina Deltaic Plain including shifting of river courses badly affected the environment of the area. Akanda [78] studied satellite images to detect the nature of archaeological records in terms of geomorphology, geology, elementary pedology and stratigraphy of Wari-Bateshwar area in order to understand the influence of fluvial environmental variables on deposition and modification of archaeological records. They concluded that any archaeological inference on the area must be corroborated by the geoarchaeological evaluation.
Sen [79] successfully used, among others, satellite images to unfold the formative history of the floodplain and the lateral migration of rivers in the archaeological site of Somapura Mahavihara, Naogaon. Among other reasons, gradual migration of the main river in the area must have caused the settlement here to be abandoned. To understand the early Medieval settlement archaeology of the alluvial terrain of the northwestern part of Bangladesh Sen [80] carried out a detail study in a geo-spatial environment. He identified not only the various geomorphological features and potential archaeological features on the floodplain but also showed spatial patterns of archaeological places on satellite images. Paleo-channels of the Tista-Mahananda-Karatoya rivers have been identified [81,82] from visual interpretation of aerial photographs and satellite images on the Tista Alluvial Fan. Their findings help in deciphering paleo-environment, river dynamics, anthropogenic impact on environment, paleoclimate condition etc, giving clues to the causes of migration and migration pattern of human settlements.
Discussion and Conclusion
As mentioned earlier that major part of Bangladesh is covered with Quaternary alluvial deposits, the region is tectonically influenced, and the sediments have experienced impacts of climate change as well. Such factors must have influenced the human settlements in the alluvial terrain, found ideal for past settlements [54]. Factors that influences changes in the landforms of the country at present time discussed in the previous paragraphs might have also influenced in the past resulting burial of human settlements or archaeological marks on the delta. The very widely accepted principle in geology – ‘present is the key to the past’ may be applied in search of hidden archaeological sites using remote sensing. Advantage of medium and high spatial remote sensing data may be taken to locate archaeological site, and relatively low and medium resolution image data may be used in geoarchaeological study.
Depending on the purposes, selection of band is another important point needed to detect, identify and map the active and paleo-channels, and water bodies required for evaluating rate, pattern and style of channel migration. Smaller objects may be identifiable from their shape and association, however, may need to apply image enhancement techniques on the remote sensing data during digital image processing. High spatial resolution image e.g. Pleiades (50cm), IKONOS, QuickBird (60cm) etc. will help in identification of smaller size sites and objects. Moreover, DEM can be constructed using high resolution stereo-images that would give subtle micro-relief on plain lands, important clue for archaeological research. Due to several reasons’ aerial photographs, advantage of having stereoscopic visibility capability, are not easily available. In that case high resolution satellite image may be used.
Geoarchaeological techniques and approaches are widely recognized as enabling syntheses of landscape development and the archaeological record [83]. But for Bangladesh, more works [11,15,77-80,82] need to be done to examine and understand the changing human settlements with the changes of landforms in such alluvial terrain. Use of wide ranging remote sensing data from aerial photographs, CORONA satellite photographs, medium resolution satellite images (Landsat TM & ETM+, SPOT, IRS) to high resolution (Lidar, Pleiades, RapidEye) and from optical to microwave (Radarsat, JERS and ERS) contributed much to geological, geomorphological, urban geological [84], environment, natural hazard assessment [50] etc. furnished with successful results in Bangladesh. But the relationship between SAR signal and terrain characteristics is yet to be well understood, important also for archaeological research. Because of its different geologic and geotectonic characteristics, identification of buried sites using SAR images is in doubt. Only the expert visual image interpreter can use SAR images for geoarchaeology. However, SAR look direction gives the advantage in locating linear features on the image. Anyway, research must be carried on for a better understanding of these relationships and identification capabilities.
CORONA satellite photographs provide information of the time prior to Landsat era. These photographs were acquired during 1960 and 1972, now become available for civilian use [50], with variable spatial resolution (~2-12m) and in black and white [59]. At that time, population of this country and population pressure on the land and environment, development activities were much less than those of today. The advantage of CORONA satellite photograph may be taken for archaeological research to see situation in a relatively less modified landform, favouring identification of archaeological marks. Significant development in remote sensing techniques have been made during the last few decades advantages of which should be taken to locate and identify buried features prior to excavation, and to understand the relationship between human settlements with their geological environments.
After an evaluation of archaeological works done using remote sensing data particularly in Bangladesh context application of this technology is in the initial stage and it has much potentiality. Depending on nature of problem selection of multi-spectral, multi-resolution or multi-temporal image will depend. In order to extract meaningful information, based about Bangladesh i.e. the intensively cultivated lands, huge anthropogenic influence on environment, vegetation cover, influence of geomorphic, geologic and tectonic processes, and climatic condition; appropriate image interpretation and digital image processing techniques should be performed. Successful extraction of relevant information can improve our level of understanding about our environment, which may need integration of data from different sources. Another important point is that an integrated approach of archaeologists, geologists and remote sensing experts would bring successful results to solve the archaeological problems.
Acknowledgement
Professor Sufi Mostafizur Rahman, Professor Syed Mohammad Kamrul Ahsan and Professor Swadhin Sen of Department of Archaeology, Jahangirnagar University kindly provided support to visit the archaeological sites in the central and fieldwork in the north-western parts of Bangladesh at various times. Discussions with them on various aspects of archaeology, human settlements and their relationship with landscape etc. enriched the author’s level of understanding. Reshad Md. Ekram Ali of Geological Survey of Bangladesh kindly provided CORONA satellite photographs. All their supports are gratefully acknowledged. Finally, I would like to thank Nahid Arjuma Begum, my beloved wife, who rendered whole-hearted and continuous support to all my scientific and research works, especially more desirable in retired life.
To know more about Journal of Archaeology and Anthropology: https://juniperpublishers.com/gjaa/index.php To know more about our website click on Open access Journals publishers: Juniper Publishers
#Juniper Publishers#Juniper Publisheres Group#juniper publishers open access journals#juniper publishers journals
1 note
·
View note
Photo

Launch delayed again for showcase Canadian satellite system There's been another delay for the troubled Radarsat Constellation Mission program, a $1-billion showcase project for the Canadian Space Agency.
0 notes
Photo

From NASA Earth Observatory Image of the Day; March 5, 2017:
San Joaquin Valley is Still Sinking
Since the 1920s, excessive pumping of groundwater at thousands of wells has caused land to subside, or sink, by as much as 8.5 meters (28 feet) in sections of California’s San Joaquin Valley. This subsidence is exacerbated during droughts, when farmers rely heavily on groundwater to sustain one of the most productive agricultural regions in the United States.
Subsidence is a serious and challenging concern for California’s water managers, putting state and federal aqueducts, levees, bridges and roads at risk of damage. Already, long-term land subsidence has damaged thousands of public and private groundwater wells throughout the San Joaquin Valley. Furthermore, the subsidence can permanently reduce the storage capacity of underground aquifers, threatening future water supplies. It’s also expensive. While there is no comprehensive estimate of damage costs associated with subsidence, state and federal water agencies have spent an estimated $100 million on related repairs since the 1960s.
To determine the extent to which additional groundwater pumping associated with California’s recent historic drought has affected land subsidence in the Central Valley, California’s Department of Water Resources (DWR) commissioned NASA’s Jet Propulsion Laboratory to use its expertise in collecting and analyzing airborne and satellite radar data. An initial report from JPL in August 2015 analyzed radar data from several different sensors collected between 2006 and early 2015. Due to the continuing drought, DWR subsequently commissioned JPL to collect and analyze new radar images from 2015 and 2016 to update DWR.
Several trouble spots that were identified in 2015 have continued to subside at rates as high as 0.6 meters (2 feet) per year. Significant subsidence was measured in subsidence bowls near the towns of Chowchilla, south of Merced; and Corcoran, north of Bakersfield. These bowls cover hundreds of square kilometers and continued to grow wider and deeper between May 2015 and September 2016. Subsidence also intensified near Tranquility in Fresno County, where the land surface has settled up to 51 centimeters (20 inches) in an area that extends 11 kilometers (7 miles).
The map above shows the total subsidence in part of the San Joaquin Valley between May 2015 and September 2016 as observed by the European Space Agency’s Sentinel-1A satellite and analyzed by scientists at JPL. The areas of most extensive subsidence appear in shades of yellow and bright green.
JPL scientists plotted the history of subsidence of several sites in the mapped areas and found that for some areas in the San Joaquin Valley, subsidence slowed during the winter of 2015-16 when rainfall matched crop water needs. “While we can see the effect that rain has on subsidence, we know that we’ve run a groundwater deficit for some time, so it will take a long time to refill those reservoirs,” said JPL report co-author Tom Farr.
Cathleen Jones, a co-author and scientist from JPL, said being able to pinpoint where subsidence is happening helps water resource managers determine why it is happening. “If you see a subsidence bowl, then something is going on at the center of the bowl that is causing the land to sink—for example, high levels of groundwater pumping,” she said. “We can locate problem spots so the state can focus on those areas, saving money and resources. We find the needle in the haystack, so to speak.”
The researchers compared multiple satellite and airborne interferometric synthetic aperture radar (InSAR) images of Earth’s surface to show how subsidence varies over space and time. InSAR is routinely used to produce maps of surface deformation with approximately centimeter-level accuracy. The 2015 and 2017 reports included data from Sentinel-1A, NASA’s Uninhabited Aerial Vehicle Synthetic Aperture Radar (UAVSAR), Japan’s PALSAR, and Canada’s Radarsat-2.
“The rates of San Joaquin Valley subsidence documented since 2014 by NASA are troubling and unsustainable,” said DWR Director William Croyle. “Subsidence has long plagued certain regions of California. But the current rates jeopardize infrastructure serving millions of people. Groundwater pumping now puts at risk the very system that brings water to the San Joaquin Valley. The situation is untenable.”
To read the new report, which includes data about other portions of California, click here.
NASA Earth Observatory map by Joshua Stevens, using ESA Sentinel-1 SAR data courtesy of Tom Farr and Cathleen Jones, NASA Jet Propulsion Laboratory. Caption by Alan Buis (Jet Propulsion Laboratory) and Ted Thomas, California Department of Water Resources; edited by Mike Carlowicz. Instrument(s): Sentinel-1A
#earth observatory#long post#satellite data#subsidence#groundwater#aquifer#sinking#San Joaquin Valley#California#Sentinel-1a#environment#water usage
1 note
·
View note