#Graphs
Explore tagged Tumblr posts
Text

#gulf of mexico#gulf of america#coolness graphed#bar charts#graphs#refusing to use a new name#dead name#deadnaming#sears tower#skyscraper#name change#infographic#charts#humor#donald trump
28K notes
·
View notes
Text
apologies for the delay. had to make a whole new graph to extend the y-axis because buck will never stop saying this man's name.
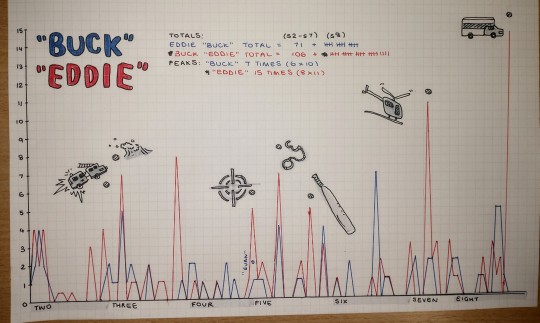
(click for quality pls)
(also check out my lino prints if you'd like ehehehe- https://forms.gle/Jov7NHahyqr1xTFPA)
#Hehehheheheheh#graphs and such#graphs#911 graph#911 data#911 abc#9-1-1#9 1 1#eddie diaz#jwpyyy#911 show#buddie#evan buckley#911 season 8#911 season 7#500#1000#2000#tops
3K notes
·
View notes
Text
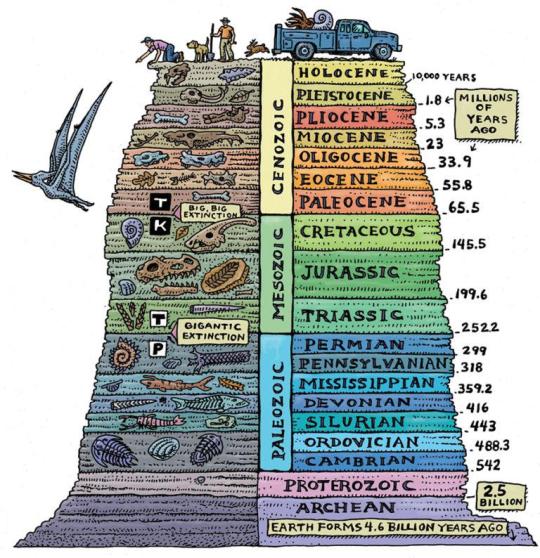
Guide For The Geological Time Periods In Order
#geology#geologists#charts#graphs#infographics#infographic#time periods#educational#earth#science#interesting
10K notes
·
View notes
Text

Proust’s longest translated sentence
#on taking notes#aesthetic notes#studyblr#academia#how to study#study inspiration#studyspo#daily journal#classification#graphs#literature#proust#marcel proust
847 notes
·
View notes
Text
LU Survey 2024 Results
The long awaited results of the survey. Thank you guys for being so patient with me :)
There were 350 responses to the survey this year! Not as many as there were last year, but still impressive. If you want to look at the raw data for this, you can do so here
Demographics


General Questions


Favorites and Least Favorites


Blank Space Question (Select Answers)
I'm so normal about Legend (the biggest lie I've ever told)
WIND BABY WIND OUGH IHGH UUOA I AM SICK FOR HIM MY SKRUNKLE MY OUGHGHHGJUA BELOVED
Remember that fandom is a community! Reach out to each other and learn something new! Give someone a compliment! Ask them a question! Encourage new artists and writers who are still learning! Thank you Mint for doing the survey again, too!
The fact no one has thought of calling Warrior's Zelda, "Areia" hurts me deeply "Hyppolita" even, please, with how much shipping there is between them, people sure are eager to name her after goddesses who have vowed to never have romantic relationships.
I dont think the fandom talks about it but i really love that every single piece of sky clothing is embroidered, because unless skyloft has embroidery machines thats all hand done. Which means either someone he knows makes a lot of them and gives them out freely (i give most of my projects to friends and family) or he would have paid someone for it, which means that either someone on skyloft lives of decorating clothing (and likely other fabrics) or someone just uses it to get some extra money (both are amazing since in the modern day people dont want to pay for handcrafted works what its actually worth)
Shark skeletons are made of cartilage, not bone
It's dangerous to go alone. Take this. 🦆
FOUR SUPREMACY🗣️🗣️🗣️🗣️🔥🔥🔥🔥💚❤️💙💜💪💪💪💪🔛🔝💯💯💯💯💯
No but the Athena/Artemis thing is so real. What’s up with that. Why did we pick Artemis? Why did we do that?
I find it so funny how the fandom has decided to call Dark Link "Dink" because whenever I play a Zelda game I name my character Dink or Dinkus :D I started doing this waaaaay before I knew about LU
Im so excited for Echos of Wisdom! I find it really funny that Nintendo keeps making it harder for JoJo to stick to the plan, I'm pretty sure it's Legend and Fable but I'm not certain any ways Im really happy!
I love how LU is a culmination of so many of my favorite tropes from other fandoms! It’s been really comforting and nostalgic for me despite the fact that I only got into it this year. Especially since so many creators I liked have been getting revealed as problematic, it’s nice to be able to fall back on fictional characters who can’t ruin the lives of real people. :)
#lu survey 2024#linked universe#long post#lu wild#lu time#lu twilight#lu legend#lu warriors#lu hyrule#lu wind#lu four#lu survey#graphs
293 notes
·
View notes
Text
Number of Graphs
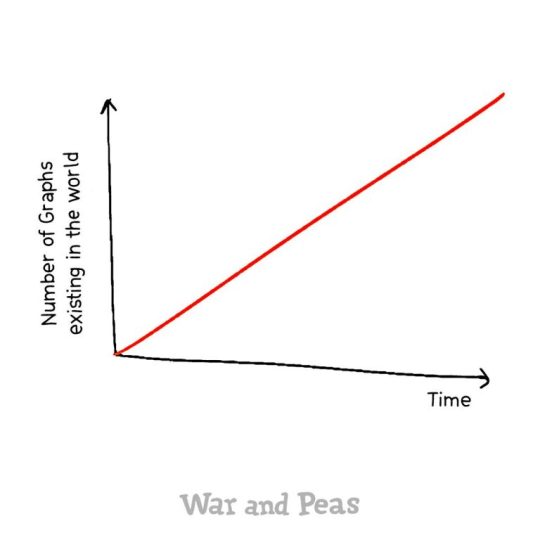
View On WordPress
562 notes
·
View notes
Text
Historical top video game fandoms on AO3, and how they've grown over the life of the archive
I dove into the depths of AO3 and figured out the top video game fandoms each year, and put them all on some graphs.
Here's everything which at one point was among the top five within the video game section.
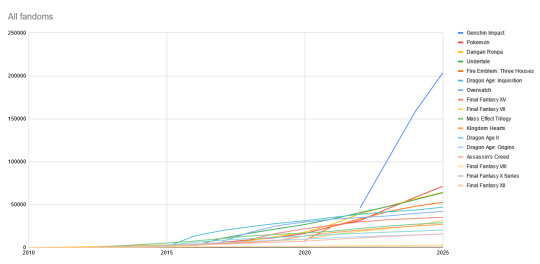
Here's everything except Genshin Impact, just for better visuals

And here're the historical top five split into two graphs so you can see the larger and smaller fandoms separately (note the difference in scale)
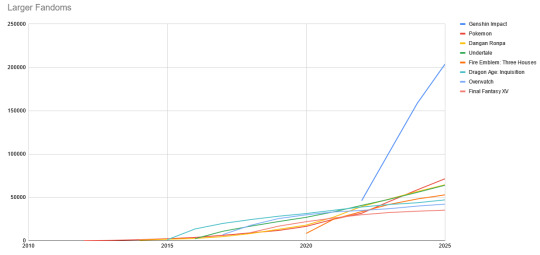
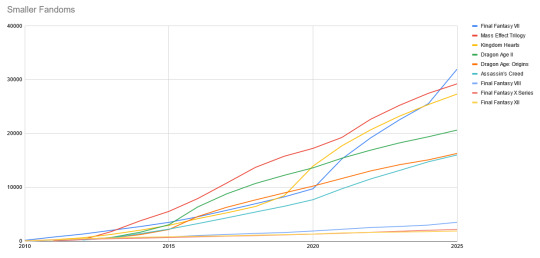
Here's a log scale showing the growth of the top video game fandoms against the growth of the entire archive.
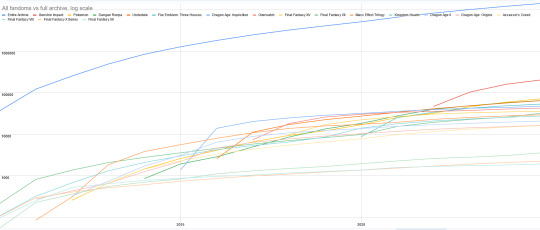
For more graphs, a separate section on Dragon Age, and a full writeup of how I obtained these numbers and what they mean, see the full work on AO3.
Interactable versions of the graphs are on a Google spreadsheet here.
https://archiveofourown.org/works/62226781/chapters/159187414
____________
Methodology: Short Version (the long version is here)
I used Wayback machine snapshots to estimate the top fandoms tags in the Video Game Fandoms category per year, sifted out tags that aren't actually video game fandoms (for example, Harry Potter is there on the strength of Hogwarts Mystery and a Lego game alone), and then made some judgement calls about when to track a single game's tag vs a franchise's tag vs a mid-level umbrella tag. These descisions were based primarily on consulting with fans of the games/franchises in question and asking what they consider to be separate fandoms, but was also influenced by how tags are wrangled into dependencies on AO3 (which influences what data is acutally available to track in the first place).
Then I verified/updated the Wayback lists by searching AO3 for works within each tag created before Jan 1st of each year, tracked the top five of those tags for each year over the life of the archive, and finally used Google Sheets to turn those numbers into graphs.
#AO3#Archive of Our Own#Fandom History#Fandom statistics#fandom stats#graphs#video game fandoms#fandom research#fandom meta
137 notes
·
View notes
Text

Good graphs don't need a title.
03/10/23
807 notes
·
View notes
Text

#outkast#hey ya#matthew mcconaughey#alright alright alright#dazed and confused#bar charts#90s movies#coolness graphed#charts#graphs#bar graphs#alright
398 notes
·
View notes
Text
Silmarillion Survey Essay!
My essay was due last night (submitted it with 6 minutes to spare!) and my professor said I could post it to Tumblr if I wanted to. It's divided into four sections, all marked. The first section is the introduction where I explain the point of the survey, who I studied, and why. The second section is the methods I used to design the survey, get answers, record answers, and control for variables. The third section is results, where I highlight several of the questions I thought would be most stratifying and explain what I actually found (it has graphs!). The fourth section is the discussion where I talk about what I found and what conclusions I drew from that.
I'd love to hear all of your thoughts on the results and my conclusions!
Introduction
For this project, I looked into age (and length of time in fandom, in one case) affected knowledge and attitudes about fandom language. I investigated several terms and phrases, both from fandom at large and from the Silmarillion fandom specifically. The group I studied was the fandom of The Silmarillion on Tumblr because I am intimately familiar with that internet space (and could therefore phrase the questions in a way that would be understood) and because the majority of Archiveofourown.org (a popular fanfiction website) users are also Tumblr users.
For the purposes of this paper, I am defining the Silmarillion fandom as a community of practice. The Wenger-Trayner article, “Communities of practice a brief introduction”, defines a community of practice as an entity with three parts: domain, community, and practice. The domain is “an identity defined by a shared domain of interest” (Wenger-Trayner 2). The domain in this case is The Silmarillion. As The Silmarillion is a history book set in a fictional universe, it is incredibly dry at times (there is an entire chapter titled “Of Beleriand and its Realms” which deals mostly with geography) so anyone who reads it by choice is necessarily interested in the work. The second part, community, is made up of “members [that] engage in joint activities and discussions, help each other, and share information” (Wenger-Trayner 2). Most fandoms engage in discourse/discussion, create transformative art (mostly written or visual, but I have seen musical as well) and exchange craft advice to better each other’s creative work, but due to the almost academic nature of the Silmarillion fandom, we exchange background lore knowledge, additions to Tolkien’s conlangs, translations, timelines, and character sheets in addition to the regular fandom activities. Finally, the Silmarillion fandom also has a shared practice, defined as “They develop a shared repertoire of resources: experiences, stories, tools, ways of addressing recurring problems—in short a shared practice” (Wenger-Trayner 2). As mentioned above, the Silmarillion fandom has shared resources (such as tolkiengateway.net, Nerd of the Rings on YouTube, as well as several established “fandom elders” who are happy to answer questions), stories, established characterizations for “only-mentioned-once-in-a-footnote” type characters, settled linguistic debates, and several research-oriented blogs (such as two of my own) that record niche or new knowledge about either Tolkien’s work or the fandom itself. Almost all of the above (with the possible exception of the website and the youtuber previously mentioned) is unpaid hobby work.
When doing this survey, I expected to find a rather steep difference between older and younger members of fandom regarding their knowledge of fandom terminology. I expected the 18-25 age group to be the most knowledgeable of fandom terms with the under 18 group to be only slightly behind them and the 26-30 group a slightly further way behind the under 18 group. For the groups over 30, I anticipated that the rate of knowledge would sharply decline and that older fans would be unfamiliar with fandom terminology for the most part. I was… incorrect.
Methods
There are eight questions highlighted in this paper. The first chart (Figure 1.) is the total percentage of answers that amounted to “I don’t know”, filtered by age. The first table (Figure 2.) looks at the people who did not know the term “Isekai” based on whether or not they were native speakers of English or live in Asia (given that “Isekai” is a Japanese word). The second table (Figure 3.) compares the percentage of people who mentioned that the word “angst” is also present in everyday German, categorized by German speakers and non-German speakers. The third table (Figure 4.) examines attitudes towards the anti/pro-ship terms based on age. The second chart (Figure 5.) examines attitudes towards the term “omegaverse” separated by age. The fourth table (Figure 6.) compares groups of people who could define the difference between “peredhel” and “peredhil”, separated by how long they have participated in the fandom surrounding the Silmarillion fandom. The third chart (Figure 7a.) looks at people who understand the phrase “Fëanor did nothing wrong” as a joke, filtered by age. Finally, the fourth chart (Figure 7b.) shows the percentage of people who used the phrase “tongue-in-cheek” in the 31-40 group as opposed to other age groups (that one was not explicitly asked for in the survey; I simply noticed a steep trend while dissecting the results from the “Fëanor did nothing wrong” question).
I compiled all of these questions (along with several others) in a google form as a three-part survey. The first part was comprised of basic demographic questions, the second of general fandom terms and phrases, and the third of terms and phrases specific to fanfiction of The Silmarillion. The 418 responses were recorded and examined in Google sheets, which I used to filter the demographic information for ease of synthetization.
The group I examined was people who participate in the Silmarillion fandom on Tumblr. I chose this group because I am familiar with them, because they are the most likely to be aware of these terms (due to the large overlap between Tumblr and Archive Of Our Own), and because fandom language is (to the best of my knowledge) not well studied. I was able to isolate this group by only posting the survey to Tumblr itself. Tumblr posts are only viewable to Tumblr users, so even if someone were to post a link to the post elsewhere, the only people able to access the survey would be Tumblr users. I further attempted to control by including several fandom related and The Silmarillion-specific questions in the demographic portion of the survey. Anyone who completed the demographic portion would have been well aware of the nature of the survey by the end, regardless of how poorly they understood the original survey posting. These measures, of course, did not stop everyone. I had a few respondents who submitted only the demographic portion or the demographic and general fandom portions. Luckily, due to the Google Sheets functions, such responses were relatively easy to filter out.
Results
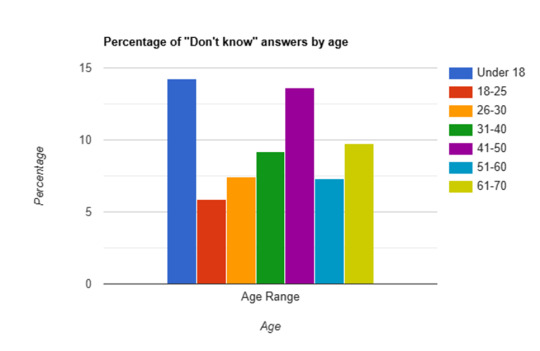
(Figure 1. A chart observing, out of all 16,065 answers, how many equate to “I don’t know?” Under 18: 14.24%, 18-25: 5.9%, 26-30: 7.43%, 31-40: 9.17%, 41-50: 13.63%, 51-60: 7.3%, 61-70: 9.7%)

(Figure 2. A table comparing different categories of people and what percentage of them are unfamiliar with the term “Isekai”; a Japanese term which is most commonly defined as “a trope in which a character somehow travels from the mundane ‘real’ universe into a fictional one.” 23.08% of native English speakers are unfamiliar with the term. 27.07% of non-native English speakers are unfamiliar with the term. 20% of respondents who live in Asia are unfamiliar with the term.)

(Figure 3. A table comparing different categories who mention that “Angst” (defined in fandom context as “dramatic, serious, and sometimes dark”) is an everyday word in German. 12.73% of German speakers mentioned it. 1.38% of people who either do not speak German, or did not mention it in their language background, mentioned it.)

(Figure 4. A table comparing the attitudes of different age groups to the terms “anti-ship” and “pro-ship”. These terms are hotly debated in fandom. Those on the anti side of the debate define anti-ship as “being morally against abuse and pedophilia,” and pro-ship as “excusing abuse and pedophilia in fandom.” Those on the pro side of the debate define anti-ship as “puritanical and chronically online people who can’t separate reality and fiction” and pro-ship as “letting people ship whatever they want and separating reality from fiction.” Those under 18 are 4% anti, 4% pro, and 92% neutral. Those from 18-25 are 2.44% anti, 29.27% pro, and 68.29% neutral. Those from 26-30 are 0% anti, 33.67% pro, and 66.33% neutral. Those from 31-40 are 2.2% anti, 26.37% pro, and 71.43% neutral. Those from 41-50 are 0% anti, 46.15% pro, and 53.85% neutral. Those from 51-60 are 12.5% anti, 37.5% anti, and 50% neutral. Those from 61-70 are 0% anti, 50% pro, and 50% neutral (although, admittedly, there are only two respondents in that group.))
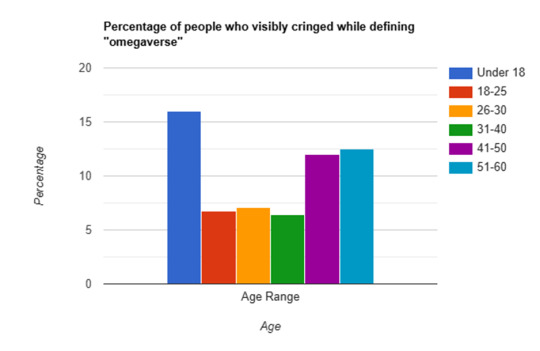
(Figure 5. A chart that shows the rate at which respondents cringed (using phrases such as “please don’t make me define this,” “oh god,” and “Nuh uh. Sorry man. Sweet baby rays good lord.”*) within their responses while defining “Omegaverse” (an erotica subgenre within fandom based on outdated wolfpack dynamics. Very popular, but also very taboo). Under 18: 16%, 18-25: 6.71% 26-30: 7.07%, 31-40: 6.45%, 41-50: 12%, 51-60: 12.5%)
*All real responses I received
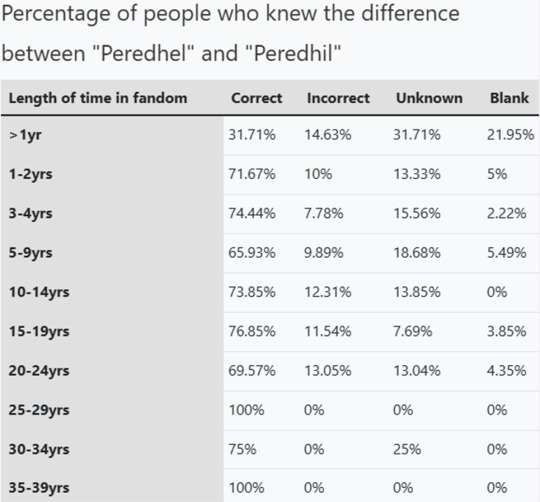
(Figure 6: A chart exploring the differences between who can correctly identify the difference between the terms “peredhel” (half-elf, singular) and “peredhil” (half-elves, plural) based on how long they have been in the fandom. Those who have been in the fandom for less than a year are 31.71% correct and 14.63% incorrect. Those who have been in the fandom for 1-2 years are 71.67% correct and 10% incorrect. Those who have been in the fandom for 3-4 years are 74.44% correct and 7.78% incorrect. Those who have been in the fandom for 5-9 years are 65.93% correct and 9.89% incorrect. Those who have been in the fandom for 10-14 years are 73.85% correct and 12.31% incorrect. Those who have been in the fandom for 15-19 years are 76.92% correct and 11.59% incorrect. Those who have been in the fandom for 20-24 years are 69.57% correct and 13.04% incorrect. Those who have been in the fandom for 25-29 years are 100% correct and 0% incorrect. Those who have been in the fandom for 30-34 years are 75% correct and 0% incorrect. Those who have been in the fandom for 35-39 years are 100% correct and 0% incorrect.)
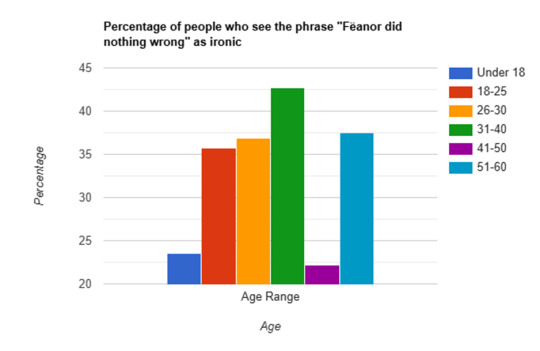
(Figure 7a. A chart observing who sees the phrase “Fëanor did nothing wrong as ironic” divided by age. Under 18: 23.53%, 18-25: 35.77%, 26-30: 36.9%, 31-40: 42.67%, 41-50: 22.22%, 51-60: 37.5%)
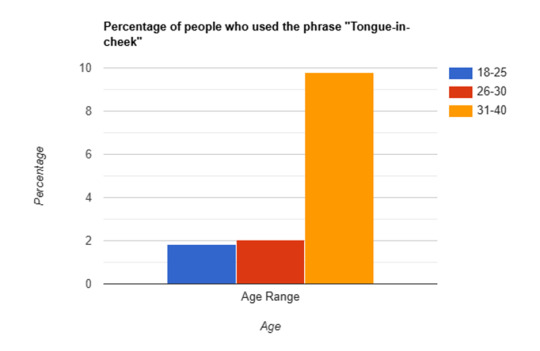
(Figure 7b. A chart observing the percentages of age groups who used the phrase “tongue-in-cheek” while answering the above question. 18-25: 1.84%, 26-30: 2.04%, 31-40: 9.78)
Discussion
Observing these results, I can see that, while there is some level of stratification by age and length of time spent in the fandom, it is not nearly as dramatic as I had expected it to be. These results strongly demonstrate the power of communities of practice. These people, across ages and continents, communicate so often and so deeply, that nearly all terms are understood to the same degree by everyone, and nearly everyone has similar stances on divisive pan-fandom debates.
Were I to do this study again, or a similar study in the future, I would probably narrow the purview by a lot. I would ask fewer questions (or at least, only ask questions of a single type), compare them against only one demographic question, and sincerely consider making them multiple choice. That being said, I do not regret this survey having short answer questions. There were several definitions of several terms that I never could have come up with in a million years. Synthesizing the short answers may have taken more effort on my part, but I learned a lot about my fandom.
@proship-anti-discussion (ship debate was mentioned)
#silmarillion#fandom#linguistics#survey says#silmarillion survey#fandom survey#academia#nerd shit#graphs#charts#tables#isekai#angst#antishiping#proshipping#omegaverse#peredhel#peredhil#feanor#fëanor#fëanor did nothing wrong#fandom discourse#fandom meta
81 notes
·
View notes
Text
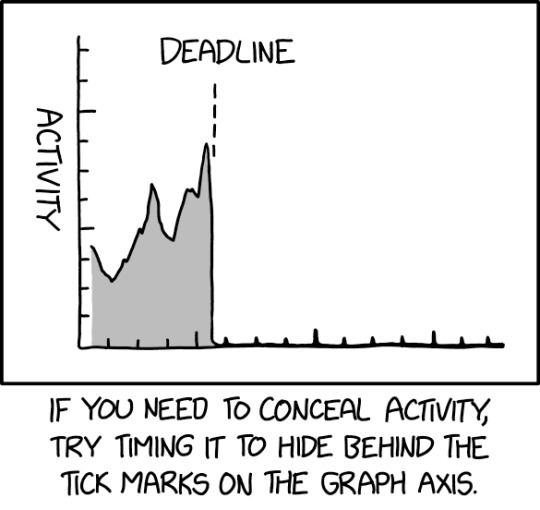
If you're really savvy, you can hide an entire set of illicit transactions by timing them to draw what looks like a graph inset.
Tick Marks [Explained]
Transcript
[A graph with two axes is shown. Each axis has tick marks with every fourth mark a bit longer than those in between. The Y-axis is labeled with text rotated 90 degrees clockwise. There is no label on the X-axis. The graph is a jagged curve with three clear peaks; the area beneath the curve is shaded in light gray. After the third and highest peak the curve drops to zero. At the point of decline, a dotted line goes up to a label above the last peak. To the right of this dotted line, the X-axis and the ticks on it are clearly thicker than the axis and the ticks to the left.] Y-axis: Activity Label: Deadline
[Caption beneath the panel:] If you need to conceal activity, try timing it to hide behind the tick marks on the graph axis.
389 notes
·
View notes
Note
I saw your DD graph asking for other ideas, so... if you still have any desire to do further Dracula graphs I'd be curious to see how the word count per character breaks down (not how much they speak but how much they write. Adding all their diary entries together, etc.). Obviously Mina wins by default from having typed up the whole novel but outside of that detail, how much did each person author?
Thank you so much for this ask! What an interesting data set this one is! Lots of unexpected information.
So first off, if you just want to visualize the author breakdown, ta-dahhhh!
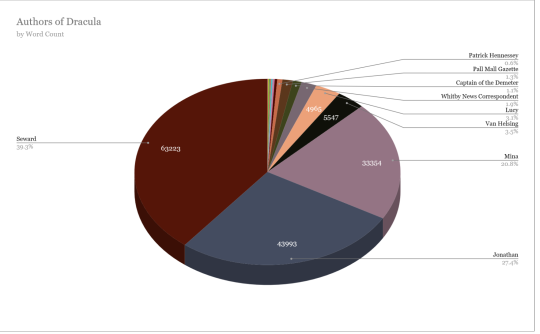
Seward was staunchly in the lead, talking his head off and burning through those wax recording drums like no ones business. Poor Mina for having to transcribe it all. In total his words made up 39.3% of Dracula. Nearly 40%!
Seward unsurprisingly had the most individual entries overall at 47, and had the longest streak for being the narrator in an entry at 10 days (09/02 - 09/11) with Mina following right behind at 9 days (08/10 - 08/19)
Mina surprisingly was 3rd overall both in word count and number of entries. She wasn't even in the top 3 for most words in a day which is as follows.
1 - Seward October 3rd - 9942 words
2 - Seward September 29th - 7206 words
3 - Jonathan October 3rd - 5944 words
Van Helsing only had 9 entries total but still came in number 4 for word count, in front of Lucy. It's interesting to note that the amount a person writes doesn't correlate to the amount of time they are being written about/appear. Which is why Arthur and Quincey don't even beat out the newspaper clippings for words, lol.
There are lots of authors we only hear from a single time, like Sister Agatha. So I've decided to make a small fry pie as well. (Authors under ~500 words)
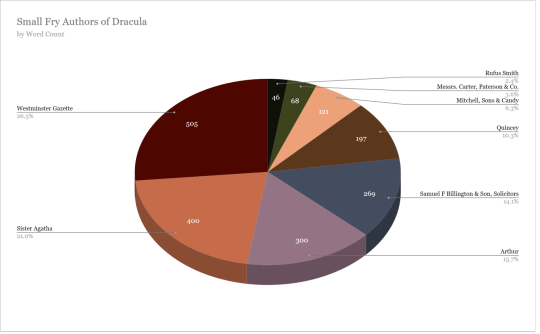
The captain of the Demeter and Van Helsing both had more days written than Lucy! Though I didn't break up number of entries, like when the log of the Demeter had 3 or 4 on one day or Lucy wrote a letter and in her diary.
If there is any data I haven't presented here that you're interested in feel free to tag me or shoot me an ask like this lovely person did!
#dracula daily#this took me 4 hours#potential spoiler#graphs#book data#word count#meta#averages#percentages#dracula daily tracker#dracula entry lengths#dracula authors#dracula meta#jonathan harker#mina harker#john seward#abraham van helsing#mina murray#lucy westenra#dracula#bram stoker#marketpeaches#arthur holmwood#van helsing
404 notes
·
View notes
Text
Made a graph
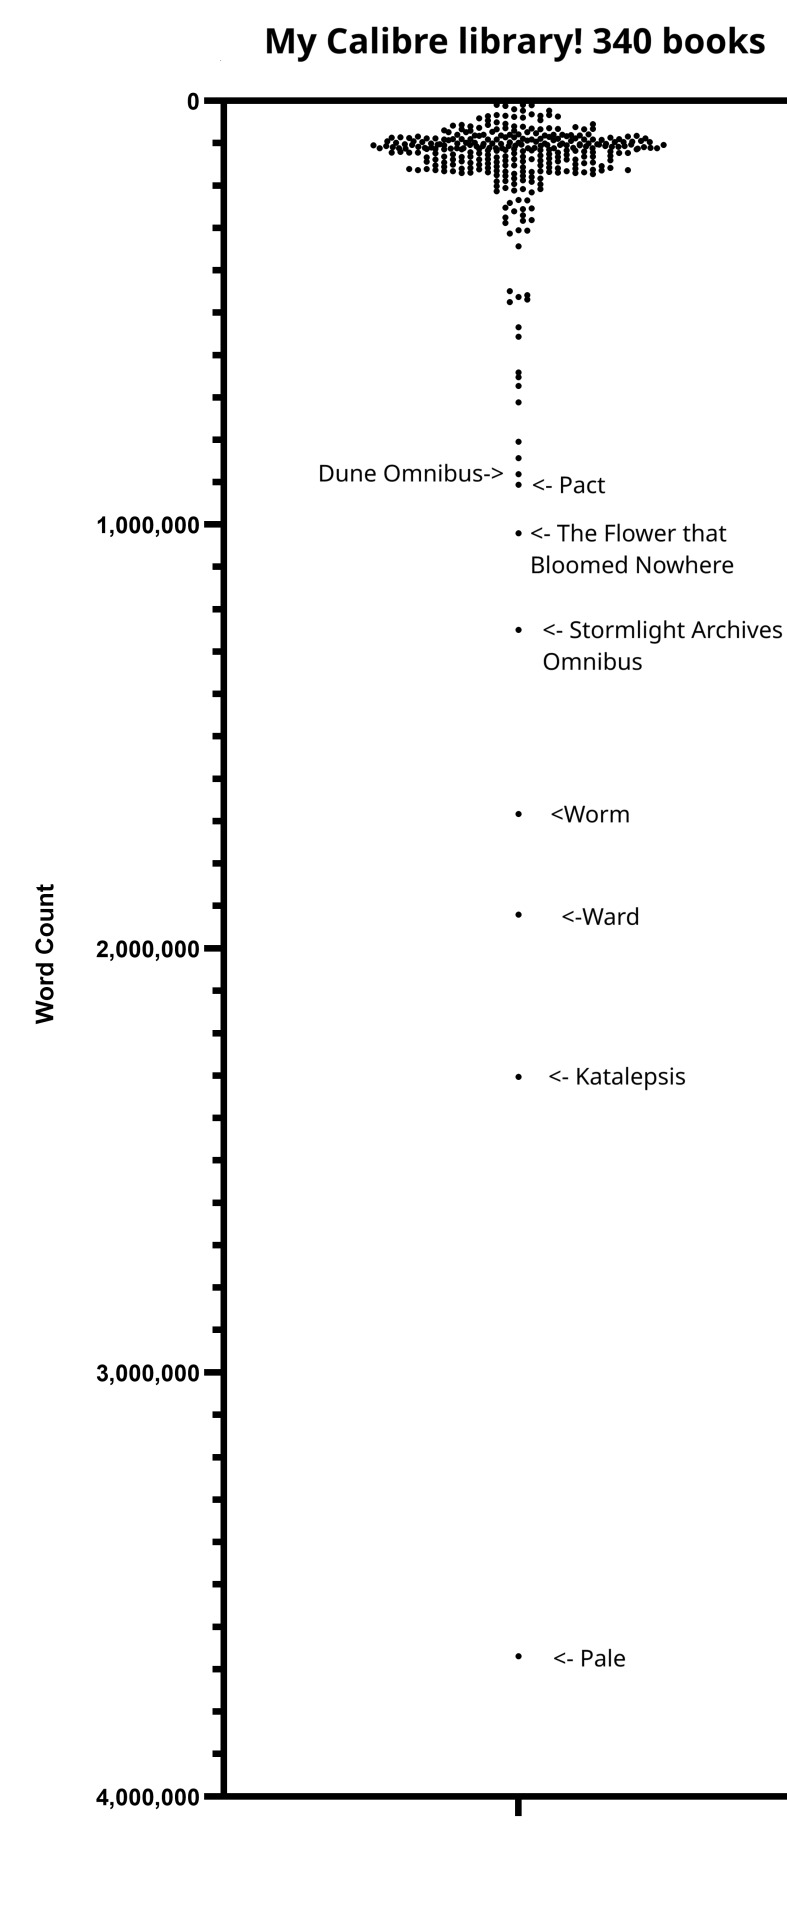
Pretty self-explanatory. These web serials are long...
86 notes
·
View notes
Text


I think we need to appreciate those silly graph things. (Graphs in question under the cut)


#my artwork#lmk#lego monkie kid#lmk macaque#lmk sun wukong#lmk mei#lmk red son#lmk mk#lmk ne zha#dynamic art#teir list#???#what are they called???#graphs#idk
37 notes
·
View notes
Text
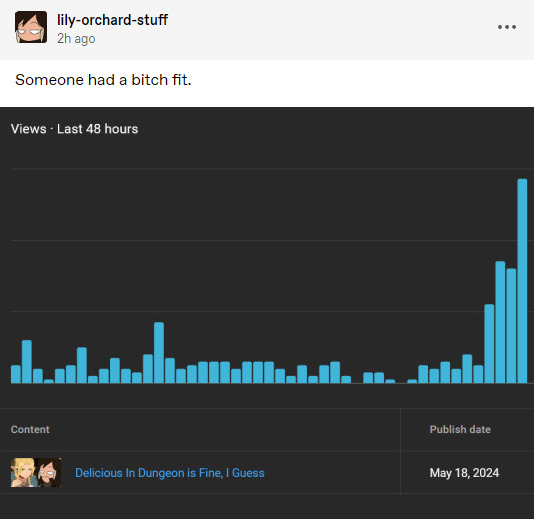
Show the Y-axis Lily.
This graph means nothing without view counts. Getting 8X the average daily view count for this video doesn't mean much if that average is 10 views/day. I'm just going to assume this is the case until you post a complete graph or the actual view counts.
Congrats on getting 80 people to watch your terrible video yesterday Lily! You're quite the YouTuber!
[Source]
#lily orchard critical#lily orchard#lilyposting#graphs#data presentation#statistics#Youtube#bad stats#the lily zone
95 notes
·
View notes