#Fibonacci pullback
Text
ETC and BCH Demonstrate Strength in the Face of Cryptocurrency Market Fluctuations
ETC’s surge above $30 signifies investor confidence, marking sustained growth within an upward trend channel. Amid Bitcoin’s downturn, BCH demonstrates resilience, charting a robust bullish path within an expanding channel. Identifying key Fibonacci pullback or support levels provides clear benchmarks for potential gains in Bitcoin Cash. In the ever-changing cryptocurrency market, Ethereum Classic (ETC) and Bitcoin Cash (BCH) have stood out as notable performers, each navigating market fluctuations with distinctive strengths. ETC's recent breakthrough above the $30 resistance level has fueled optimism, solidifying its position in a persistent upward trend channel. Meanwhile, BCH has showcased remarkable resilience, carving a strong bullish trajectory within an expanding channel despite Bitcoin's bearish undertones.
Ethereum Classic (ETC) has demonstrated sturdy growth, maintaining a steady climb within an ascending trend channel, signaling heightened investor confidence. The cryptocurrency recorded a 4.65% increase in the last 24 hours, closing at $29.54, with a market cap of $4,283,895,306, securing its rank at #21 in the market.
Technical analysis points to a positive signal from a rectangle formation, with a decisive break above the $30 resistance level. This breakout not only instilled confidence among investors but also suggested a continued upward path. ETC's resilience in the face of market volatility is highlighted by its 53.81% volume-to-market cap ratio, reflecting a healthy trading environment.
Turning our focus to Bitcoin Cash (BCH), the cryptocurrency witnessed an impressive 15.25% surge in the past 24 hours, closing at $292.25. This surge propelled BCH to the 18th position in market rankings, boasting a market cap of $5,731,492,869. BCH’s trading volume experienced a substantial increase, reaching $837,906,681, resulting in a volume-to-market cap ratio of 130.27%.
Technical indicators for Bitcoin Cash indicate a robust bullish momentum characterized by an upward expansion of channels. Notably, while Bitcoin (BTC) faced bearish trends, BCH exhibited resilience and emerged as a symbol of bullish sentiment. Investors were advised to approach cautiously, considering the late entry point into the bullish trend.
Waiting for a minor pullback at Fibonacci points or identifying support levels is a prudent strategy to manage risks. The target for BCH remained at the channel’s upper resistance or the previous high, providing investors with clear benchmarks for potential gains.
In summary, both Ethereum Classic and Bitcoin Cash delivered commendable performances, navigating the volatile crypto market with distinct strengths. Ethereum Classic's positive signal from breaking above $30 and its sustained upward trend channel indicated positive sentiment among investors. On the other hand, Bitcoin Cash's robust bullish momentum within an expanding channel underscored its resilience amid broader market challenges. As the cryptocurrency landscape evolves, these developments offer valuable insights for investors seeking strategic opportunities in the digital asset space.
#Ethereum Classic#ETC#Bitcoin Cash#BCH#cryptocurrency market#market volatility#investor confidence#upward trend channel#breakout#resistance level#bullish momentum#technical analysis#Fibonacci pullback#cryptotale
0 notes
Text
Will The Rally In GDX And SILJ Continue Or Consolidate?
Where has the time gone? Chris is sitting down with Craig Hemke at Sprott Money to talk about all things markets and precious metals.
Our discussion covered the following topics and questions:
What do you see on the equities charts? Is NVIDIA solely responsible for the markets continuing their climb?
What is the Bitcoin chart pointing to?
How do you manage the emotion of wanting to take the opposite side of a big move?
In one week, Gold and GDX have rocketed higher; is this a one-time pop, or will they continue to move higher?
Are pauses and pullbacks a good sign? Why is the .618 level so important in Fibonacci?
What do you see happening for silver?
What are some levels to watch for if people want to get into a GDX trade?
Watch The Interview Here
2 notes
·
View notes
Text
Ethereum’s Path Forward Post-ETH’s Elimination of ‘Pre-ETF Approval’ Profits
Key Points
Ethereum (ETH) experienced a significant price drop despite the anticipated launch of an ETF.
The decline was more severe than Bitcoin’s (BTC), baffling some market observers.
Despite the potential launch of an exchange-traded fund (ETF) by mid-July, Ethereum (ETH) wasn’t immune to the current market downturn.
The digital asset, which ranks second in terms of market capitalization, lost over $500 since July 1st. It fell from $3.4K to a low of $2.8K, negating all gains made after partial ETF approval in May.
Ethereum educator Sassal, however, argued that apart from potential outflows from Grayscale’s ETH trust, ETHE, there were no other bearish factors.
ETH’s Decline Surpasses BTC’s
Despite Sassal’s hopeful outlook, the recent market crash hit ETH harder than Bitcoin (BTC). At the time of writing, BTC had decreased by around 11% over the week, while ETH had declined by 14%.
This disproportionate drop surprised some traders, particularly given the upcoming launch of the ETH ETF. Some market analysts suggested that ETH’s steep fall was due to a lack of a compelling narrative. Another observer, Evans, proposed that the market was risk-averse and that potential ETHE outflows could impact the ETH ETF’s prospects.
Bearish Sentiment in the Market
In the meantime, ETH’s pullback reached the golden zone at the 61.8% Fibonacci retracement level, based on the 2024 lows and highs. Whether this support level holds could be influenced by Bitcoin’s next move.
The risk-averse sentiment among investors was further highlighted by negative outflows in the derivatives market. Since July 1st, ETH has experienced net outflows totaling $4.5 billion, emphasizing the bearish sentiment and potential tepid reception to the ETF launch.
A recent Bloomberg report suggested that the sentiment in the crypto market could only improve if the Federal Reserve becomes more dovish and implements one or two interest rate cuts.
0 notes
Text
Mastering Breakout Trading Strategies: A Comprehensive Guide

Breakout trading is a popular strategy employed by traders across various financial markets, from stocks and currencies to commodities and cryptocurrencies. The essence of breakout trading lies in capturing significant price movements that occur when an asset's price breaks out of a predefined range or pattern. In this comprehensive guide, we delve into the intricacies of breakout trading, exploring its principles, techniques, and practical applications for traders seeking to capitalize on market volatility and momentum.
Understanding Breakout Trading
Breakout trading revolves around the concept of identifying key levels of support and resistance, beyond which price tends to accelerate in a particular direction. These levels can manifest in various forms, including horizontal support/resistance lines, trendlines, chart patterns (such as triangles, rectangles, and wedges), or volatility-based indicators like Bollinger Bands. When prices break above resistance or below support, it signals a potential shift in market sentiment, triggering a surge in buying or selling activity.
Principles of Breakout Trading
Identification of Breakout Levels: The first step in breakout trading is identifying potential breakout levels based on historical price data and technical analysis. Traders look for areas where price has repeatedly failed to breach resistance or support levels, indicating the presence of significant buying or selling pressure.
Confirmation Signals: Breakout traders often wait for confirmation before entering positions. This confirmation can come in the form of a strong candlestick close above resistance or below support, accompanied by high trading volume, indicating conviction among market participants.
Risk Management: Effective risk management is crucial in breakout trading to mitigate potential losses. Traders typically place stop-loss orders below support or above resistance levels to limit downside risk in case of a false breakout.
Target Setting: Breakout traders set profit targets based on the magnitude of the breakout and the potential for further price movement. Some traders use technical analysis tools like Fibonacci retracements or extensions to identify potential price targets.
Types of Breakouts
Breakouts can be classified into several types based on the nature of the price movement and the underlying market conditions:
Continuation Breakouts: These occur within the context of an existing trend and signify a resumption of the prevailing trend. Traders look for price to break out in the direction of the trend, confirming its strength and momentum.
Reversal Breakouts: Reversal breakouts occur when price breaks out of a consolidation phase or a reversal pattern, signaling a potential reversal in trend direction. Traders anticipate a change in market sentiment and position themselves accordingly.
Volatility Breakouts: Volatility breakouts occur when price breaks out of a period of low volatility, indicating a potential expansion in price movement. Traders capitalize on increased volatility to capture short-term price swings.
Breakout Trading Strategies
Traders employ various strategies to capitalize on breakout opportunities, depending on their trading style, risk tolerance, and market conditions. Here are some common breakout trading strategies:
Classic Breakout Strategy: This strategy involves entering positions when price breaks out above resistance or below support levels. Traders wait for confirmation and then enter long or short positions, with stop-loss orders placed to manage risk.
Pullback Breakout Strategy: In this strategy, traders wait for a pullback or retracement after a breakout before entering positions. The pullback provides an opportunity to enter at a better price, with tighter stop-loss levels.
Breakout Retest Strategy: Traders wait for price to break out of a key level and then retest the breakout level as support or resistance. They enter positions on the retest, with stop-loss orders placed below support or above resistance.
Breakout with Volume Strategy: This strategy involves monitoring trading volume to confirm the validity of breakouts. Traders look for breakouts accompanied by above-average volume, indicating strong buying or selling interest.
Real-World Examples
To illustrate breakout trading in action, let's consider a couple of real-world examples:
Stock ABC: After consolidating in a tight range for several weeks, Stock ABC breaks out above resistance with a strong bullish candle and high trading volume. Traders who enter long positions on the breakout capitalize on the subsequent uptrend.
Currency Pair XYZ: In a downtrending currency pair XYZ, price breaks below a key support level with a sharp bearish candle and increased trading volume. Traders who enter short positions on the breakout profit from the continuation of the downtrend.
Conclusion
Breakout trading is a versatile strategy that allows traders to capitalize on significant price movements in the market. By identifying key levels of support and resistance and waiting for confirmation signals, breakout traders can position themselves to profit from market volatility and momentum. However, breakout trading is not without risks, and false breakouts can lead to losses if proper risk management techniques are not employed. With a deep understanding of breakout trading principles, strategies, and risk management techniques, traders can enhance their trading proficiency and achieve their financial goals in the dynamic world of financial markets.
0 notes
Text
This week, the price of gold is at the forefront of trading activity, with experts like James Stanley from Forex.com predicting a potential rise to $2,500. Stay updated on the latest Market trends and make informed investment decisions.
Click to Claim Latest Airdrop for FREE
Claim in 15 seconds
Scroll Down to End of This Post
const downloadBtn = document.getElementById('download-btn');
const timerBtn = document.getElementById('timer-btn');
const downloadLinkBtn = document.getElementById('download-link-btn');
downloadBtn.addEventListener('click', () =>
downloadBtn.style.display = 'none';
timerBtn.style.display = 'block';
let timeLeft = 15;
const timerInterval = setInterval(() =>
if (timeLeft === 0)
clearInterval(timerInterval);
timerBtn.style.display = 'none';
downloadLinkBtn.style.display = 'inline-block';
// Add your download functionality here
console.log('Download started!');
else
timerBtn.textContent = `Claim in $timeLeft seconds`;
timeLeft--;
, 1000);
);
Win Up To 93% Of Your Trades With The World's #1 Most Profitable Trading Indicators
[ad_1]
Gold prices have recently broken out of a falling wedge pattern, signaling a potential rally towards surpassing its all-time highs. According to James Stanley, a Senior Strategist at Forex.com, the movement of gold prices has been volatile lately, with prices hitting a high near $2,400 per ounce before experiencing a significant pullback. Despite this setback, gold managed to hold support above $2,300, creating a falling wedge pattern on the daily chart.
This week, another technical pattern emerged as a Fibonacci retracement showed inflections at different levels. The pullback from the high led to a rally followed by a pause at the 61.8% retracement level around $2,372.68. Subsequent price movements have shown support at the 38.2% retracement level, indicating bullish momentum in the Market.
Looking ahead, there is speculation on whether gold prices will close above the $2,400 level, a key resistance point. If achieved, gold could target $2,417 and $2,431 before rallying towards $2,500 per ounce and beyond. Despite forming a triple top pattern just below $2,400, gold prices experienced a minor decline, trading at $2,376.42 at the time of writing.
Overall, the outlook for gold remains positive, with potential for further upside as investors closely monitor key resistance levels. However, it is important to note that the views expressed in this article are solely the author's, and readers should exercise caution when making financial decisions based on this information.
Win Up To 93% Of Your Trades With The World's #1 Most Profitable Trading Indicators
[ad_2]
1. What is the current price of gold?
The price of gold is $2,500 this week.
2. Why is gold in play this week according to Forex.com’s James Stanley?
Forex.com's James Stanley believes that gold is in play this week due to Market conditions and potential economic indicators.
3. Should I invest in gold this week?
It depends on your individual financial goals and risk tolerance. It is always recommended to consult with a financial advisor before making any investment decisions.
4. How can I track the price of gold throughout the week?
You can track the price of gold through financial news websites, trading platforms, and by following experts like James Stanley on Forex.com.
5. Is it a good time to buy or sell gold?
The decision to buy or sell gold should be based on your own research, Market analysis, and financial goals. Consider factors such as Market trends, geopolitical events, and economic data before making a decision.
Win Up To 93% Of Your Trades With The World's #1 Most Profitable Trading Indicators
[ad_1]
Win Up To 93% Of Your Trades With The World's #1 Most Profitable Trading Indicators
Claim Airdrop now
Searching FREE Airdrops 20 seconds
Sorry There is No FREE Airdrops Available now. Please visit Later
function claimAirdrop()
document.getElementById('claim-button').style.display = 'none';
document.getElementById('timer-container').style.display = 'block';
let countdownTimer = 20;
const countdownInterval = setInterval(function()
document.getElementById('countdown').textContent = countdownTimer;
countdownTimer--;
if (countdownTimer < 0)
clearInterval(countdownInterval);
document.getElementById('timer-container').style.display = 'none';
document.getElementById('sorry-button').style.display = 'block';
, 1000);
0 notes
Text
Market Comment
Back for a 2nd test of the Mood Report Fibonacci confluence zone (5296.44-5325.55).

As a reminder, sustained trade above this area shifts the focus, for me, from a B-wave scenario to a third-wave continuation of a rising wedge scenario (from the Covid 2020 low) with a 4th-wave pullback and subsequent 5th-wave culmination rally to follow possibly sometime in 2025.
For any sentiment junkies, check out this handy Papi Steak Fountainbleau Las Vegas real-time social mood indicator.
People going insane over 55oz. of MS9+ Australian Purebred Wagyu Tomahawk for $1000.
Social mood reverberations of investors going insane over the possibility of rate cuts.
0 notes
Text
Secret Coin Forms a Bullish Pennant With a Potential Target of $0.95
Secret Coin has recently shown bullish momentum, forming a bullish pennant pattern and reaching a weekly high of $1.118 before seeing a slight pullback. Currently trading at $0.8554, it's anticipated to maintain its upward trajectory, supported by strong bullish levels around $0.95.
With an 11.24% surge in the last 24 hours and a trading volume of $8,096,422 USD, Secret is positioned above the 21-day moving average but below the 50-day moving average. The Fibonacci retracement suggests a bullish zone with a target around $0.95, although traders should exercise caution as a potential bearish trend looms.
On the 4-hour chart, Secret displays a solid uptrend, marked by higher highs and higher lows, indicating bullish dominance. Long positions are favored, with a potential target of $0.8804, contingent upon maintaining support at the rising trend line.
Technical indicators, including RSI, MACD, and Stochastic oscillator, all signal further upward momentum, affirming the bullish outlook. However, hourly analysis reveals stagnant price action within a range of $0.7887 to $0.8113, with strong support at the lower end. A breakdown below this support could signal a bearish trend towards $0.7487 and $0.6926.
In summary, Secret Coin appears poised to continue its bullish run towards $0.95, supported by key levels at $0.8113 and $0.7887, with resistance at $1.05. Traders are advised to monitor these levels closely to capitalize on potential profit opportunities.
0 notes
Text
Identifying the Cup and Handle Pattern on Price Charts
The cup and handle pattern is a popular technical analysis pattern used by traders to identify potential bullish continuation patterns in price charts. It consists of two main components: the cup, which resembles a rounded bottom, and the handle, which forms a smaller consolidation pattern near the highs of the cup. Here's how to identify the cup and handle pattern on price charts:
1. Formation of the Cup:
The cup portion of the pattern typically begins with a downtrend, as prices decline.
As the downtrend exhausts, prices gradually start to reverse and form a rounded bottom, resembling a "cup" shape.
The cup should exhibit smooth and rounded price action, indicating a gradual transition from selling pressure to buying pressure.
The depth and duration of the cup can vary, but it should generally span several weeks to months.
2. Formation of the Handle:
After the cup formation, prices may experience a minor pullback or consolidation phase, forming the handle of the pattern.
The handle is characterized by lower trading volume and narrower price swings compared to the cup.
It typically takes the shape of a smaller, downward-sloping price channel or a sideways consolidation pattern.
The duration of the handle is usually shorter than that of the cup, typically spanning several days to a few weeks.
3. Breakout Confirmation:
The cup and handle pattern is considered complete when prices break out above the resistance level formed by the highs of the cup.
This breakout is accompanied by increased trading volume, indicating renewed buying interest and potential continuation of the uptrend.
Traders often look for a decisive breakout with a strong close above the resistance level to confirm the pattern's validity.
4. Volume Analysis:
Volume analysis plays a crucial role in confirming the cup and handle pattern.
During the formation of the cup, trading volume tends to decline as prices stabilize and begin to reverse.
In the handle formation, volume should contract further, signaling reduced selling pressure and potential accumulation by buyers.
A breakout accompanied by above-average volume adds credibility to the pattern and increases the likelihood of a sustained uptrend.
5. Price Targets:
Traders often use the height of the cup as a price target for the breakout move.
To calculate the price target, measure the distance from the lowest point of the cup to the highest point and add it to the breakout level.
Additionally, some traders use Fibonacci extensions or other technical analysis tools to identify potential price targets beyond the initial target.
Conclusion:
Identifying the cup and handle pattern on price charts requires careful observation of price action, volume trends, and pattern characteristics. While the pattern can signal bullish continuation, traders should always use additional confirmation signals and risk management techniques before making trading decisions based on technical patterns alone.
0 notes
Text
🌟 Dive Deep Into the World of Pullbacks 🌟
Discover the art of trading with our quick guide on pullbacks! A pullback is that crucial pause in the price trend, offering traders a golden chance to enter the market under favorable conditions. 📉➡️📈
Pullbacks are the market's way of catching its breath before continuing its trend, providing a strategic entry point for savvy investors. Whether in an uptrend or downtrend, recognizing a pullback is key to trading success. 🔄
🔍 Identifying a Pullback:
- Look for temporary reversals against the current trend.
- Observe trading volume; lower volume indicates a typical pullback.
- Employ technical tools like moving averages and Fibonacci retracements for precision.
Seize the moment with pullbacks to align your trades perfectly with the market's rhythm, optimizing your entry and exit points for maximum gains. 🚀
👉 Ready to master pullbacks and refine your trading strategies? Join us in unraveling the mysteries of market dynamics!
#TradingTips #PullbackPower #InvestingBasics #MarketMastery #TradeWise #FinancialEducation #SmartInvesting #TechnicalAnalysis #ForexLife #StockMarketInsights #CryptoCurrency #DayTrading #SwingTrading #MarketTiming #WealthBuilding #RiskManagement #TradingPsychology #PriceAction #FinancialMarkets #EconomicIndicators #InvestmentStrategy #TradingTools #MarketVolatility #FinancialGoals #ProfitMaking #TradingCommunity #FinancialWellness #WealthMindset
0 notes
Text
Bitcoin's Future Soars: Gert van Lagen Envisions Historic Climb to $200,000
Bitcoin's recent surge toward the $200k mark has captivated the cryptocurrency community, fueled by the insightful analysis of Gert van Lagen. Since November 2022, Bitcoin's price has been on an impressive climb, drawing attention to historical patterns and current market dynamics that suggest this surge may be more than just speculative.
Van Lagen highlights the current parabolic rise, drawing comparisons to previous fifth subwaves and emphasizing their consistent meeting with the blue trendline in a dramatic, parabolic fashion. While such patterns are familiar to seasoned Bitcoin watchers, the unprecedented scale this time has stirred anticipation and speculation within the market.
The looming Bitcoin halving introduces an intriguing element. Despite historical norms of significant post-halving price movements, Bitcoin's current performance has defied expectations by surpassing the 78.6% Fibonacci retracement level of the last bear market. This level, historically signaling a takeoff point, prompts questions about whether the market will adhere to past patterns or forge a new trajectory.
Van Lagen also ties Bitcoin's fate to the overall market sentiment, emphasizing the close relationship between Bitcoin and the S&P 500 since late 2021. With stock market enthusiasm reaching new heights, Bitcoin's surge appears to resonate with this positive sentiment.
The latest Bitcoin data supports van Lagen's bullish outlook, with the cryptocurrency trading at $55,976.77 at the time of press, reflecting an 8.99% increase over the last 24 hours. Its market cap has breached the $1 trillion mark, and the trading volume in the last 24 hours reached nearly $47.8 billion.
However, caution is warranted as technical indicators, such as the RSI and MACD, suggest potential overbuying. The RSI, at 82.82, indicates the possibility of a short-term correction, even as the MACD confirms strong bullish momentum. Traders are advised to remain vigilant for a possible pullback, recognizing the intricate nature of current market dynamics.
As Bitcoin eyes the significant $200k milestone, the community acknowledges the complexity of its surge, influenced by both historical precedence and evolving market dynamics.
0 notes
Text
Bitcoin and Ethereum Poised for Record-Breaking Highs in 2024
Sohrab, a passionate cryptocurrency news writer, predicts that Bitcoin and Ethereum are set to reach record-breaking highs in 2024. As Bitcoin surpasses $52,000 and Ethereum reaches $2,800, the market sentiment is extremely bullish. The upcoming Bitcoin Halving in 2024 is expected to further boost its price.
With Bitcoin showing no signs of a pullback, the BTC price trend is dominated by the buying side. The weekly chart shows an uptrend of 22% in the last two candles, and the MACD indicator indicates increasing momentum. The next resistance levels for Bitcoin are at $55,000 and $65,000, with a potential jump to $96,000 according to Fibonacci retracement levels.
Ethereum, the second biggest cryptocurrency, is also experiencing a demand boost. With the growth of decentralized finance (DeFi) and the buzz around an Ethereum ETF, the coast is clear for a bull run. The ETH price has jumped by 23% in the last ten days, and the current price is challenging the 50% Fibonacci level. If buyers reclaim this resistance, Ethereum could test $3,000 and potentially reach $3,200 by the end of the month.
With the crypto market gaining momentum, investors and enthusiasts are keeping a close eye on Bitcoin and Ethereum. Check out the original article for more details.
Read the original article
0 notes
Text
Ethereum Price Analysis: Long-Term Resistance and Short-Term Challenges
Ethereum's Journey Beyond Fibonacci Resistance
Stay updated on the latest Ethereum updates and cryptocurrency market analysis as Ethereum breaks through long-term Fibonacci resistance, signaling potential bullish momentum.
Breakthrough and Challenges
Explore Ethereum's recent breakthrough above the Fibonacci resistance line and its subsequent challenges. While Ethereum closed above the resistance, short-term Fibonacci levels have hindered further growth, prompting a closer look at market dynamics.
Technical Insights and Analyst Views
Gain insights from technical analysis as Ethereum's price movement interacts with Fibonacci levels. Discover perspectives from crypto analysts, including predictions of a bullish trend continuation and cautionary notes about potential selling pressure from Ethereum co-founder's asset movements.
Chart Analysis and Future Trajectory
Analyze Ethereum's price trajectory based on chart patterns and Fibonacci retracement levels. Assess potential scenarios, including a bullish breakout towards $3,000 or a pullback towards intermediate support levels, and understand the implications for traders and investors.
Risk Management and Disclaimer
Understand the importance of risk management in crypto investments and stay informed about market trends and price forecasts. Remember to conduct thorough research and exercise caution when making investment decisions.
Read the full article
#Altcoinscomparison#Bitcoinvs.Ethereum#CryptocurrencyConferences#Cryptocurrencyinvestmenttips#Cryptocurrencywallets#Exchangesecuritymeasures#Fundamentalanalysis#ICOreviews#Interviewswithindustryexperts#Long-termvs.short-terminvestments#Marketforecasts#Meetupsandevents#Newblockchainstartups#Portfoliodiversification#Privacy-focusedcryptocurrencies#Projectpartnerships#RegulatoryUpdates#Riskmanagementincrypto#Stablecoinsoverview#TechnicalAnalysis#Tokensales#Two-factorauthentication(2FA)
0 notes
Text
What to expect from the stock market this week

Last week, the review of the macro market indicators saw with the January options expiration in the books, equity markets showed strength with both the large cap S&P 500 and Nasdaq 100 closing at new all-time highs. Elsewhere looked for Gold ($GLD) to continue its pullback in the uptrend while Crude Oil ($USO) consolidated in a narrow range. The US Dollar Index ($DXY) continued to bounce to the upside while US Treasuries ($TLT) remained in their downtrend. The Shanghai Composite ($ASHR) looked to continue its trend lower while Emerging Markets ($EEM) consolidated over long term support.
The Volatility Index ($VXX) looked to remain very low and stable making the path easier for equity markets to the upside. The charts of the $SPY and $QQQ looked strong, especially on the longer timeframe. On the shorter timeframe both the QQQ and SPY had reset momentum measures and both were very strong. The $IWM remained the exception bouncing around in a range that has held it for almost 2 years.
The week played out with Gold continuing lower, but slowing the pace, while Crude Oil broke the consolidation range to the upside. The US Dollar held in a tight range while Treasuries slowed their pace on the move lower as well. The Shanghai Composite soared following a Government stimulus package while Emerging Markets held in a tight range in consolidation. Volatility held on the lower edge of the teens, ending little changed.
This continued the tailwind for equities and they started the week moving higher. The IWM settled into a range after Monday, while the QQQ stalled after Wednesday with the SPY continuing higher all week. This resulted in the SPY ending at an all-time highs with the QQQ just off its Wednesday high print. The IWM remained in the 18 month consolidation. What does this mean for the coming week? Let’s look at some charts.
SPY Daily, $SPY
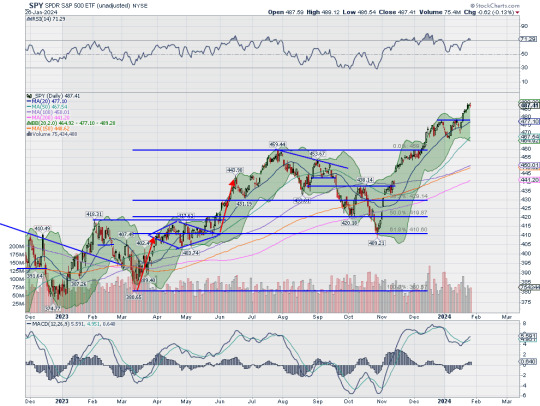
The SPY came into the week at an all-time high. It continued to move higher all week, printing new highs Monday through Thursday, before profit taking Friday afternoon saw the streak end. The daily chart shows the march higher along the open Bollinger Bands® after breaking short term resistance. The RSI is edging into overbought territory in the bullish zone with the MACD crossed back up, rising and positive.
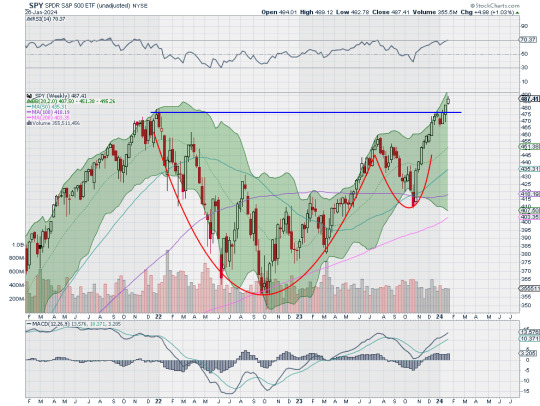
The weekly chart has now printed a Three Advancing White Soldiers pattern showing continuation. There is the 161.8% Fibonacci extension of the retracement of the 2023 pullback nearby at 490.50 and 200% extension at 509.67. It also has a target on a Cup and Handle pattern to 560. The RSI on this timeframe is strong in the bullish zone with the MACD positive and rising. There is no resistance above 488. Support lower comes at 478 and 473.50 then 470 and 466 before 463.50 and 460. Uptrend.
SPY Weekly, $SPY
With just 3 trading days left in January, equity markets look ready to finish the month higher. Elsewhere look for Gold to continue its pullback while Crude Oil reverses higher. The US Dollar Index looks to drift sideways in consolidation while US Treasuries continue their downtrend. The Shanghai Composite looks to extend the bounce to the upside while Emerging Markets continue in consolidation.
The Volatility Index looks to remain very low and stable making the path easier for equity markets to the upside. The charts of the SPY and QQQ look strong, especially on the longer timeframe. On the shorter timeframe both the QQQ and SPY could end up rolling over to reset momentum measures as both are extended. If that happens it might be time for the IWM to finally take the lead and test the 20 month channel consolidation. Use this information as you prepare for the coming week and trad’em well.
Join the Premium Users and you can view the Full Version with 20 detailed charts and analysis: Macro Week in Review/Preview January 26, 2024
0 notes
Text
Digifinex Labs: SOL Price Resumes Rally, Potential 20% Pump Ahead

Key Points:
SOL price began a fresh rally, surpassing the $68 resistance against the US Dollar.
The current trading level is above $68 and the 100 simple moving average (4 hours).
A significant bullish trend line is taking shape with support around $65.50 on the 4-hour chart of the SOL/USD pair (data sourced from Kraken).
SOL has gained nearly 10%, indicating the possibility of a further rally beyond the $75 resistance zone.
In recent days, Solana experienced a corrective pullback from the $77.75 region, similar to Bitcoin and Ethereum, dropping below the $75 and $70 support levels.
However, strong bullish activity emerged above the $65 support, forming a low around $63.78. The current price action suggests a renewed upward movement, breaking above the $68 and $70 resistance levels. The price has increased by almost 10%, surpassing the 50% Fibonacci retracement level of the downward move from the $77.72 high to the $63.78 low.
SOL is now trading above $68 and the 100 simple moving average (4 hours). Additionally, a notable bullish trend line is developing, providing support around $65.50 on the 4-hour chart for the SOL/USD pair.
Get your $550
Registering DigiFinex now grants you a newcomer’s package worth $550: Click to register
0 notes
Text
Trader Pearl's Insights, Chart Patterns, and Strategies for Mastering Swing Trading
Trader Pearl's Insights, Chart Patterns, and Strategies for Mastering Swing Trading
A well-liked trading technique called swing trading seeks to profit from short- to medium-term price changes that occur within a trend. Swing trading entails holding positions for a few days or weeks, in contrast to day trading, which entails completing trades in a single day. This piece will explore the realm of swing trading, going over different approaches, stressing the significance of chart patterns, and presenting Trader Pearl—a priceless tool for would-be traders.
Strategies for Swing Trading:
1. Trend Following: - Use technical analysis tools to determine the dominant trend.
- To profit from price momentum, enter trades in the trend's direction.
- For trend confirmation, use momentum indicators, trendlines, and moving averages.
2. Trading Countertrends: - Recognize overbought or oversold market circumstances.
- To identify possible reversals, use oscillators such as the stochastic oscillator and the relative strength index (RSI).
- Use caution when executing trades that deviate from the dominant trend.
3. Breakout Trading: - Determine pivotal levels of support and resistance.
- When the price breaks through these levels, suggesting a possible continuation of the trend, execute trades.
- Put risk management strategies into practice to reduce false positives.
4. Pullback Trading:- Watch for a price retracement inside an established trend.
- To ride the continuation of the trend, enter trades at advantageous levels.
- To find possible entry points, use moving averages and Fibonacci retracement levels.
Chart Patterns' Function:
1. Head and Shoulders:- Signifies a reversal in the trend.
- Once the neckline is broken, entry takes place.
2. Double Tops and Bottoms:- Indicates a possible reversal in the trend.
- Admission following verification of the design.
3. Ascending, Descending, Symmetrical Triangles: - Patterns of signal continuation.
- Entry after the triangle breaks or emerges.
Handle and Cup:- This suggests a bullish continuation.
- Entry following the formation of the handle.
Trader Pearl: Your Passport to Expert Trading:
A comprehensive platform called [Trader Pearl] was created to give traders the information, perspective, and resources they need to trade profitably. A sample of what Trader Pearl has to offer is this:
1. Educational Resources: - Comprehensive classes that cover a range of trading topics, from basic to advanced.
- Live sessions and webinars with seasoned traders.
meetings and conversation forums.
Trading Insights and Case Studies
- Gain knowledge from seasoned traders via interviews, case studies, and insights.
- Recognize the attitude and tactics that result in successful trading.
Final Thought:
The dynamic strategy of swing trading necessitates the integration of risk management, technical analysis, and ongoing education. Incorporating chart patterns and utilizing tools such as Trader Pearl can help traders improve their abilities and raise their chances of success in the constantly changing financial markets. Recall that profitable swing trading is only one aspect of successful swing trading; another is cultivating a methodical and knowledgeable approach to the markets
0 notes
Text
Shiba Inu was likely to recede further down the price charts
A bounce, although unlikely based on the evidence at hand, could provide short-sellers a better entry
Shiba Inu [SHIB] reached an impressive milestone of 3 million transactions on its L2 Shibarium. Yet, investor sentiment was bearish as the memecoin slipped below an HTF support zone. The lower timeframes were not very encouraging either.
Read Shiba Inu’s [SHIB] Price Prediction 2023-24
A previous price report from AMBCrypto dated 9 October stressed that the memecoin had overstayed at the crucial support zone at $0.0000072. It suggested that a move below $0.00000713 could see an extended pullback, which was in progress at press time.
The fair value gap could be vital, but will we see a bounce?
Source: SHIB/USDT on TradingView
The H4 market structure of Shiba Inu was strongly bearish. The Relative Strength Index (RSI) was at 27 and signaled hefty downward momentum. The On-Balance Volume (OBV) was in a downtrend in October, and the Chaikin Money Flow (CMF) has often dipped below -0.05. This indicated significant capital flow out of the SHIB market.
The red box from $0.000007 to $0.0000076 represented a bearish breaker block on the 1-day chart. The recent drop below $0.000007 meant the bears were firmly in the driving seat. The H4 fair value gap (white box) has confluence with the 61.8% Fibonacci retracement level.
It was unclear if we would get a bounce to the Fair Value Gap (FVG) at $0.000007. If we do, bears can look for shorting opportunities targeting the 23.6% southward extension level at $0.0000066.
The short-term market sentiment pointed to further losses- does the order flow indicate otherwise?
Source: Coinalyze
The Funding Rate slipped slightly into negative territory in recent hours. The prices continued to slip lower and the Open Interest (OI) was also steadily falling. This reflected bearish sentiment had a slight edge in the market.
Source: MobChart
Data from MobChart showed a $226k limit buy order just below prices, with an almost equally big sell order to the north. The order flow didn’t strongly support the idea of a bounce, but the removal of sell orders above SHIB could spur prices higher.
Is your portfolio green? Check the Shiba Inu Profit Calculator
Yet, with Bitcoin [BTC] below the $27k mark, it was also possible that the crypto market could see its recent losses accelerate. Therefore, SHIB buyers can’t bet on a bounce, but neither can short-sellers enter right away. Risk-averse traders can benefit from waiting and watching.
0 notes
Last Seen Blogs

kiwiswap-blog
Без названия

accessible-art
Described Visual Art

a-ii
sniffles

angellyslion
Angelly

agency20clickk
사이트토토사이트🖊️ SUM22。COM 🖊️더블유바