#CloudMonitoring
Explore tagged Tumblr posts
Visit Tumblr Blog
Explore Tumblr blogs with no restrictions, modern design and the best experience.
Last Seen Tumblr Blogs


Fun Fact
In 2020, 27% of US Tumblr users had an annual household income of over $100,000.
Text
Modern Application for L&T Hydrocarbon | IFI Techsolutions
We successfully enabled Azure migration with SSO & hybrid configuration, along with CI/CD & monitoring, which doubled application efficiency and security.
#AzureAppService#SQLManagedInstance#AzureDevOps#CI/CD#AppServiceAutomation#ScalableArchitecture#CloudMonitoring#IFITechsolutions#MicrosoftSolutionsPartner#MicrosoftPartner
0 notes
Text
instagram
0 notes
Text
Cloud Monitoring là gì? Giải pháp giám sát hệ thống đám mây hiệu quả
Cloud Monitoring là quá trình theo dõi, thu thập và phân tích dữ liệu hoạt động của hệ thống đám mây nhằm đảm bảo hiệu suất, bảo mật và khả năng phản hồi nhanh khi xảy ra sự cố. Đây là công cụ không thể thiếu giúp doanh nghiệp vận hành hạ tầng cloud một cách chủ động và thông minh.
Đọc chi tiết: Cloud Monitoring là gì?

0 notes
Text

#PollTime
Which IT service is most critical for uptime?
A) Database Management 💾
B) OS Management 🖥️
C) Middleware Support 🔌
D) Cloud Monitoring 🌍
Comments your answer below👇
💻 Explore insights on the latest in #technology on our Blog Page 👉 https://simplelogic-it.com/blogs/
🚀 Ready for your next career move? Check out our #careers page for exciting opportunities 👉 https://simplelogic-it.com/careers/
#itcompany#dropcomment#manageditservices#itmanagedservices#poll#polls#informationtechnology#databasemanagement#osmanagement#middlewaresupport#cloudmonitoring#itserviceprovider#managedservices#testyourknowledge#makeitsimple#simplelogicit#simplelogic#makingitsimple#itservices#itconsulting
0 notes
Text
OCI Managed Services Solutions
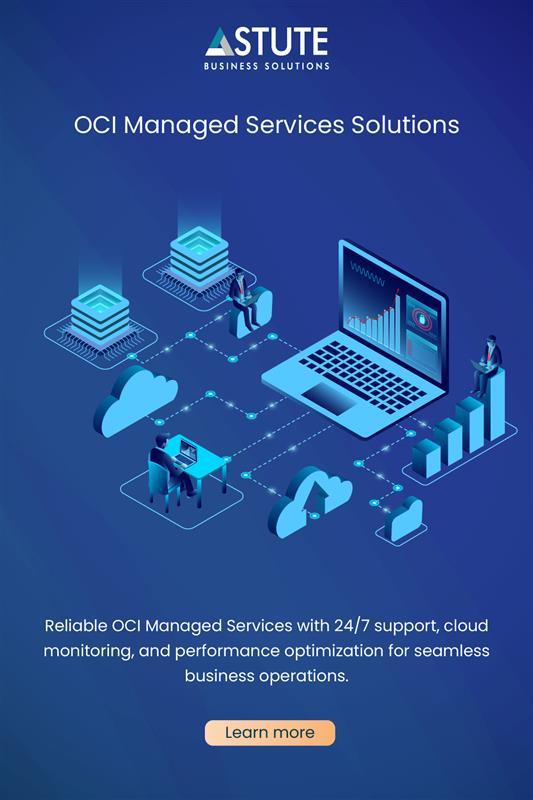
Reliable OCI Managed Services with 24/7 support, cloud monitoring, and performance optimization for seamless business operations.
0 notes
Text
Your Azure Environment Deserves Full Visibility
If you're managing apps in Azure without real-time latency data… you're flying blind.
See what’s slowing you down with: ✅ Real-time Azure latency monitoring ✅ Cross-region testing ✅ Actionable insights in one dashboard
🎯 Get a performance edge
0 notes
Text
#VIAVI Solutions#analytics#automation#network#EdgeComputing#CloudMonitoring#AI#NetworkSecurity#DigitalTransformation#electronicsnews#technologynews
0 notes
Text
Cloud Observability Solutions: Key Components and Use Cases
As organizations transition to the cloud, the complexity of managing and optimizing cloud infrastructure increases. To ensure seamless performance, security, and scalability, cloud observability solutions have become indispensable. These tools provide real-time visibility into cloud-based environments, allowing businesses to monitor, analyze, and optimize their cloud operations. With the growing demand for effective cloud management, the Cloud Observability Solutions Market Forecast predicts a significant rise in adoption, as businesses strive for greater efficiency and control over their cloud resources.
Key Components of Cloud Observability Solutions
Cloud observability is built upon several core components that allow organizations to collect, process, and analyze data from various cloud environments. These components work together to provide a comprehensive view of system performance and health.
Metrics Collection Metrics form the foundation of any observability solution. Cloud observability tools continuously gather data from cloud services, virtual machines, containers, and other infrastructure components. These metrics provide critical insights into resource utilization, response times, system health, and performance bottlenecks. The ability to track performance in real-time helps IT teams identify issues before they affect users.
Logs Management Logs are another vital element of cloud observability. They capture events, transactions, and error messages from applications and services running in the cloud. By aggregating and analyzing logs, cloud observability solutions can provide deeper context and understanding of system behaviors, uncovering hidden performance issues or security threats. Logs help in diagnosing problems quickly and accurately, ensuring faster resolution.
Distributed Tracing Distributed tracing is especially useful for microservices architectures, which have become common in cloud environments. It traces requests as they move through different services, providing a complete view of their journey. This helps identify where delays or errors occur in the chain of interactions. Distributed tracing enables organizations to pinpoint the root cause of issues in complex cloud-based systems, enhancing troubleshooting and performance optimization.
Alerting and Automation To ensure timely action on issues, cloud observability solutions include alerting and automation capabilities. When predefined thresholds are breached—whether it’s resource consumption, downtime, or response times—alerts are triggered. This ensures that IT teams are immediately notified of potential problems. Automation takes this a step further, allowing responses to certain conditions to be triggered automatically, such as scaling resources or restarting services. By combining proactive monitoring with automated actions, cloud observability minimizes downtime and optimizes cloud performance.
Analytics and Dashboards A robust analytics engine is essential for interpreting the vast amounts of data collected by observability tools. Through advanced analytics, businesses can visualize trends, identify anomalies, and perform in-depth investigations into the performance and security of their cloud infrastructure. Dashboards provide a centralized view of key metrics, enabling stakeholders to make informed decisions based on real-time insights.
Use Cases of Cloud Observability Solutions
Cloud observability solutions have a wide range of applications across various industries. The flexibility and scalability of cloud observability tools make them ideal for managing complex cloud environments. Below are a few use cases that demonstrate the value of these solutions.
Performance Optimization Performance is critical to ensuring a positive user experience. By continuously monitoring cloud resources, organizations can track performance bottlenecks and optimize resource usage. Cloud observability solutions help detect slowdowns, high latency, and application failures before they impact end users. This proactive approach enables businesses to maintain high levels of service availability and reliability.
Security and Compliance Monitoring Security is a top priority in cloud environments. Cloud observability solutions help organizations stay ahead of potential security threats by identifying unusual patterns or unauthorized access attempts. By monitoring logs and metrics in real-time, businesses can detect anomalies indicative of cyberattacks, such as data breaches or denial-of-service attacks. Additionally, observability tools can support compliance efforts by tracking regulatory requirements and generating audit trails.
Cost Optimization As businesses scale their cloud operations, managing cloud costs becomes increasingly challenging. The Cloud Observability Solutions Market Forecast indicates that many businesses are using observability tools to track resource consumption and optimize spending. By gaining deeper visibility into cloud usage patterns, organizations can identify unused or underutilized resources and reallocate them to reduce unnecessary costs. This optimization helps businesses maximize the return on investment from their cloud infrastructure.
Incident Management and Troubleshooting In a cloud environment, incidents can arise unexpectedly. Cloud observability solutions provide real-time insights into incidents as they happen, allowing IT teams to resolve issues quickly and efficiently. Whether it’s a network outage, a server crash, or a performance degradation, observability tools ensure that teams have all the necessary data to diagnose and fix problems. This results in reduced downtime and a more seamless user experience.
Scalability and Infrastructure Management Cloud observability solutions enable businesses to manage the scalability of their cloud environments efficiently. By monitoring usage patterns and trends, organizations can automatically scale resources up or down based on demand. This ensures that businesses are always operating at peak performance without over-provisioning, leading to cost savings and improved resource management.
Conclusion
Cloud observability solutions are crucial for organizations looking to maximize the potential of their cloud environments. By providing comprehensive monitoring, real-time analytics, and proactive alerting, these solutions help businesses optimize performance, reduce costs, and ensure security. As the Cloud Observability Solutions Market Forecast predicts continued growth in the adoption of cloud observability tools, companies like QKS Group are playing a pivotal role in delivering advanced solutions that meet the dynamic needs of the cloud era. By embracing observability, organizations can stay ahead of the curve and drive greater efficiencies in their cloud infrastructure.
#CloudObservability#ObservabilitySolutions#CloudMonitoring#PerformanceOptimization#CloudAnalytics#ITInfrastructureManagement#DigitalTransformation
0 notes
Text
Azure Managed Services Monitoring Compliance - Beehive Software
IFI Managed Services offers Microsoft Defender for Storage as Azure-native security solution to detect threats and sent alerts while helping from attacks.
#AzureSecurity#CloudCompliance#DataProtection#ThreatDetection#ManagedServices#HybridCloud#MicrosoftSentinel#CyberSecurity#CloudMonitoring#IFITechsolutions#MicrosoftSolutionsPartner
0 notes
Text
Best infrastructure monitoring tools for 2024
🔍 Looking to optimize your IT infrastructure in 2024? Discover the top infrastructure monitoring tools that can keep your systems running smoothly and efficiently! 🚀 From real-time analytics to AI-powered insights, these tools are a must-have for tech teams. 🖥️

👉 Explore the full list here: https://thevirtualupdate.com/best-infrastructure-monitoring-tools-for-2024/
#InfrastructureMonitoring#ITTools#Tech2024#SystemMonitoring#NetworkManagement#ITSolutions#TechInnovation#DevOps#CloudMonitoring#ITInfrastructure
0 notes
Link
#DataCenterMonitoring#NetzwerkMonitoring#ITInfrastruktur#ASCENDGmbH#Rechenzentrum#ITSicherheit#CloudMonitoring#ServerÜberwachung#ITManagement#SystemMonitoring
0 notes
Text
New GKE Ray Operator on Kubernetes Engine Boost Ray Output
GKE Ray Operator
The field of AI is always changing. Larger and more complicated models are the result of recent advances in generative AI in particular, which forces businesses to efficiently divide work among more machines. Utilizing Google Kubernetes Engine (GKE), Google Cloud’s managed container orchestration service, in conjunction with ray.io, an open-source platform for distributed AI/ML workloads, is one effective strategy. You can now enable declarative APIs to manage Ray clusters on GKE with a single configuration option, making that pattern incredibly simple to implement!
Ray offers a straightforward API for smoothly distributing and parallelizing machine learning activities, while GKE offers an adaptable and scalable infrastructure platform that streamlines resource management and application management. For creating, implementing, and maintaining Ray applications, GKE and Ray work together to provide scalability, fault tolerance, and user-friendliness. Moreover, the integrated Ray Operator on GKE streamlines the initial configuration and directs customers toward optimal procedures for utilizing Ray in a production setting. Its integrated support for cloud logging and cloud monitoring improves the observability of your Ray applications on GKE, and it is designed with day-2 operations in mind.
- Advertisement -
Getting started
When establishing a new GKE Cluster in the Google Cloud dashboard, make sure to check the “Enable Ray Operator” function. This is located under “AI and Machine Learning” under “Advanced Settings” on a GKE Autopilot Cluster.
The Enable Ray Operator feature checkbox is located under “AI and Machine Learning” in the “Features” menu of a Standard Cluster.
You can set an addons flag in the following ways to utilize the gcloud CLI:
gcloud container clusters create CLUSTER_NAME \ — cluster-version=VERSION \ — addons=RayOperator
- Advertisement -
GKE hosts and controls the Ray Operator on your behalf after it is enabled. After a cluster is created, your cluster will be prepared to run Ray applications and build other Ray clusters.
Record-keeping and observation
When implementing Ray in a production environment, efficient logging and metrics are crucial. Optional capabilities of the GKE Ray Operator allow for the automated gathering of logs and data, which are then seamlessly stored in Cloud Logging and Cloud Monitoring for convenient access and analysis.
When log collection is enabled, all logs from the Ray cluster Head node and Worker nodes are automatically collected and saved in Cloud Logging. The generated logs are kept safe and easily accessible even in the event of an unintentional or intentional shutdown of the Ray cluster thanks to this functionality, which centralizes log aggregation across all of your Ray clusters.
By using Managed Service for Prometheus, GKE may enable metrics collection and capture all system metrics exported by Ray. System metrics are essential for tracking the effectiveness of your resources and promptly finding problems. This thorough visibility is especially important when working with costly hardware like GPUs. You can easily construct dashboards and set up alerts with Cloud Monitoring, which will keep you updated on the condition of your Ray resources.
TPU assistance
Large machine learning model training and inference are significantly accelerated using Tensor Processing Units (TPUs), which are custom-built hardware accelerators. Ray and TPUs may be easily used with its AI Hypercomputer architecture to scale your high-performance ML applications with ease.
By adding the required TPU environment variables for frameworks like JAX and controlling admission webhooks for TPU Pod scheduling, the GKE Ray Operator simplifies TPU integration. Additionally, autoscaling for Ray clusters with one host or many hosts is supported.
Reduce the delay at startup
When operating AI workloads in production, it is imperative to minimize start-up delay in order to maximize the utilization of expensive hardware accelerators and ensure availability. When used with other GKE functions, the GKE Ray Operator can significantly shorten this startup time.
You can achieve significant speed gains in pulling images for your Ray clusters by hosting your Ray images on Artifact Registry and turning on image streaming. Huge dependencies, which are frequently required for machine learning, can lead to large, cumbersome container images that take a long time to pull. For additional information, see Use Image streaming to pull container images. Image streaming can drastically reduce this image pull time.
Moreover, model weights or container images can be preloaded onto new nodes using GKE secondary boot drives. When paired with picture streaming, this feature can let your Ray apps launch up to 29 times faster, making better use of your hardware accelerators.
Scale Ray is currently being produced
A platform that grows with your workloads and provides a simplified Pythonic experience that your AI developers are accustomed to is necessary to stay up with the quick advances in AI. This potent trifecta of usability, scalability, and dependability is delivered by Ray on GKE. It’s now simpler than ever to get started and put best practices for growing Ray in production into reality with the GKE Ray Operator.
Read more on govindhtech.com
#NewGKERayOperator#Kubernetes#GKEoffers#EngineBoostRayoutput#GoogleKubernetesEngine#cloudlogging#GKEAutopilotCluster#ai#gke#MachineLearning#CloudMonitoring#webhooks
0 notes
Text
Cloud Monitoring Market Set for Rapid Growth

The global cloud monitoring market is expected to witness significant growth, driven by the increasing adoption of cloud services and the need for real-time monitoring solutions. With advancements in AI and machine learning, cloud monitoring tools are becoming more sophisticated, offering predictive analytics and enhanced security capabilities.
Learn more..
For Downloade Sample Report..
1 note
·
View note
Text
We are Hiring Cloud Compliance Designer
Join our team as a Cloud Compliance Designer! Are you well-versed in Cloud Governance and Management Principles, skilled in Cloud Security Command Center & VPC Service Controls, Cloud Monitoring, and Cloud Logging? If you're passionate about ensuring Cloud Compliance and security, we'd love to have you on board. Let's shape the future of cloud technology together! Job Description - https://bizessence.com.au/jobs/cloud-compliance-designer/

#cloudcompliance#cloudsecurity#cloudmonitoring#cloudtechnology#techjobs#joinourteam#nowhiring#melbournejobs#australia#australiajobsearch
1 note
·
View note
Text
Is Your Azure App Slowing Down?
Lagging apps = unhappy users. It’s time to put your Azure performance under the microscope.
🔍 Use real-time monitoring to: ⚙️ Monitor Azure network latency 📊 Track app responsiveness 🛠️ Run fast Azure latency tests
Get total visibility now ➡️ 👉 Start Monitoring
0 notes
Text
Datadog ’s stock is soaring-can it hit $200 by 2029? Dive into our 2025–2029 forecast, S&P 500 boost, and AI-driven growth insights. #Datadogstock #DDOG #cloudobservability #stockpriceforecast #S&P500stocks #AIgrowthstocks #techstocks2025 #Datadoginvestment #stockmarkettrends #cloudmonitoring
#AI growth stocks#best AI stocks 2025#cloud computing stocks#cloud monitoring#cloud observability#Datadog growth potential#Datadog investment#Datadog S&P 500 inclusion impact#Datadog stock#Datadog stock analysis#Datadog stock price prediction 2025–2029#Datadog valuation risks#DDOG#DDOG stock forecast#Investment#Investment Analysis#Investment Insights#MARA#S&P 500 stocks#should I buy Datadog stock#stock market trends#Stock Price Forecast#tech stock opportunities#tech stocks 2025
1 note
·
View note