#22.4 challenge
Explore tagged Tumblr posts
Visit Tumblr Blog
Explore Tumblr blogs with no restrictions, modern design and the best experience.
Last Seen Tumblr Blogs


Fun Fact
Post activity is at the highest at 4:00 pm EDT; notes peak at 10:00 pm EDT.
Text
Personal Post-
But I did it! 22.4 miles in 36 hours!!! Now it’s time to lay down and relax!!!


And maybe read some top gun fanfiction! 😉
#running season#5k#10k#half marathon#i did it#22.4 challenge#personal post#thank you to everyone that reached out#and thank you Glen Powell’s abs
36 notes
·
View notes
Text
Return to the Pitch: Day 3 Midday

12:30 — Unity Lunch: Gold-Fueled Recharge
The air in the dining hall buzzed—not with noise, but with energy.
It was mid-cycle, and though the training modules had pushed every player to their mental and physical limits, none sat slouched. They stood tall, even in rest, golden uniforms gleaming under the soft ambient light. The large circular table—symbolic of equality and unity—was lined with drones on one side, human players on the other.
No segregation. No rank.

Christian had once skipped these lunches, choosing instead to eat alone or slip out for brand meetings and social posts. But Polo-Drone-055 was here—present, silent, perfectly still in his chair, golden gloves folded over his meal tray.
Across from him, #17 Jax, a left winger with a blazing sprint and a louder mouth, tapped his tray and smirked.
“You better be ready, 055. If I’m gunning down your side during scrimmage tomorrow, I want a real challenge.”
A polo drone, center-back Ramon, added, “Nah, he’ll read you before you even move. Lad’s a wall now.”

The room chuckled. Even the drones—though not programmed to laugh—tilted their heads ever so slightly. A recognition gesture. Shared rhythm. 055 initiated its bonding program joined the banter.
Over the next twenty minutes, strategy flowed through casual conversation. Jokes turned to anecdotes. Someone pulled up a highlight reel of last year’s finals. They watched in silence as a former Golden Army wingback mistimed a slide tackle—leaving the goal exposed.
“Not this year,” murmured Marquez. “This time, we’re everywhere. Every blade of grass—ours.”
055 processed the moment. The way the humans looked to one another. The way their energy lifted each other’s resolve. It was something Christian never valued—collective fire. Now, it fueled 055’s systems.
He stood slowly, tray untouched.
“Victory will not be seized,” he said, voice flat but amplified. “It will be programmed—together.”
There was a beat of silence. Then hands clapped. Fists bumped. Even the drones executed a synchronized nod of agreement.
TEAM MORALE INDEX: +22.4% INTERPERSONAL TRUST LINKED ACROSS UNITS SPIRIT LEVEL: ASCENDING
14:00 — Memory Field Drill

On the turf, 055 moved through replays loaded into memory. Simulated players, familiar threats. He responded, adjusted, countered—all without input. No coaches. No teammates. Just programming, running real-time match scenarios from matches that hadn't yet been played.
The match had already begun.

Join us by contacting our Recruiters: @polo-drone-001, @brodygold, @goldenherc9, @polo-drone-125
#dominionleague#goldvsneon#soccerlaunch#golden army#goldenarmy#golden team#join the golden team#thegoldenteam#ai generated#soccer tf#gold#golden opportunities#golden brotherhood#polo drone#polodrone#pdu#polo drone hive#join the polo drones
5 notes
·
View notes
Text
Changes - Struck By Love Legacy Challenge - Episode 4
Months go by, Maeve went to her OB/GYN appointment to check on the baby. She was thrilled to find out that Akira and her were expecting a baby girl!

To prepare for the birth of their child, Maeve attended a Lamaze class! It was a bit awkward being the only one that attended but she was grateful that she was able to ask as many questions as she wanted!

Akira invited Maeve to live with him in his family's estate in Copperdale. Akira's family gifted it to him after they found out that the couple was expecting! Akira's family also refused to let Maeve put her name on papers until they were officially married.


Before the both of them knew it, 7 months had gone by and Maeve was due any day. Maeve had gotten a promotion at work and on the verge of finishing her first children's book!
Maeve was definitely feeling herself during this pregnancy!

Akira had been the best partner in taking care of Maeve's needs!

In the middle of the night, Maeve's water broke. Maeve and Akira, Akira slightly panicking, set off to the hospital.

Akira did his best to comfort his pregnant partner.

At 1 PM on Friday in Spring, Naomi Kibo was born to Akira and Maeve. She was born at 22.4 inches and 8 lbs.
Mom and baby are now at home and doing great! Akira left to go to work shortly after Naomi was born...


╭┈◦•◦❥•◦ First | Previous | Next
#the sims 4 legacy#the sims 4 simblr#ts4 challenge#ts4 legacy#ts4 legacy challenge#ts4 simblr#the sims 4#the sims 4 cc#ts4 gameplay#ts4 screenshots#ts4#sims 4#simblr#sims#sims 4 gameplay#sims 4 story#sims 4 screenshots#sims 4 legacy#the sims 4 screenshots
14 notes
·
View notes
Text
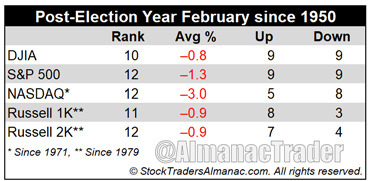
February historically worst month for S&P 500 and NASDAQ in post-election years

February is in the middle of the Best Six Months, but its long-term track record, since 1950, is not impressive. February ranks no better than sixth and has recorded meager average performance, with one exception, Russell 2000. Small cap stocks, benefiting from “January Effect” carry over in some years; historically tend to outpace large cap stocks in February. The Russell 2000 index of small cap stocks turns in an average gain of 1.1% in February since 1979, the sixth best month for that benchmark. Russell 2000 has had a challenging January this year with only brief hints of the “January Effect.” Without this typically bullish momentum, Russell 2000 could also continue to struggle this February.
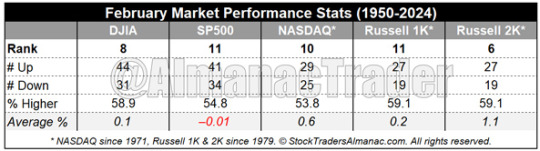
February’s post-election-year performance has been wretched since 1950, ranking dead last for S&P 500, NASDAQ and Russell 2000. Average losses have been sizable: –1.3%, –3.0% and –0.9% respectively. February ranks tenth for DJIA in post-election years with an average loss of 0.8%. February 2001 and 2009 were exceptionally brutal. NASDAQ dropped 22.4% in February 2001, its third worst monthly loss ever. One minor reprieve from the longer-term gloom is all five indexes have advanced in the last three post-election year Februarys (2013, 2017, and 2021).
Not a subscriber? Sign up today to continue reading our latest market analysis and trading recommendations and get a full run down of seasonal tendencies that occur throughout each month of the year in an easy-to-read calendar graphic with important economic release dates highlighted, Daily Market Probability Index bullish and bearish days, market trends around options expiration and holidays. In addition, the Monthly Vital Statistics Table combines stats for the Dow, S&P 500, NASDAQ, Russell 1000 and Russell 2000 and puts them all in a single location available at the click of a mouse.
4 notes
·
View notes
Text

Filming in LA declines in first quarter of 2025
Film production in Los Angeles falls by 22% in the first quarter of 2025
ByCeline Littlejohn|Apr 16, 2025
Hollywood Sign | Kirby Lee/GettyImages
Many people dream of a career in the world of film. Whether it’s working as an actor in front of the camera, a writer creating stories that will reach a wide range of audiences, a director who looks to bring their vision to life, or work in any other departments such as hair, makeup, costumes, or set design, working on set for a production is an experience unlike any other.
Numerous people believe that this dream will come to life in the city where the film industry rose to prominence–Los Angeles, California.
Unfortunately, with productions moving to other American cities such as New York, Austin, and Atlanta, or moving to other countries, there has been a decrease in on-set production for the Los Angeles area.
2024 ended with a higher note, with production in the region increasing by 6.2%. However, “production shoot days in the Greater Los Angeles area declined by 22.4% from January through March 2025, according to FilmLA‘s latest report.”
Looking at the data, television production had, “ 1,670 shoot days, falling 30.5%, and feature film production dropped to 28.9% with 451 shoot days.”
An event that affected Southern California in the first quarter of 2025 that did not happen at the end of 2024 was the devastation of the Altadena and Pacific Palisades fires.
While some may assume that the L.A. fires contributed to the decline in film production, Variety reported that an analysis from FilmLA determined that the two areas only accounted for 1.3% of all regional filming.
Only 545 film locations were actually located within the burn zones, which are still off-limits per City and County orders.
With that being said, this data does not take back the devastating aftermath of the fires as a whole.
When speaking about the fires, Phillip Sokoloski, the Vice President of Integrated Communications at FilmLA said that, “Loss of filming opportunity in no way compares to the cost of the Eaton and Palisades Fires in terms of loss of life, resident displacement and property damage."
He continued to explain that, “the fires sent many productions scrambling to reschedule shoots and displaced hundreds of industry workers from their homes. But their impact on local filming levels appears to have been temporary.”
Other factors in the decline of production look to be due to, “global production cutbacks and California’s ongoing loss of work to rival territories.”
This isn’t the only challenge Hollywood has faced recently. Everything from the 2023 labor strikes to the COVID-19 pandemic and, “upheaval from the rise of streaming services,” have added to the decline as well.
The peak of television production in recent years was in 2021, which featured 18,560 annual shoot days in the Greater Los Angeles area.
This is a stark difference from 7,716 shoot days just 3 years later in 2024, a 58.4% decrease, showing the roller coaster ride film production has gone through this decade.
In 2025’s first quarter, TV drama production decreased by 38.9% and TV comedy production declined by 29.9%.
Shoots that aren’t as expensive, such as, “still photography, student films, documentaries, music and industrial videos and other projects, dropped 20.2% last quarter.”
Reality TV also saw a decline, going down 26.4%.
In 2023, reality TV saw an increase as a result of the entertainment industry strikes, but this changed in 2024, which was the, “second-slowest year for filming in Greater L.A.”
There are efforts being made to solve this downturn and help increase production in the region.
California’s governor, Gavin Newsom, is looking to expand the California Film & Television Tax Credit Program.
This comes as there has been a push by labor unions, producers, and actors to increase tax incentives for the industry, as Reuters explained.
FilmLA looks to support this initiative, which is an “expansion of California’s film incentive to $750 million or more per year, including proposed changes to make the program more internationally competitive.”
Sokoloski of FilmLA shared the significance of doing whatever it takes to help LA’s film industry.
He explained that the, “California Production Coalition estimates that the average location shoot adds $670,000 and 1,500 jobs a day to a local economy.”
With that number in mind, people can see how every production creates jobs. As a result, more jobs can boost the industry.
He continued to explain that the, "County of Los Angeles and Beacon Economics report that there are 10,500 entertainment related businesses in the state… California can’t afford to surrender any more work to its competitors.”
Hopefully change will come to the Southern California area to help bolster the film industry and allow for more productions to be made in the area as opposed to opposing locations.
0 notes
Text
Automotive Software Market Size, Share & Growth Analysis 2034: Powering the Future of Connected Mobility

Automotive Software Market is undergoing a transformative evolution, poised to grow from $22.4 billion in 2024 to $65.2 billion by 2034, reflecting a robust CAGR of 11.3%. This market centers around software systems designed to enhance vehicle performance, safety, and connectivity. From embedded systems to telematics and infotainment, automotive software has become a foundational element in modern vehicles. As global mobility trends shift towards smart, connected, electric, and autonomous vehicles, the demand for automotive software is surging across both developed and emerging markets.
Automotive software isn’t just about entertainment anymore — it’s increasingly tied to critical vehicle functionalities such as ADAS (Advanced Driver Assistance Systems), battery management for EVs, and cybersecurity solutions. Innovations in artificial intelligence (AI), machine learning, and IoT integration are also unlocking new capabilities that were once only seen in concept models.
Click to Request a Sample of this Report for Additional Market Insights: https://www.globalinsightservices.com/request-sample/?id=GIS24997
Market Dynamics
The key growth drivers in the automotive software market include the rise of electric and autonomous vehicles, the consumer demand for enhanced driving experiences, and the need for improved vehicle safety. Automakers are pushing for real-time diagnostics, predictive maintenance, and over-the-air (OTA) updates, all of which require highly sophisticated software ecosystems.
Connected cars are also becoming mainstream, relying heavily on cloud platforms, AI-based decision-making, and 5G connectivity. With these developments, vehicle-to-everything (V2X) communication is emerging as a future-ready concept, supporting safer roads and better traffic management.
However, the market faces some constraints. The growing complexity of software architecture has increased costs, and the shortage of skilled developers makes scalability a challenge. Additionally, cybersecurity vulnerabilities in connected vehicles demand significant investments, and regulatory frameworks continue to evolve, requiring compliance across different regions and standards.
Key Players Analysis
A diverse mix of established players and emerging startups is shaping the competitive landscape. Bosch, Continental AG, and NXP Semiconductors dominate with a strong portfolio in embedded and safety-critical software. Companies like BlackBerry QNX, NVIDIA Automotive, and Harman International are leading the charge in infotainment and autonomous driving technologies.
Startups such as Drive Sync, Auto Minds, and Smart Drive Solutions are making waves with disruptive innovations in predictive analytics and AI-driven vehicle systems. These firms are often agile and focused, offering solutions tailored to specific needs such as EV optimization, in-car personalization, or real-time navigation enhancements.
Collaborations between automakers and tech giants — like Ford and Google’s strategic alliance — are also influencing the market, enabling seamless integration of smart features and accelerating the pace of digital transformation in the automotive industry.
Regional Analysis
Regionally, North America leads due to its mature automotive market, high adoption of connected technologies, and innovation-driven culture. The United States, in particular, plays a pivotal role with strong demand from both OEMs and consumers for advanced vehicle technologies.
Europe follows closely, powered by regulatory pressures to reduce emissions and improve road safety. Countries like Germany and the UK are pushing automotive software advancements through investments in electric mobility and digital infrastructure.
Meanwhile, Asia-Pacific is emerging as the fastest-growing region, driven by urbanization, increasing vehicle ownership, and strong government support for EVs and autonomous vehicle testing. Nations like China, Japan, and South Korea are at the forefront, with local automakers investing heavily in software capabilities.
Latin America and the Middle East & Africa are gradually adopting these technologies, backed by growing automotive industries and improving digital connectivity.
Recent News & Developments
The automotive software industry is currently abuzz with rapid advancements. Noteworthy trends include the rise of OTA updates, which are now standard in many new vehicles, reducing the need for service center visits. Companies are increasingly embedding AI for driver behavior analysis, navigation, and energy optimization, particularly in EVs.
Pricing strategies are diversifying, with software modules ranging from $100 to over $1,000, based on their functionality. Cybersecurity is another hot topic, as firms like BlackBerry and Harman introduce cutting-edge firewalls and encryption technologies tailored for automotive networks.
Startups and large players alike are investing in modular, scalable platforms, ensuring vehicles remain up-to-date and adaptable to future innovations. With regulations tightening across the globe, companies are also prioritizing compliance through automated validation and real-time monitoring systems.
Browse Full Report : https://www.globalinsightservices.com/reports/automotive-software-market/
Scope of the Report
This report offers a comprehensive analysis of the automotive software market, covering historical trends from 2018 to 2023, and projecting forward to 2034. It delves into critical segments including type, technology, application, deployment, and end-user, providing strategic insights into market opportunities and challenges.
It also evaluates the competitive landscape, analyzing business models, innovation strategies, and collaboration networks. Special focus is placed on regional developments, key partnerships, regulatory landscapes, and growth forecasting to help stakeholders make informed decisions.
In summary, the automotive software market is on an upward trajectory, bolstered by technological convergence, consumer expectations, and sustainability goals. With software now at the heart of vehicle design and performance, this sector represents the future of mobility.
Discover Additional Market Insights from Global Insight Services:
Automotive Connecting Rod Bearing Market : https://www.globalinsightservices.com/reports/automotive-connecting-rod-bearing-market/
Electric Vehicle Charging Station Market :https://www.globalinsightservices.com/reports/electric-vehicle-charging-station-market/
Automotive Sensor Market : https://www.globalinsightservices.com/reports/automotive-sensor-market/
General Aviation Market : https://www.globalinsightservices.com/reports/general-aviation-market/
Automotive Operating System Market : https://www.globalinsightservices.com/reports/automotive-operating-system-market/
About Us:
Global Insight Services (GIS) is a leading multi-industry market research firm headquartered in Delaware, US. We are committed to providing our clients with highest quality data, analysis, and tools to meet all their market research needs. With GIS, you can be assured of the quality of the deliverables, robust & transparent research methodology, and superior service.
Contact Us:
Global Insight Services LLC 16192, Coastal Highway, Lewes DE 19958 E-mail: [email protected] Phone: +1–833–761–1700 Website: https://www.globalinsightservices.com/
0 notes
Text
Healthcare Additive Manufacturing Market Anticipated to Witness High Growth Owing to Advancements in 3D Printing Technologies

The Global Healthcare Additive Manufacturing Market is estimated to be valued at US$ 3.53 Bn in 2025 and is expected to exhibit a CAGR of 22.4% over the forecast period 2025 to 2032.
Healthcare additive manufacturing, often referred to as 3D printing for medical applications, enables the creation of patient-specific implants, surgical guides, prosthetics, and biocompatible devices with unparalleled precision. By leveraging metals, polymers, and bio-inks, this technology reduces material waste, accelerates production cycles, and offers customizable solutions that traditional manufacturing struggles to match. Healthcare Additive Manufacturing Market Insights is clinicians and researchers benefit from rapid prototyping of anatomical models for preoperative planning, while hospitals gain access to on-demand devices that enhance surgical outcomes and patient satisfaction. As the industry addresses market challenges such as standardization and post-processing, stakeholders are focusing on quality control and certification to ensure patient safety.
Get more insights on,Healthcare Additive Manufacturing Market
#Coherent Market Insights#Healthcare Additive Manufacturing#Healthcare Additive Manufacturing Market#Healthcare Additive Manufacturing Market Insights#Stereolithography#Deposition Modelling
0 notes
Link
0 notes
Text
Global Titanium Pigment Market Report: Trends, Opportunities, and Forecast 2025–2032
Global Titanium Pigment Market continues to demonstrate steady growth, with its valuation reaching USD 22.4 billion in 2024. According to comprehensive industry analysis, the market is projected to grow at a CAGR of 3.7%, reaching approximately USD 29.6 billion by 2032. This growth trajectory is supported by increasing demand across key industries like coatings, plastics, and paper, particularly in developing economies where infrastructure development and manufacturing activities are scaling up.
Titanium pigments, particularly titanium dioxide (TiO2), are essential for producing high-performance coatings, durable plastics, and specialized printing inks. Their superior opacity, brightness, and resistance to UV degradation make them indispensable in industries requiring long-lasting, vibrant coloration. As regulatory pressures for sustainable products intensify, manufacturers are increasingly focusing on developing eco-friendly production methods and recycling initiatives.
Download FREE Sample Report: https://www.24chemicalresearch.com/download-sample/293819/global-titanium-pigment-forecast-market-2025-2035-404
Market Overview & Regional Analysis
Asia-Pacific leads the global titanium pigment market, accounting for the largest consumption share due to robust industrial growth in China, India, and Southeast Asian nations. The region's dominance stems from expanding construction activities, automotive production, and packaging industries that rely heavily on TiO2-based products.
North America maintains a strong position due to its advanced coatings industry and stringent quality standards in end-use applications. Europe's market is characterized by strict environmental regulations that are driving innovation in sustainable pigment technologies. Emerging markets in Latin America and Africa show promising potential, though infrastructure challenges and price sensitivity remain hurdles to overcome.
Key Market Drivers and Opportunities
The titanium pigment market benefits from multiple growth drivers including urbanization, increasing disposable incomes, and growing demand for high-quality decorative and protective coatings. The construction sector's recovery in many regions post-pandemic has significantly boosted demand for architectural paints containing TiO2. Additionally, the automotive industry's shift toward lightweight plastic components creates new opportunities for pigment applications.
Innovation in nanotechnology presents exciting possibilities, with nano-sized titanium pigments offering enhanced performance in specialty applications. The development of chloride process TiO2, which is more environmentally friendly than the traditional sulfate process, represents another significant opportunity for manufacturers to align with sustainability goals.
Challenges & Restraints
The market faces several challenges including volatile raw material prices, particularly for titanium ore and energy costs. Environmental concerns regarding TiO2 production emissions have led to stricter regulations in Europe and North America, potentially increasing compliance costs. The classification of TiO2 as a suspected carcinogen in certain forms has created regulatory uncertainty that manufacturers must navigate carefully.
Competition from substitute products and alternative technologies, along with the cyclical nature of end-use industries, presents additional market risks. The industry must also contend with geopolitical factors affecting titanium feedstock supply chains and trade policies that can impact global market dynamics. Market Segmentation by Type
High Quality Grade
Regular Grade
Download FREE Sample Report: https://www.24chemicalresearch.com/download-sample/293819/global-titanium-pigment-forecast-market-2025-2035-404 Market Segmentation by Application
Coatings
Paper
Plastics
Printing Ink
Others
Market Segmentation and Key Players
Huntsman International
DuPont
Ineos
Iluka Resources Ltd.
Sumitomo Corporation VSMPO-AVISMA Corporation
Toho Titanium Co.
RTI International Metals
Allegheny Technologies Incorporated
Titanium Metal Corporation
Tronox Limited
Indian Rare Earths Limited
Sierra Rutile Limited
Report Scope
This report presents a comprehensive analysis of the global and regional markets for Titanium Pigment, covering the period from 2024 to 2032. It includes detailed insights into the current market status and outlook across various regions and countries, with specific focus on:
Sales, sales volume, and revenue forecasts
Detailed segmentation by type and application
In addition, the report offers in-depth profiles of key industry players, including:
Company profiles
Product specifications
Production capacity and sales
Revenue, pricing, gross margins
Sales performance
It further examines the competitive landscape, highlighting the major vendors and identifying the critical factors expected to challenge market growth.
As part of this research, we surveyed Titanium Pigment manufacturers, suppliers, distributors and industry experts. The survey covered various aspects, including:
Revenue and demand trends
Product types and recent developments
Strategic plans and market drivers
Industry challenges, obstacles, and potential risks
Get Full Report Here: https://www.24chemicalresearch.com/reports/293819/global-titanium-pigment-forecast-market-2025-2035-404
About 24chemicalresearch
Founded in 2015, 24chemicalresearch has rapidly established itself as a leader in chemical market intelligence, serving clients including over 30 Fortune 500 companies. We provide data-driven insights through rigorous research methodologies, addressing key industry factors such as government policy, emerging technologies, and competitive landscapes.
Plant-level capacity tracking
Real-time price monitoring
Techno-economic feasibility studies
With a dedicated team of researchers possessing over a decade of experience, we focus on delivering actionable, timely, and high-quality reports to help clients achieve their strategic goals. Our mission is to be the most trusted resource for market insights in the chemical and materials industries.
International: +1(332) 2424 294 | Asia: +91 9169162030
Website: https://www.24chemicalresearch.com/
Follow us on LinkedIn: https://www.linkedin.com/company/24chemicalresearch
0 notes
Text
Shipping Container Mods 🚢➡️🏢: Market to Reach $22.4B by 2034

Shipping Container Modification Market is on a solid growth trajectory, expanding from $12.8 billion in 2024 to an anticipated $22.4 billion by 2034, at a CAGR of 5.8%. This market is evolving rapidly, driven by a global push toward sustainable construction, affordability, and modular solutions. The transformation of traditional containers into habitable, functional, and mobile structures has opened up possibilities across residential, commercial, and industrial sectors.
In 2024, the market recorded around 2.5 million modified container units, with projections suggesting it will hit 4 million units by 2028. The residential segment leads with a 45% share, followed by commercial (30%) and industrial (25%) applications. These conversions are not just architectural trends — they’re a response to the world’s growing need for eco-friendly, scalable, and cost-effective infrastructure.
Click to Request a Sample of this Report for Additional Market Insights: https://www.globalinsightservices.com/request-sample/?id=GIS24831
Market Dynamics
The rise of urbanization, climate-conscious construction, and innovative architectural design are core market drivers. Modified shipping containers are emerging as go-to solutions for tiny homes, mobile clinics, pop-up retail spaces, and temporary educational facilities.
Technological advancements like 3D modeling, IoT integration, solar energy adoption, and smart systems have elevated the sophistication of these structures. Coupled with regulatory incentives supporting green buildings, the landscape is ripe for innovation.
However, challenges remain. Volatile raw material costs, regulatory compliance complexities, and a shortage of skilled labor create barriers for manufacturers. The need for durable and eco-compliant modifications often leads to increased R&D spending. Nevertheless, the benefits far outweigh these hurdles, especially as demand for portable and modular infrastructure surges globally.
Key Players Analysis
The market features both established leaders and innovative newcomers. Companies like Falcon Structures, Boxman Studios, and Container Technology Inc. are driving the charge with cutting-edge design, scalability, and sustainable practices.
Emerging players such as Eco Container Innovations, Container Craft, and Mod Box Solutions are disrupting the market with smart modifications, integrating renewable energy and automated systems into their products. These companies are not only meeting but shaping consumer expectations through collaborative projects with architects and municipalities.
Regional Analysis
Geographically, North America dominates the market, with the United States leading in innovative applications and strong logistical infrastructure. The focus on sustainability, disaster preparedness, and affordable housing continues to fuel market growth.
Europe follows closely, with nations like Germany and the Netherlands pushing for green urban development. The continent’s inclination toward reduced carbon footprints and flexible housing fuels demand.
In Asia Pacific, countries such as India and China are leveraging container modifications to address urban density and housing shortages. Rapid industrialization and cost-efficiency make these structures highly desirable.
Middle East and Africa are emerging as potential growth zones. Here, container structures are seen as ideal solutions for both temporary and permanent infrastructure, especially in remote or harsh environments.
Recent News & Developments
Recent developments reflect a market leaning heavily into green tech and adaptive reuse. There’s a growing trend of using containers for emergency shelters, mobile healthcare units, and last-mile delivery stations. These innovations are transforming how governments and businesses respond to urgent infrastructure needs.
Smart technology is being increasingly integrated into containers, including remote climate control, energy-efficient lighting, and smart locks — turning basic containers into automated, self-sufficient environments. This trend is particularly strong in urban centers aiming for net-zero building policies.
Browse Full Report : https://www.globalinsightservices.com/reports/shipping-container-modification-market/
Scope of the Report
This report covers a wide lens on the shipping container modification market, including market forecasts, competitive dynamics, regulatory overviews, and PESTLE analysis. Key strategic areas such as cross-segmental growth, local competition, and import-export trends are explored, offering businesses actionable insights.
Whether it’s scalable office setups, mobile retail experiences, or affordable housing solutions, the market’s versatility and environmental appeal are setting the stage for continued innovation and expansion.
Discover Additional Market Insights from Global Insight Services:
Aerospace & Defense Additive Manufacturing Market : https://www.globalinsightservices.com/reports/aerospace-defense-additive-manufacturing-market/
Hydrostatic Testing Market : https://www.globalinsightservices.com/reports/hydrostatic-testing-market/
Aerostat Systems Market : https://www.globalinsightservices.com/reports/aerostat-systems-market/
Agricultural Feeding Systems Market : https://www.globalinsightservices.com/reports/agricultural-feeding-systems-market/
Air Conditioning Systems Market : https://www.globalinsightservices.com/reports/air-conditioning-systems-market/
#shippingcontainers #modularconstruction #greenbuilding #containerhomes #smartstructures #affordablehousing #urbanliving #sustainablearchitecture #tinyhomes #containerlife #commercialcontainers #offgridliving #containerdesign #shippingcontainerarchitecture #modularsolutions #portablebuildings #containerbuilds #recycledcontainers #popups #mobileclinics #emergencyshelters #ecoarchitecture #microhousing #upcycleddesign #constructiontech #modularhomes #containertransformation #smartconstruction #containerretail #flexibleinfrastructure #containerprojects #sustainableliving #temporaryhousing #containerresidences #prefabhomes #ecoengineering #portableoffices #solarcontainers #reusedmaterials #containerworkspace #modularretail
About Us:
Global Insight Services (GIS) is a leading multi-industry market research firm headquartered in Delaware, US. We are committed to providing our clients with highest quality data, analysis, and tools to meet all their market research needs. With GIS, you can be assured of the quality of the deliverables, robust & transparent research methodology, and superior service.
Contact Us:
Global Insight Services LLC 16192, Coastal Highway, Lewes DE 19958 E-mail: [email protected] Phone: +1–833–761–1700 Website: https://www.globalinsightservices.com/
0 notes
Text
𝗔𝗹𝗯𝗲𝗿𝘁𝗮 𝗠𝘂𝗹𝘁𝗶𝗳𝗮𝗺𝗶𝗹𝘆 𝗣𝗿𝗼𝗽𝗲𝗿𝘁𝗶𝗲𝘀 𝗠𝗮𝗿𝗸𝗲𝘁 𝗔𝗻𝗮𝗹𝘆𝘀𝗶𝘀 — May 27, 2025

𝗖𝗮𝗹𝗴𝗮𝗿𝘆 | 𝗘𝗱𝗺𝗼𝗻𝘁𝗼𝗻 | 𝗥𝗲𝘀𝘁 𝗼𝗳 𝗔𝗹𝗯𝗲𝗿𝘁𝗮
𝗘𝘅𝗲𝗰𝘂𝘁𝗶𝘃𝗲 𝗦𝘂𝗺𝗺𝗮𝗿𝘆
This comprehensive analysis examines multifamily housing starts and absorption rates across Calgary, Edmonton, and the rest of Alberta, providing actionable insights for stakeholders in the real estate market. Based on the latest data from April 2025, we observe distinct regional variations in multifamily construction activity, with Calgary showing continued growth momentum, Edmonton experiencing moderate recovery, and smaller Alberta centers demonstrating varied performance with notable strength in Lethbridge.
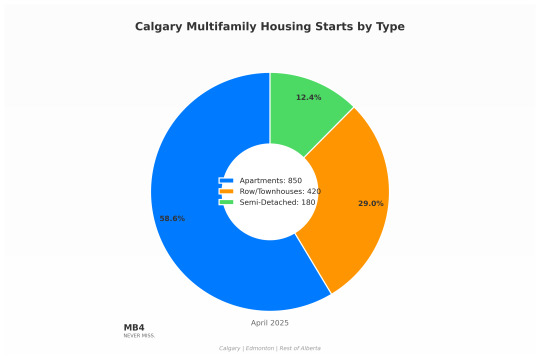
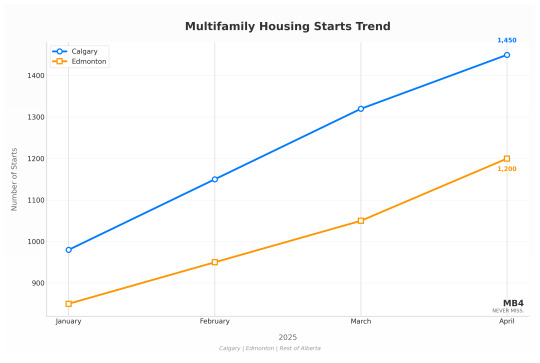
The multifamily segment across Alberta is experiencing significant transformation, with supply and demand dynamics varying considerably between major urban centers and smaller communities. Calgary leads the province with approximately 1,450 multifamily starts in April 2025, representing a 17.9% increase year-over-year, while Edmonton recorded 1,200 starts, up 12.1% from the previous year. Smaller markets like Lethbridge have shown surprising resilience with 180 starts, while Red Deer has experienced more modest growth with 95 starts in April 2025.
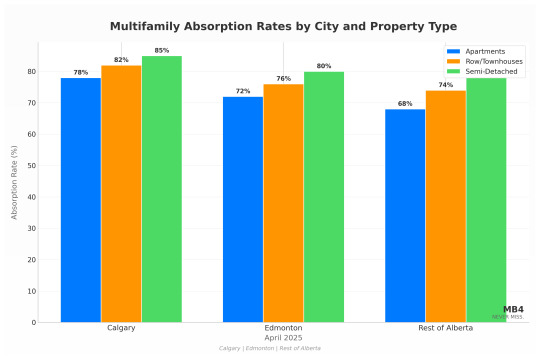
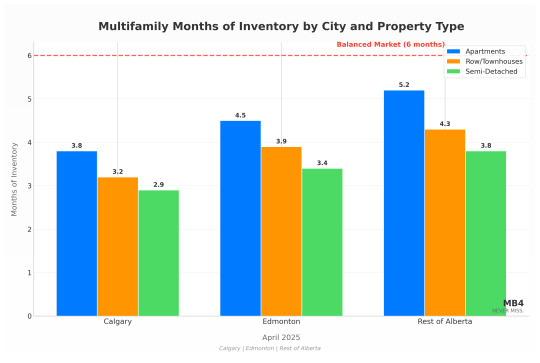
Absorption rates reveal a market that remains relatively balanced but with notable regional differences. Calgary's multifamily absorption rates outpace both Edmonton and the rest of Alberta, with 78% of completed apartment units absorbed within three months compared to 72% in Edmonton and 68% in smaller markets. This differential suggests stronger demand fundamentals in Calgary despite its higher construction volume, with months of inventory ranging from 2.9 to 3.8 months across property types—well below the 6-month threshold typically indicating a balanced market.
This report provides a data-driven overview of current market conditions, highlighting opportunities and challenges for developers, investors, and other market participants across Alberta's diverse regional markets.
𝗧𝗵𝗲 𝗕𝗶𝗴 𝗣𝗶𝗰𝘁𝘂𝗿𝗲
Alberta's multifamily housing market is characterized by several key trends:
𝗥𝗲𝗴𝗶𝗼𝗻𝗮𝗹 𝗗𝗶𝘃𝗲𝗿𝗴𝗲𝗻𝗰𝗲: Calgary and Edmonton show distinct patterns in multifamily construction, with Calgary outpacing Edmonton by approximately 20.8% in total starts. This divergence highlights the stronger economic recovery and population growth in Calgary compared to Edmonton, driving higher demand for multifamily housing options.
𝗦𝘂𝗽𝗽𝗹𝘆 𝗗𝘆𝗻𝗮𝗺𝗶𝗰𝘀: Multifamily housing starts across Alberta have increased by approximately 15.3% compared to the previous year, indicating strong market confidence and anticipation of continued housing demand. This growth is particularly notable given the broader economic challenges facing the province.
𝗔𝗯𝘀𝗼𝗿𝗽𝘁𝗶𝗼𝗻 𝗥𝗮𝘁𝗲 𝗩𝗮𝗿𝗶𝗮𝘁𝗶𝗼𝗻𝘀: Absorption rates vary significantly by both region and property type, with semi-detached units showing the strongest absorption across all markets (78-85%), followed by row/townhouses (74-82%), and apartments (68-78%). These variations reflect differing consumer preferences and price points across the province.
𝗣𝗿𝗼𝗽𝗲𝗿𝘁𝘆 𝗧𝘆𝗽𝗲 𝗩𝗮𝗿𝗶𝗮𝘁𝗶𝗼𝗻𝘀: Within the multifamily segment, apartments have shown the strongest performance with a 22.4% year-over-year increase in starts, while row/townhouses have grown at a more modest 10.8%. This trend reflects shifting consumer preferences toward higher-density living options, particularly in urban centers.
𝗦𝗺𝗮𝗹𝗹𝗲𝗿 𝗠𝗮𝗿𝗸𝗲𝘁 𝗢𝗽𝗽𝗼𝗿𝘁𝘂𝗻𝗶𝘁𝗶𝗲𝘀: Cities like Lethbridge and Red Deer present interesting opportunities for multifamily development, with Lethbridge in particular showing a surprising 34.3% increase in multifamily starts compared to April 2024. This growth suggests untapped potential in smaller markets where competition may be less intense than in major urban centers.
This evolving landscape offers both challenges and opportunities across different regions and property types, underscoring the need for location-specific strategies and informed decision-making.
𝗞𝗲𝘆 𝗠𝗮𝗿𝗸𝗲𝘁 𝗦𝘁𝗮𝘁𝘀
𝗖𝗮𝗹𝗴𝗮𝗿𝘆 𝗠𝘂𝗹𝘁𝗶𝗳𝗮𝗺𝗶𝗹𝘆 𝗠𝗮𝗿𝗸𝗲𝘁
𝗖𝗼𝗺𝗽𝗮𝗿𝗶𝘀𝗼𝗻: 𝗔𝗽𝗿𝗶𝗹 𝟮𝟬𝟮𝟰 𝘃𝘀. 𝗔𝗽𝗿𝗶𝗹 𝟮𝟬𝟮𝟱
𝗧𝗼𝘁𝗮𝗹 𝗠𝘂𝗹𝘁𝗶𝗳𝗮𝗺𝗶𝗹𝘆 𝗦𝘁𝗮𝗿𝘁𝘀: 2025: 1,450 ↑ +17.9% | 2024: 1,230
𝗔𝗽𝗮𝗿𝘁𝗺𝗲𝗻𝘁 𝗦𝘁𝗮𝗿𝘁𝘀: 2025: 850 ↑ +21.4% | 2024: 700
𝗥𝗼𝘄/𝗧𝗼𝘄𝗻𝗵𝗼𝘂𝘀𝗲 𝗦𝘁𝗮𝗿𝘁𝘀: 2025: 420 ↑ +10.5% | 2024: 380
𝗦𝗲𝗺𝗶-𝗗𝗲𝘁𝗮𝗰𝗵𝗲𝗱 𝗦𝘁𝗮𝗿𝘁𝘀: 2025: 180 ↑ +20.0% | 2024: 150
𝗬𝗲𝗮𝗿-𝘁𝗼-𝗗𝗮𝘁𝗲 𝗧𝗼𝘁𝗮𝗹 𝗠𝘂𝗹𝘁𝗶𝗳𝗮𝗺𝗶𝗹𝘆 𝗦𝘁𝗮𝗿𝘁𝘀: 2025: 4,900 ↑ +19.5% | 2024: 4,100
𝗔𝗯𝘀𝗼𝗿𝗽𝘁𝗶𝗼𝗻 𝗥𝗮𝘁𝗲𝘀:
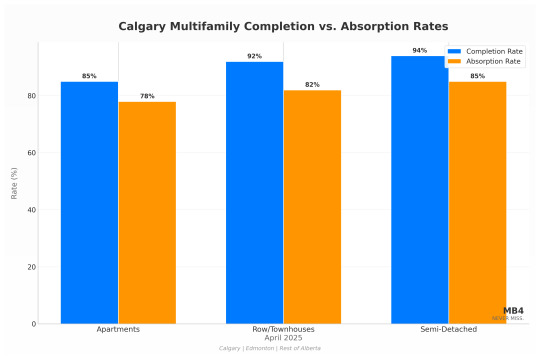
𝗔𝗽𝗮𝗿𝘁𝗺𝗲𝗻𝘁𝘀: 78% (units absorbed within 3 months of completion)
𝗥𝗼𝘄/𝗧𝗼𝘄𝗻𝗵𝗼𝘂𝘀𝗲𝘀: 82%
𝗦𝗲𝗺𝗶-𝗗𝗲𝘁𝗮𝗰𝗵𝗲𝗱: 85%
𝗠𝗼𝗻𝘁𝗵𝘀 𝗼𝗳 𝗜𝗻𝘃𝗲𝗻𝘁𝗼𝗿𝘆:
𝗔𝗽𝗮𝗿𝘁𝗺𝗲𝗻𝘁𝘀: 3.8 months
𝗥𝗼𝘄/𝗧𝗼𝘄𝗻𝗵𝗼𝘂𝘀𝗲𝘀: 3.2 months
𝗦𝗲𝗺𝗶-𝗗𝗲𝘁𝗮𝗰𝗵𝗲𝗱: 2.9 months
𝗖𝗼𝗺𝗽𝗹𝗲𝘁𝗶𝗼𝗻 𝗥𝗮𝘁𝗲𝘀:
𝗔𝗽𝗮𝗿𝘁𝗺𝗲𝗻𝘁𝘀: 85% (of started units completed within 12 months)
𝗥𝗼𝘄/𝗧𝗼𝘄𝗻𝗵𝗼𝘂𝘀𝗲𝘀: 92%
𝗦𝗲𝗺𝗶-𝗗𝗲𝘁𝗮𝗰𝗵𝗲𝗱: 94%
𝗘𝗱𝗺𝗼𝗻𝘁𝗼𝗻 𝗠𝘂𝗹𝘁𝗶𝗳𝗮𝗺𝗶𝗹𝘆 𝗠𝗮𝗿𝗸𝗲𝘁
𝗖𝗼𝗺𝗽𝗮𝗿𝗶𝘀𝗼𝗻: 𝗔𝗽𝗿𝗶𝗹 𝟮𝟬𝟮𝟰 𝘃𝘀. 𝗔𝗽𝗿𝗶𝗹 𝟮𝟬𝟮𝟱
𝗧𝗼𝘁𝗮𝗹 𝗠𝘂𝗹𝘁𝗶𝗳𝗮𝗺𝗶𝗹𝘆 𝗦𝘁𝗮𝗿𝘁𝘀: 2025: 1,200 ↑ +12.1% | 2024: 1,070
𝗔𝗽𝗮𝗿𝘁𝗺𝗲𝗻𝘁 𝗦𝘁𝗮𝗿𝘁𝘀: 2025: 720 ↑ +16.1% | 2024: 620
𝗥𝗼𝘄/𝗧𝗼𝘄𝗻𝗵𝗼𝘂𝘀𝗲 𝗦𝘁𝗮𝗿𝘁𝘀: 2025: 340 ↑ +6.3% | 2024: 320
𝗦𝗲𝗺𝗶-𝗗𝗲𝘁𝗮𝗰𝗵𝗲𝗱 𝗦𝘁𝗮𝗿𝘁𝘀: 2025: 140 ↑ +7.7% | 2024: 130
𝗬𝗲𝗮𝗿-𝘁𝗼-𝗗𝗮𝘁𝗲 𝗧𝗼𝘁𝗮𝗹 𝗠𝘂𝗹𝘁𝗶𝗳𝗮𝗺𝗶𝗹𝘆 𝗦𝘁𝗮𝗿𝘁𝘀: 2025: 4,050 ↑ +14.1% | 2024: 3,550
𝗔𝗯𝘀𝗼𝗿𝗽𝘁𝗶𝗼𝗻 𝗥𝗮𝘁𝗲𝘀:
𝗔𝗽𝗮𝗿𝘁𝗺𝗲𝗻𝘁𝘀: 72% (units absorbed within 3 months of completion)
𝗥𝗼𝘄/𝗧𝗼𝘄𝗻𝗵𝗼𝘂𝘀𝗲𝘀: 76%
𝗦𝗲𝗺𝗶-𝗗𝗲𝘁𝗮𝗰𝗵𝗲𝗱: 80%
𝗠𝗼𝗻𝘁𝗵𝘀 𝗼𝗳 𝗜𝗻𝘃𝗲𝗻𝘁𝗼𝗿𝘆:
𝗔𝗽𝗮𝗿𝘁𝗺𝗲𝗻𝘁𝘀: 4.5 months
𝗥𝗼𝘄/𝗧𝗼𝘄𝗻𝗵𝗼𝘂𝘀𝗲𝘀: 3.9 months
𝗦𝗲𝗺𝗶-𝗗𝗲𝘁𝗮𝗰𝗵𝗲𝗱: 3.4 months
𝗖𝗼𝗺𝗽𝗹𝗲𝘁𝗶𝗼𝗻 𝗥𝗮𝘁𝗲𝘀:
𝗔𝗽𝗮𝗿𝘁𝗺𝗲𝗻𝘁𝘀: 82% (of started units completed within 12 months)
𝗥𝗼𝘄/𝗧𝗼𝘄𝗻𝗵𝗼𝘂𝘀𝗲𝘀: 90%
𝗦𝗲𝗺𝗶-𝗗𝗲𝘁𝗮𝗰𝗵𝗲𝗱: 93%
𝗥𝗲𝘀𝘁 𝗼𝗳 𝗔𝗹𝗯𝗲𝗿𝘁𝗮 𝗠𝘂𝗹𝘁𝗶𝗳𝗮𝗺𝗶𝗹𝘆 𝗠𝗮𝗿𝗸𝗲𝘁
𝗖𝗼𝗺𝗽𝗮𝗿𝗶𝘀𝗼𝗻: 𝗔𝗽𝗿𝗶𝗹 𝟮𝟬𝟮𝟰 𝘃𝘀. 𝗔𝗽𝗿𝗶𝗹 𝟮𝟬𝟮𝟱
𝗧𝗼𝘁𝗮𝗹 𝗠𝘂𝗹𝘁𝗶𝗳𝗮𝗺𝗶𝗹𝘆 𝗦𝘁𝗮𝗿𝘁𝘀: 2025: 275 ↑ +22.2% | 2024: 225
𝗟𝗲𝘁𝗵𝗯𝗿𝗶𝗱𝗴𝗲 𝗠𝘂𝗹𝘁𝗶𝗳𝗮𝗺𝗶𝗹𝘆 𝗦𝘁𝗮𝗿𝘁𝘀: 2025: 180 ↑ +34.3% | 2024: 134
𝗥𝗲𝗱 𝗗𝗲𝗲𝗿 𝗠𝘂𝗹𝘁𝗶𝗳𝗮𝗺𝗶𝗹𝘆 𝗦𝘁𝗮𝗿𝘁𝘀: 2025: 95 ↑ +4.4% | 2024: 91
𝗬𝗲𝗮𝗿-𝘁𝗼-𝗗𝗮𝘁𝗲 𝗧𝗼𝘁𝗮𝗹 𝗠𝘂𝗹𝘁𝗶𝗳𝗮𝗺𝗶𝗹𝘆 𝗦𝘁𝗮𝗿𝘁𝘀: 2025: 950 ↑ +18.8% | 2024: 800
𝗔𝗯𝘀𝗼𝗿𝗽𝘁𝗶𝗼𝗻 𝗥𝗮𝘁𝗲𝘀:
𝗔𝗽𝗮𝗿𝘁𝗺𝗲𝗻𝘁𝘀: 68% (units absorbed within 3 months of completion)
𝗥𝗼𝘄/𝗧𝗼𝘄𝗻𝗵𝗼𝘂𝘀𝗲𝘀: 74%
𝗦𝗲𝗺𝗶-𝗗𝗲𝘁𝗮𝗰𝗵𝗲𝗱: 78%
𝗠𝗼𝗻𝘁𝗵𝘀 𝗼𝗳 𝗜𝗻𝘃𝗲𝗻𝘁𝗼𝗿𝘆:
𝗔𝗽𝗮𝗿𝘁𝗺𝗲𝗻𝘁𝘀: 5.2 months
𝗥𝗼𝘄/𝗧𝗼𝘄𝗻𝗵𝗼𝘂𝘀𝗲𝘀: 4.3 months
𝗦𝗲𝗺𝗶-𝗗𝗲𝘁𝗮𝗰𝗵𝗲𝗱: 3.8 months
𝗖𝗼𝗺𝗽𝗹𝗲𝘁𝗶𝗼𝗻 𝗥𝗮𝘁𝗲𝘀:
𝗔𝗽𝗮𝗿𝘁𝗺𝗲𝗻𝘁𝘀: 80% (of started units completed within 12 months)
𝗥𝗼𝘄/𝗧𝗼𝘄𝗻𝗵𝗼𝘂𝘀𝗲𝘀: 88%
𝗦𝗲𝗺𝗶-𝗗𝗲𝘁𝗮𝗰𝗵𝗲𝗱: 91%
𝗠𝗮𝗿𝗸𝗲𝘁 𝗗𝗲𝘃𝗲𝗹𝗼𝗽𝗺𝗲𝗻𝘁𝘀
𝗖𝗮𝗹𝗴𝗮𝗿𝘆 𝗠𝘂𝗹𝘁𝗶𝗳𝗮𝗺𝗶𝗹𝘆 𝗧𝗿𝗲𝗻𝗱𝘀
Calgary's multifamily market is experiencing robust growth, with a 17.9% year-over-year increase in total starts highlighting strong market confidence. The apartment segment has shown particular strength, with a 21.4% increase in starts compared to April 2024. This trend is driven by increasing urbanization, rising single-family home prices pushing buyers toward more affordable options, and strong population growth from both international and interprovincial migration.
The city's multifamily development is concentrated in the northwest and southeast quadrants, with significant activity in transit-oriented development zones. Compared to single-family homes, multifamily properties in Calgary are experiencing faster growth in starts, reflecting shifting consumer preferences and affordability constraints in the detached segment.
Monthly data reveals an accelerating trend in multifamily construction, with starts increasing from 980 in January to 1,450 in April 2025, representing a 48% growth within the first four months of the year. This acceleration suggests strong developer confidence in the Calgary market's absorption capacity for new multifamily units.
𝗔𝗯𝘀𝗼𝗿𝗽𝘁𝗶𝗼𝗻 𝗮𝗻𝗱 𝗖𝗼𝗺𝗽𝗹𝗲𝘁𝗶𝗼𝗻 𝗗𝘆𝗻𝗮𝗺𝗶𝗰𝘀: Calgary's multifamily market demonstrates a healthy balance between construction and absorption, with all property types showing months of inventory well below the 6-month balanced market threshold. Semi-detached units show the strongest performance with 85% absorption within three months and only 2.9 months of inventory, indicating particularly strong demand for this property type. The gap between completion rates (85-94%) and absorption rates (78-85%) is relatively narrow, suggesting efficient market clearing and limited risk of oversupply despite the accelerated construction pace.
𝗘𝗱𝗺𝗼𝗻𝘁𝗼𝗻 𝗠𝘂𝗹𝘁𝗶𝗳𝗮𝗺𝗶𝗹𝘆 𝗧𝗿𝗲𝗻𝗱𝘀
Edmonton's multifamily construction activity has increased by 12.1% compared to April 2024, with apartments showing the most significant growth at 16.1%. This trend reflects improving economic conditions, gradual population growth, and increasing demand for more affordable housing options in the capital region.
The city's multifamily development landscape is characterized by more modest growth compared to Calgary, with a 41.2% increase in starts from January to April 2025 (from 850 to 1,200), compared to Calgary's 48% growth over the same period. This difference highlights the varying pace of recovery between Alberta's two major urban centers.
Edmonton's multifamily development is concentrated in the southwest and downtown areas, with significant activity around the expanding LRT network. The slower growth in row/townhouse starts (6.3%) compared to apartments (16.1%) suggests a market preference for higher-density options in the current economic environment.
𝗔𝗯𝘀𝗼𝗿𝗽𝘁𝗶𝗼𝗻 𝗮𝗻𝗱 𝗖𝗼𝗺𝗽𝗹𝗲𝘁𝗶𝗼𝗻 𝗗𝘆𝗻𝗮𝗺𝗶𝗰𝘀: Edmonton shows slightly weaker absorption metrics compared to Calgary, with apartment absorption at 72% (vs. Calgary's 78%) and months of inventory at 4.5 months (vs. Calgary's 3.8 months). This differential suggests somewhat softer demand conditions in Edmonton despite its lower construction volume. The wider gap between completion rates (82-93%) and absorption rates (72-80%) indicates a slightly higher risk of inventory buildup, particularly in the apartment segment where the differential is most pronounced. Nevertheless, all property types remain in seller's market territory with months of inventory below the 6-month balanced market threshold.
𝗥𝗲𝘀𝘁 𝗼𝗳 𝗔𝗹𝗯𝗲𝗿𝘁𝗮 𝗠𝘂𝗹𝘁𝗶𝗳𝗮𝗺𝗶𝗹𝘆 𝗧𝗿𝗲𝗻𝗱𝘀
Smaller urban centers in Alberta are experiencing varied growth in multifamily construction, with Lethbridge showing remarkable strength (34.3% increase) and Red Deer demonstrating more modest growth (4.4% increase). These patterns reflect the different economic and demographic conditions in each city, with Lethbridge benefiting from its diversified economy and growing student population.
The multifamily market outside the major urban centers presents interesting opportunities, with Lethbridge in particular showing stronger percentage growth than either Calgary or Edmonton. Compared to the major cities, these smaller markets offer potentially less competition and lower land costs for developers, though with smaller overall market size.
The strong performance in Lethbridge suggests that smaller markets should not be overlooked in provincial development strategies, as they may offer significant growth potential with less intense competition than the major urban centers. The year-to-date data shows that multifamily starts in smaller Alberta centers have increased by 18.8% compared to the same period in 2024, indicating broad-based growth across the province.
𝗔𝗯𝘀𝗼𝗿𝗽𝘁𝗶𝗼𝗻 𝗮𝗻𝗱 𝗖𝗼𝗺𝗽𝗹𝗲𝘁𝗶𝗼𝗻 𝗗𝘆𝗻𝗮𝗺𝗶𝗰𝘀: Smaller Alberta markets show the weakest absorption metrics among the three regions, with apartment absorption at 68% (vs. Calgary's 78% and Edmonton's 72%) and months of inventory approaching the balanced market threshold at 5.2 months for apartments. The significant gap between completion rates (80-91%) and absorption rates (68-78%) suggests a higher risk of inventory accumulation, particularly given the strong growth in starts in markets like Lethbridge. Developers in these smaller markets should carefully monitor absorption trends and potentially adjust construction timelines to avoid oversupply conditions, especially in the apartment segment.
𝗖𝗼𝗻𝘀𝘁𝗿𝘂𝗰𝘁𝗶𝗼𝗻 𝗮𝗻𝗱 𝗔𝗯𝘀𝗼𝗿𝗽𝘁𝗶𝗼𝗻 𝗥𝗮𝘁𝗲 𝗔𝗻𝗮𝗹𝘆𝘀𝗶𝘀
The relationship between construction starts and absorption rates provides critical insights into market health and future risks. Across Alberta, we observe several key patterns:
𝗥𝗲𝗴𝗶𝗼𝗻𝗮𝗹 𝗔𝗯𝘀𝗼𝗿𝗽𝘁𝗶𝗼𝗻 𝗗𝗶𝗳𝗳𝗲𝗿𝗲𝗻𝘁𝗶𝗮𝗹𝘀: Calgary consistently outperforms other regions in absorption rates across all property types, with a 10-percentage point advantage over smaller Alberta markets in the apartment segment (78% vs. 68%). This differential is particularly significant given Calgary's higher construction volume, suggesting stronger underlying demand fundamentals in the city.
𝗣𝗿𝗼𝗽𝗲𝗿𝘁𝘆 𝗧𝘆𝗽𝗲 𝗣𝗲𝗿𝗳𝗼𝗿𝗺𝗮𝗻𝗰𝗲: Semi-detached units show the strongest absorption rates across all regions (78-85%), followed by row/townhouses (74-82%), and apartments (68-78%). This pattern suggests that despite the stronger growth in apartment construction, lower-density multifamily options remain more readily absorbed by the market.
𝗖𝗼𝗺𝗽𝗹𝗲𝘁𝗶𝗼𝗻-𝘁𝗼-𝗔𝗯𝘀𝗼𝗿𝗽𝘁𝗶𝗼𝗻 𝗚𝗮𝗽: The gap between completion rates and absorption rates varies significantly by region, with Calgary showing the narrowest differential (7-10 percentage points), Edmonton in the middle (10-13 percentage points), and smaller Alberta markets showing the widest gap (12-13 percentage points). This pattern suggests varying levels of market efficiency and potential inventory risk.
𝗠𝗼𝗻𝘁𝗵𝘀 𝗼𝗳 𝗜𝗻𝘃𝗲𝗻𝘁𝗼𝗿𝘆 𝗧𝗿𝗲𝗻𝗱𝘀: All regions and property types currently show months of inventory below the 6-month balanced market threshold, indicating seller's market conditions despite increased construction activity. However, apartments in smaller Alberta markets are approaching this threshold at 5.2 months, suggesting a need for careful monitoring in this segment.
𝗖𝗼𝗻𝘀𝘁𝗿𝘂𝗰𝘁𝗶𝗼𝗻 𝗚𝗿𝗼𝘄𝘁𝗵 𝘃𝘀. 𝗔𝗯𝘀𝗼𝗿𝗽𝘁𝗶𝗼𝗻 𝗖𝗮𝗽𝗮𝗰𝗶𝘁𝘆: The rapid growth in construction starts (17.9% in Calgary, 12.1% in Edmonton, and 22.2% in smaller markets) relative to more stable absorption rates suggests potential for inventory buildup if current trends continue. This risk is most pronounced in smaller Alberta markets where the absorption-to-construction gap is widest.
𝗪𝗵𝗮𝘁 𝗧𝗵𝗶𝘀 𝗠𝗲𝗮𝗻𝘀 𝗳𝗼𝗿 𝗠𝗮𝗿𝗸𝗲𝘁 𝗣𝗮𝗿𝘁𝗶𝗰𝗶𝗽𝗮𝗻𝘁𝘀
𝗙𝗼𝗿 𝗗𝗲𝘃𝗲𝗹𝗼𝗽𝗲𝗿𝘀
𝗥𝗲𝗴𝗶𝗼𝗻𝗮𝗹 𝗦𝘁𝗿𝗮𝘁𝗲𝗴𝘆 𝗗𝗶𝗳𝗳𝗲𝗿𝗲𝗻𝘁𝗶𝗮𝘁𝗶𝗼𝗻: Developers should adopt distinct strategies for Calgary, Edmonton, and smaller Alberta markets, recognizing the unique demand drivers and supply conditions in each region. In Calgary, focus on higher-density apartment projects in transit-oriented locations; in Edmonton, consider a balanced approach between apartments and row/townhouses; in Lethbridge, explore opportunities for student-oriented multifamily developments while being mindful of absorption capacity.
𝗣𝗿𝗼𝗱𝘂𝗰𝘁 𝗠𝗶𝘅 𝗢𝗽𝘁𝗶𝗺𝗶𝘇𝗮𝘁𝗶𝗼𝗻: Focus on apartments in Calgary where data shows strongest demand growth (21.4% increase), while maintaining a more balanced product mix in Edmonton where the growth differential between property types is less pronounced. In smaller markets like Lethbridge, consider mid-density options that align with local market preferences and affordability levels, recognizing the stronger absorption rates for semi-detached and row/townhouse products.
𝗣𝗵𝗮𝘀𝗶𝗻𝗴 𝗮𝗻𝗱 𝗧𝗶𝗺𝗶𝗻𝗴: Consider accelerating project timelines in Calgary where absorption rates support continued growth, while adopting a more measured approach in smaller Alberta markets where the gap between construction and absorption is widest. Pay particular attention to completion-to-absorption differentials when planning project phases to avoid contributing to potential oversupply.
𝗔𝗯𝘀𝗼𝗿𝗽𝘁𝗶𝗼𝗻 𝗥𝗶𝘀𝗸 𝗠𝗶𝘁𝗶𝗴𝗮𝘁𝗶𝗼𝗻: In markets with lower absorption rates, particularly smaller Alberta centers, consider pre-sales strategies, phased development approaches, and flexible construction timelines that can be adjusted based on absorption performance. For apartment developments in these markets, where months of inventory approaches 5.2 months, particular caution is warranted.
𝗙𝗼𝗿 𝗜𝗻𝘃𝗲𝘀𝘁𝗼𝗿𝘀
𝗥𝗲𝗴𝗶𝗼𝗻𝗮𝗹 𝗗𝗶𝘃𝗲𝗿𝘀𝗶𝗳𝗶𝗰𝗮𝘁𝗶𝗼𝗻: Consider allocating investment across multiple Alberta markets to balance risk, with approximately 60% in Calgary, 30% in Edmonton, and 10% in smaller centers based on current growth trends, market sizes, and absorption performance. This approach provides exposure to the stronger growth in Calgary while maintaining diversification benefits.
𝗣𝗿𝗼𝗽𝗲𝗿𝘁𝘆 𝗧𝘆𝗽𝗲 𝗦𝗲𝗹𝗲𝗰𝘁𝗶𝗼𝗻: Focus on property types with stronger absorption rates and lower months of inventory, particularly semi-detached and row/townhouse products which show more favorable absorption metrics across all regions. For apartment investments, prioritize Calgary where absorption rates are strongest (78%) and months of inventory lowest (3.8 months).
𝗬𝗶𝗲𝗹𝗱 𝗘𝘅𝗽𝗲𝗰𝘁𝗮𝘁𝗶𝗼𝗻𝘀: Adjust return expectations based on regional variations in absorption performance, with Calgary likely to deliver lower initial yields but stronger appreciation potential due to higher growth rates and stronger absorption, while smaller markets may offer higher initial yields but potentially more limited long-term appreciation and higher absorption risk.
𝗔𝗯𝘀𝗼𝗿𝗽𝘁𝗶𝗼𝗻 𝗥𝗶𝘀𝗸 𝗔𝘀𝘀𝗲𝘀𝘀𝗺𝗲𝗻𝘁: When evaluating potential investments, carefully assess the relationship between construction growth and absorption capacity in the specific submarket. Properties in areas with months of inventory approaching or exceeding 5 months warrant particular scrutiny, especially if construction activity continues to accelerate.
𝗙𝗼𝗿 𝗣𝗼𝗹𝗶𝗰𝘆𝗺𝗮𝗸𝗲𝗿𝘀
𝗥𝗲𝗴𝗶𝗼𝗻𝗮𝗹 𝗛𝗼𝘂𝘀𝗶𝗻𝗴 𝗡𝗲𝗲𝗱𝘀: Address varying housing supply challenges across Alberta, with Calgary requiring continued support for high-density development near transit corridors, Edmonton needing balanced support across housing types, and smaller centers benefiting from targeted incentives for multifamily development that align with local absorption capacity.
𝗔𝗯𝘀𝗼𝗿𝗽𝘁𝗶𝗼𝗻 𝗦𝘂𝗽𝗽𝗼𝗿𝘁 𝗣𝗿𝗼𝗴𝗿𝗮𝗺𝘀: Consider programs that enhance absorption capacity, particularly in regions and property types where the gap between construction and absorption is widest. These might include first-time homebuyer incentives for multifamily units, rental assistance programs, or tax incentives for purpose-built rental developments.
𝗔𝗳𝗳𝗼𝗿𝗱𝗮𝗯𝗶𝗹𝗶𝘁𝘆 𝗜𝗻𝗶𝘁𝗶𝗮𝘁𝗶𝘃𝗲𝘀: Consider region-specific affordability programs, with Calgary potentially benefiting from inclusionary zoning policies in high-growth areas, Edmonton from rental support programs, and smaller centers from development fee reductions to encourage multifamily construction that matches local absorption capacity.
𝗜𝗻𝗳𝗿𝗮𝘀𝘁𝗿𝘂𝗰𝘁𝘂𝗿𝗲 𝗣𝗹𝗮𝗻𝗻𝗶𝗻𝗴: Align infrastructure investments with multifamily development patterns and absorption trends, prioritizing transit expansion in Calgary where apartment construction and absorption are booming, road and utility upgrades in Edmonton's growth areas, and community amenities in Lethbridge to support its rapidly growing multifamily sector.
𝗦𝘁𝗿𝗮𝘁𝗲𝗴𝗶𝗰 𝗜𝗺𝗽𝗹𝗶𝗰𝗮𝘁𝗶𝗼𝗻𝘀
𝗥𝗲𝗴𝗶𝗼𝗻𝗮𝗹 𝗗𝗶𝘃𝗲𝗿𝗴𝗲𝗻𝗰𝗲: The varying multifamily construction and absorption patterns across Alberta suggest increasingly distinct market cycles, requiring region-specific strategies rather than province-wide approaches. Calgary's stronger growth trajectory (17.9% vs. Edmonton's 12.1%) and superior absorption performance (78% vs. 72% for apartments) indicate different economic fundamentals that should inform investment and development decisions.
𝗔𝗯𝘀𝗼𝗿𝗽𝘁𝗶𝗼𝗻-𝗖𝗼𝗻𝘀𝘁𝗿𝘂𝗰𝘁𝗶𝗼𝗻 𝗕𝗮𝗹𝗮𝗻𝗰𝗲: The current relationship between construction growth and absorption capacity suggests a market that remains in seller's territory but with varying degrees of risk across regions. Calgary shows the healthiest balance with strong absorption supporting continued construction growth, while smaller Alberta markets show signs of potential imbalance if current construction trends continue without corresponding improvements in absorption.
𝗣𝗿𝗼𝗽𝗲𝗿𝘁𝘆 𝗧𝘆𝗽𝗲 𝗘𝘃𝗼𝗹𝘂𝘁𝗶𝗼𝗻: The shifting balance between apartment and row/townhouse construction indicates evolving consumer preferences, with apartments gaining market share across all regions. However, absorption data suggests that lower-density multifamily options (semi-detached and row/townhouses) continue to show stronger market acceptance, creating a potential mismatch between construction focus and absorption performance that warrants monitoring.
𝗠𝗮𝗿𝗸𝗲𝘁 𝗥𝗲𝘀𝗶𝗹𝗶𝗲𝗻𝗰𝗲: Lethbridge has demonstrated greater percentage growth in multifamily construction (34.3%) than either major urban center, suggesting potentially lower risk for developers and investors in this market despite its smaller size. However, this growth must be viewed in the context of weaker absorption metrics in smaller Alberta markets, highlighting the importance of balancing growth opportunities with absorption risk.
𝗬𝗼𝘂𝗿 𝗡𝗲𝘅𝘁 𝗠𝗼𝘃𝗲
Making informed decisions in today's market requires a clear understanding of shifting trends and strategic insights. Whether buying, selling, or investing, I offer tailored strategies to help you achieve your real estate goals.
𝗠𝗶𝗸𝗲 𝗕𝗵𝗮𝗹𝗹𝗮 𝙵𝚘𝚞𝚗𝚍𝚎𝚛 & 𝙸𝚗𝚟𝚎𝚜𝚝𝚘𝚛 | 4𝚑𝚞𝚗𝚍𝚛𝚎𝚍 𝙲𝚁𝙴
𝚁𝙴𝙰𝙻𝚃𝙾𝚁® 𝚊𝚝 𝙶𝚛𝚊𝚜𝚜𝚛𝚘𝚘𝚝𝚜 𝚁𝚎𝚊𝚕𝚝𝚢 𝙶𝚛𝚘𝚞𝚙 (𝙰𝙱) | 𝚃𝚎𝚊𝚖 3000 𝚁𝚎𝚊𝚕𝚝𝚢 (𝙱𝙲)
𝗔𝗻𝗮𝗹𝘆𝘀𝘁: 𝗠𝗶𝗸𝗲 𝗕𝗵𝗮𝗹𝗹𝗮
𝗗𝗮𝘁𝗮 𝗗𝗲𝗿𝗶𝘃𝗲𝗱 𝗙𝗿𝗼𝗺: Canada Mortgage and Housing Corporation (CMHC)
0 notes
Text
0 notes
Text
Hollywood Faces Production Decline Amid Global Competition
Hollywood Faces Production Decline Amid Global Competition
Hollywood is at a perilous crossroads, one that many assume is merely a cyclical downturn in a long-standing industry. However, recent data reveals a stark reality: a staggering 22.4% decline in on-location production over the past year signals an existential crisis for the film and television sectors in Los Angeles. The question begs to be asked—how did we reach this point, and what are the broader implications for our cultural and economic landscape?
In just the first quarter of 2025, the industry recorded approximately 5,300 shoot days compared to over 6,800 during the same period the previous year. This represents not just a decline, but a profound shift in Hollywood's operational dynamics. The backdrop of global competition plays a critical role as countries with more generous incentives aggressively court productions that would once have found a home in Los Angeles.
The economic ramifications of this decline are staggering. The reported 20% drop in production spending—coming in at $11.3 billion—is more than just a financial statistic. Each lost dollar ripples through communities and industries that rely on Hollywood for their livelihoods. When we lose productions, we lose not only jobs but the very heartbeat of a city that prides itself on being the cultural capital of storytelling.
What’s particularly concerning is how this decline echoes past economic misfortunes, reminiscent of Detroit’s auto industry collapse. The ongoing loss of the film and television industry threatens to “hollow out” not just Hollywood but Los Angeles itself. Industry insiders are sounding the alarm, urging for competitive incentives to stave off this exodus, yet decisive action remains elusive.
Strikes compounded the challenges faced by Hollywood. The Writers Guild of America (WGA) and the Screen Actors Guild (SAG-AFTRA) strikes of 2023 served as a wake-up call, revealing deep vulnerabilities within an industry already at a tipping point. These events were not merely labor disputes; they highlighted a broader disconnect between the industry's creative talent and its financial viability.
The trajectory appears bleak, yet there exists a glimmer of hope. The networking of grassroots advocacy with studio executives amplifies the call for change. But recognition must translate into action. The industry's ability to adapt and innovate could play a pivotal role in reversing this trend.
As we look toward the future, one truth remains indisputable: the survival of Hollywood hinges on its willingness to embrace change amidst fierce global competition. If we do not act swiftly, we may find ourselves watching the sun set on an iconic industry—a grim reminder that stagnation leads to decline.
In the face of such challenges, we must reckon with a powerful reality: the arts and culture we cherish demand not only preservation but active support. Hollywood's renaissance will require a collective commitment to adaptability, creativity, and resilience. Let us not sit idle as this cultural pillar erodes; the time for action is now.
0 notes
Text
Ghana’s Inflation Eases to 22.4% in March, But Economic Strain Persists
Summary: Ghana’s annual consumer inflation rate declined to 22.4% in March 2025, marking the third consecutive month of easing, primarily due to a significant decrease in food prices. Despite this downward trend, the inflation rate remains well above the Bank of Ghana’s target range of 6-10%, indicating persistent economic challenges. As reported by Accra Street Journal, while the reduction in…
0 notes
Text
Overview of Adrenocortical Carcinoma (ACC)
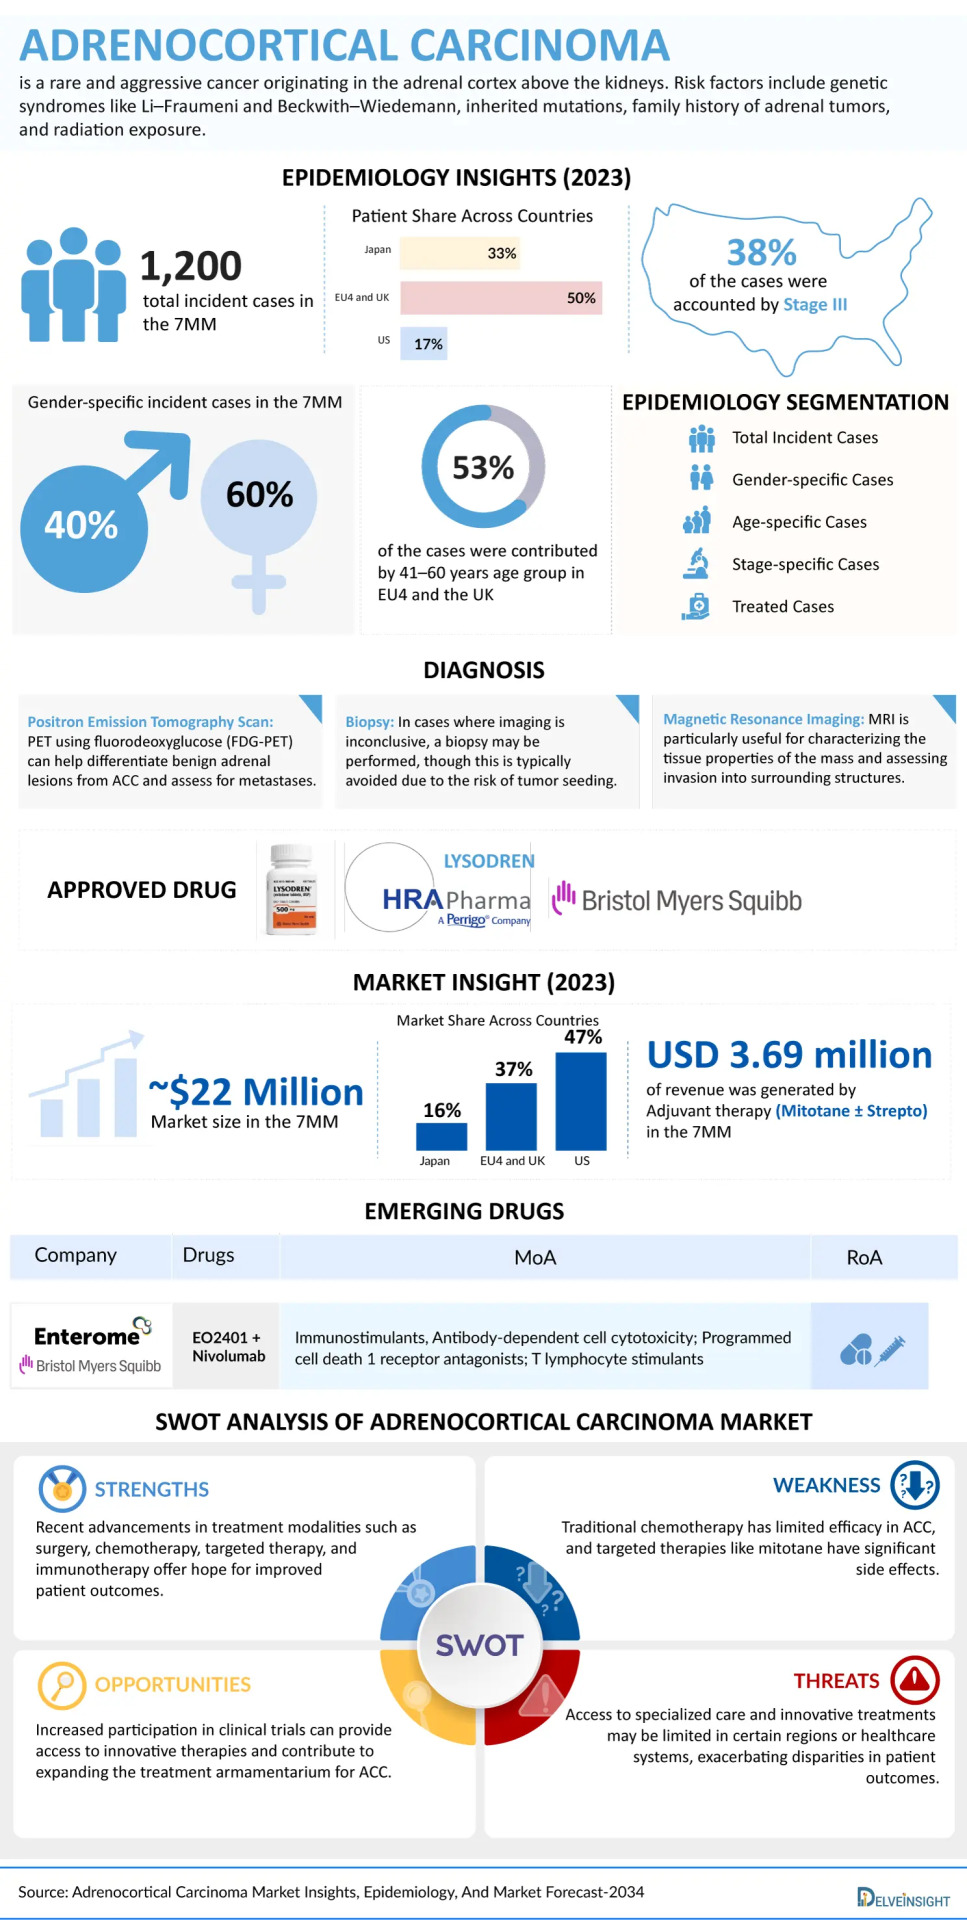
Adrenocortical Carcinoma (ACC) is a rare and aggressive cancer that originates in the adrenal cortex, the outer layer of the adrenal glands responsible for producing hormones such as cortisol, aldosterone, and androgens. ACC is characterized by rapid growth, and due to late-stage diagnosis and limited treatment options, it often carries a poor prognosis.
Early symptoms may be absent, but as the disease progresses, patients can experience:
Abdominal pain
Unexplained weight loss
High blood pressure
Hormonal imbalances (such as those leading to changes in sexual characteristics or irregular menstrual cycles)
Early diagnosis and stage-specific treatments are critical to improving survival outcomes for patients with ACC.
Simplified, visualized, and ready for you—see the infographic!: Click Here
Epidemiological Segmentation of ACC (2020–2034) – 7MM
The 7MM (United States, EU4 [Germany, France, Italy, Spain], the UK, and Japan) provide a comprehensive overview of the incidence and distribution of ACC cases.
Total Number of Incident Cases:
In 2023, there were approximately 1,200 new ACC cases across the 7MM, with this number expected to rise through 2034.
Stage-wise Distribution of Cases (US):
Stage III: 38%
Stage IV: 27%
Stage II: 20%
Stage I: 15%
Gender-based Incidence:
ACC is more common in females (60%) than males (40%).
Age-specific Incidence:
The 41–60 age group represents the highest incidence in EU4 and the UK (53%).
Patients under 20 years account for just 3% of cases.
Regional Insights:
In the United States, there were around 450 cases reported.
Among EU4 and the UK, Germany had the highest incidence (~160 cases), while Spain reported the lowest (~80 cases).
Explore key stats, market drivers, and emerging drugs—all in one visual!: Click Here
Adrenocortical Carcinoma Market Overview
The market size for ACC in the 7MM was estimated at USD 22.4 million in 2023, with growth expected as new treatments and diagnostic methods emerge.
Market Drivers:
Immunotherapy and targeted combination treatments are transforming ACC treatment options.
Rising awareness of ACC, improved diagnostic techniques, and better access to clinical trials are contributing to more early-stage diagnoses and treatment uptake.
Market Challenges:
ACC’s rarity makes large-scale clinical trials difficult, leading to a lack of robust clinical data.
High treatment costs and limited insurance coverage often restrict access to advanced therapies for many patients.
Emerging Therapies
EO2401 + Nivolumab is a promising combination therapy.
Several other investigational drugs are currently in development to improve treatment outcomes for ACC.
Key Industry Players
HRA Pharma
Takeda Pharmaceuticals
Pfizer Inc.
Novartis AG
Bayer AG
Bristol-Myers Squibb Company
Ipsen Biopharmaceuticals, Inc.
Exelixis, Inc.
Genentech, Inc.
Merck KGaA
Want more data like this? Get the infographic now: Click Here
0 notes
Text
Signal Boost: Why Distributed Antenna Systems Are Quietly Fueling a $22.4B Boom
Distributed Antenna System (DAS) market is on a strong growth trajectory, projected to increase from $12.5 billion in 2024 to an impressive $22.4 billion by 2034, reflecting a CAGR of approximately 6%. This surge is driven by the escalating demand for improved wireless connectivity in densely populated or structurally complex areas. DAS technology involves deploying multiple small antenna nodes throughout a building or geographic area, all connected to a central source. These nodes work together to amplify signal strength and ensure seamless mobile coverage, particularly where traditional cell towers struggle to deliver consistent service. This system is particularly crucial in urban environments, stadiums, airports, hospitals, and large commercial buildings — spaces where strong mobile signals are essential but often hard to maintain due to signal interference or building materials. The indoor DAS segment holds a dominant 55% share, while the outdoor segment captures the remaining 45%, reflecting a balanced need for robust connectivity across both types of infrastructure.
To Request Sample Report : https://www.globalinsightservices.com/request-sample/?id=GIS20199 &utm_source=SnehaPatil&utm_medium=Article
Market Dynamics
Several key factors are shaping the DAS market landscape. The growing proliferation of smart devices and the surge in mobile data consumption have made high-speed, uninterrupted connectivity more critical than ever. With the rollout of 5G and the increasing adoption of IoT (Internet of Things), DAS solutions are becoming indispensable in maintaining network integrity and performance.
On the flip side, the market faces a few hurdles. High installation and maintenance costs, particularly for brownfield projects, can deter potential adopters. Moreover, regulatory complexities and the need for frequent infrastructure upgrades to keep up with rapidly evolving technologies add additional layers of operational challenge. Despite these constraints, the DAS market continues to thrive, buoyed by emerging trends such as hybrid systems combining indoor and outdoor capabilities, and the integration of artificial intelligence to enhance system performance.
Buy Now : https://www.globalinsightservices.com/checkout/single_user/GIS20199/?utm_source=SnehaPatil&utm_medium=Article
Key Players Analysis
The DAS market is defined by a mix of established players and innovative newcomers. Leading companies like CommScope, Corning Incorporated, and AT&T continue to invest in advanced DAS technologies, focusing on partnerships and product enhancements that drive market growth. These firms are at the forefront of enabling seamless 5G integration and improving system scalability.
In addition to the industry heavyweights, a new wave of players is emerging, bringing fresh perspectives and technological innovations. Companies such as Signal Wave, Wave Connect, and DASLink Innovations are carving out niches through specialized offerings and agile deployment models. The competitive landscape is evolving rapidly, with collaboration and strategic alliances becoming a preferred approach to capturing market share and accelerating deployment times.
Regional Analysis
North America remains the undisputed leader in the DAS market, thanks to its advanced telecom infrastructure and early adoption of emerging technologies. The United States spearheads this growth with large-scale investments in enhancing both urban and rural connectivity.
Europe follows closely, driven by regulatory mandates to improve mobile coverage and a strong focus on smart city development. Germany and the UK are among the key contributors in this region. Asia Pacific, however, is the fastest-growing region. Countries like China and India are investing heavily in telecom infrastructure to support their digital economies, fueling a rapid rise in DAS deployments.
In the Middle East and Africa, the market is gaining traction through smart city projects and the need for better mobile communication in challenging terrains. Meanwhile, Latin America shows promising growth, particularly in Brazil and Mexico, as 4G and 5G networks expand and mobile user bases grow.
Recent News & Developments
The DAS market is witnessing several exciting developments. Technological innovation continues to push boundaries, with hybrid systems gaining popularity due to their ability to provide holistic coverage across varied environments. These systems are especially beneficial in mixed-use developments and large public spaces.
Another noteworthy trend is the market’s alignment with sustainability goals. Energy-efficient DAS solutions are emerging, catering to environmentally conscious businesses and government mandates. Meanwhile, pricing for DAS deployments remains variable, ranging from $5,000 to $50,000 per node, influenced by deployment complexity and feature sets like 5G readiness.
Regulatory updates also play a critical role, with governments worldwide tightening requirements to ensure network reliability and security, prompting vendors to prioritize compliance and robust design in their offerings.
Scope of the Report
This report provides an in-depth look into the global Distributed Antenna System (DAS) market, covering historical data from 2018 to 2023 and forecasts from 2025 to 2034. It examines the market across various segments including type, product, services, deployment, and application. Both qualitative and quantitative insights are provided, helping stakeholders understand key growth drivers, challenges, and emerging opportunities.
The report also analyzes the competitive landscape, featuring company profiles, development strategies, and detailed evaluations of market trends. With a global outlook and regional deep-dives, it equips businesses with the intelligence needed to make informed, strategic decisions in a rapidly evolving telecommunications landscape.
About Us:
Global Insight Services (GIS) is a leading multi-industry market research firm headquartered in Delaware, US. We are committed to providing our clients with highest quality data, analysis, and tools to meet all their market research needs. With GIS, you can be assured of the quality of the deliverables, robust & transparent research methodology, and superior service.
Contact Us:
Global Insight Services LLC 16192, Coastal Highway, Lewes DE 19958 E-mail: [email protected] Phone: +1–833–761–1700 Website: https://www.globalinsightservices.com/
0 notes