#this report is weekly and tracks viewership hashtags and social media engagement
Explore tagged Tumblr posts
Visit Tumblr Blog
Explore Tumblr blogs with no restrictions, modern design and the best experience.
Last Seen Tumblr Blogs


Fun Fact
The KCSC sent more than 20K requests to delete posts related to prostitution and porn to Tumblr from January to June 2017.
Text
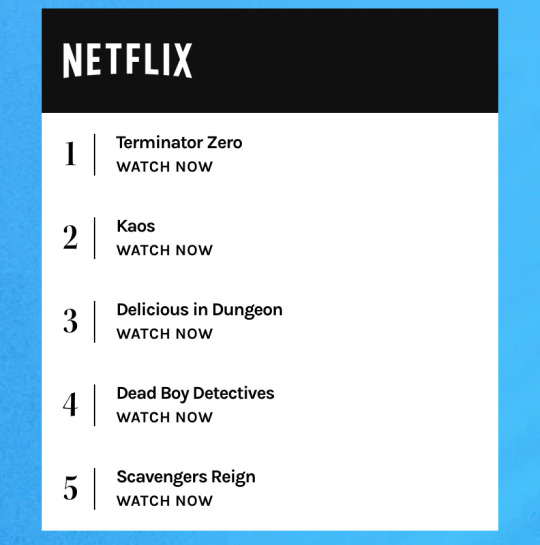
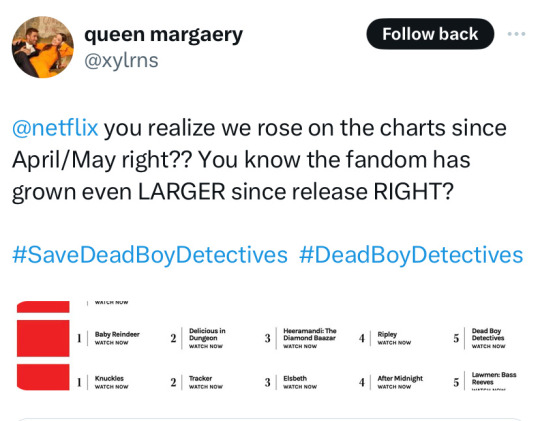
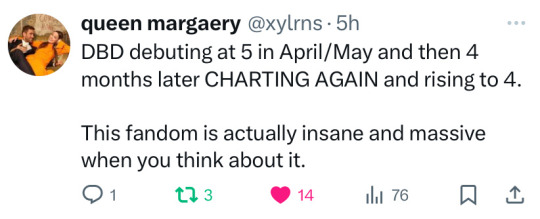
in case you were curious, dead boys did achieve charting again! and i do indeed find it very funny.
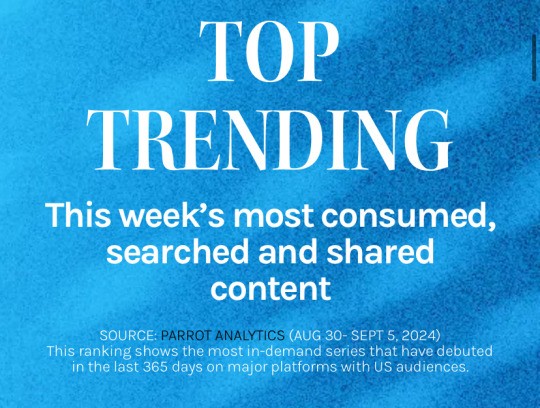
#dead boy detectives#note that this is certainly a rise in engagement due to the cancellation. however it's been a month of continued trending.#this report is weekly and tracks viewership hashtags and social media engagement#on twitter the show trends with over 6.5k posts per day#every day
893 notes
·
View notes
Text
All of the Social Media Metrics That Matter
Did you know that when it comes to social media metrics, there are hundreds you could be analyzing? But the real question is, do you know where to find them and are they all necessary for your business? In this post, we’re going to look at the metrics you can gather from the top social networks and which ones matter most for your business.
Sprout features mentioned in this article:
Facebook analytics
Twitter analytics
Twitter keyword report
Instagram management
Instagram analytics
LinkedIn company pages report
Social media analytics dashboard
What Are Social Media Metrics?
Social media metrics are data and statistics that give you insights into your social media marketing performance.
While some social media marketing metrics are universal, there are also platform specific metrics you need to learn. Plus, some data is calculated differently depending on the platform and social media metrics tools you’re using.
But don’t worry, we have you covered. We’re going to break down all of the social media metrics you need to know:
Official Social Media Metrics
First, let’s look at the metrics you can get directly from the top social networks. Here’s how you find them and what you can learn from them.
Facebook Insights Metrics
Facebook offers the most comprehensive metrics for business pages. You can start by going to the Platform Insights page to see a list of all of your Facebook Pages currently tracking metrics.
When you click on the Page you want to analyze, you will be taken to the Facebook insights report for that specific Page. Here, you will find an overview of your most important metrics, followed by detailed sections on your Likes, reach, visits, posts and people. We’ll break down the important sections of Facebook Insights below.
Overview Tab
The overview starts with your Page’s main data points.
This includes the following metrics:
Page Likes: Total Page Likes is the number of unique people who like your Page. New Page Likes shows the number of new Likes your Page received during the last seven days, compared with the previous seven-day period.
Post Reach: Total Reach is the number of unique people who have seen any content associated with your Page, including ads, during the last seven days. Post Reach shows the number of unique people who have seen your Page posts.
Engagement: People Engaged is the number of unique people who have clicked, Liked, commented on or shared your posts during the last seven days.
Next, you will see an overview of the social media engagement metrics for the last five posts on your Facebook Page.
These metrics include the following:
Reach: Post reach is the number of people who have seen your post. Your post counts as reaching someone when it’s shown in the News Feed. Figures are for the first 28 days after a post was created and include people viewing your post on desktop and mobile.
Engagement: People engaged is the number of unique people who’ve clicked, Liked, commented on or shared a post on your Page. In the Overview section of your Page Insights, you can see People Engaged for the last seven days.
At the bottom of the Overview page, you will find metrics for Pages you watch, such as your competitor’s Facebook Pages.
Here, you can see the following weekly metrics on your competitors:
Total Page Likes
Number of new posts
Engagement
Likes Tab
The Likes tab gives you detailed metrics on trends for your net Likes.
Your net Likes combines the following metrics:
Unlikes: Number of people who have unliked your Page.
Organic Likes: Number of people who have Liked your Page, not as a result of a Facebook Ad campaign.
Paid Likes: Number of people who have Liked your Page as a result of a Facebook Ad campaign.
Net Likes: The number of new Likes minus the number of unlikes on your page.
Beneath that, you will find a chart showing the source of your Likes. Included are the number of Likes you receive on your Facebook Page itself, from related Page suggestions on other Pages, posts that other people make on your Page and Likes from mobile users.
Reach Tab
On the Reach tab, you can review two different sets of metrics that affect your reach. After a graph showing your overall organic versus paid reach, you will see a graph showing your overall post Likes, comments and shares. This chart is extremely helpful to monitor because if these metrics increase, you will reach more people organically.
Next, you will see how many times people on Facebook hide your post, report posts as spam or unlike your Page. If these metrics increase, you will reach less people organically. It’s also a sign that your audience is not connecting or resonating with the content you’re sharing. Check out these tips to build an engaged audience on social.
Posts Tab
On the Posts tab, you will see detailed metrics for your individual Facebook Page posts. By default you will start by viewing your post’s organic versus paid reach and the post clicks, Likes, comments and shares. Note that the Post Clicks metric means any click on your Facebook post itself and not just clicks from your post to a website link.
You can use the first drop-down to switch from seeing your organic versus paid reach to organic versus paid impressions. Note the difference in the reach versus impressions metrics.
Impressions: The number of times a post from your Page is displayed, whether the post is clicked or not. People may see multiple impressions of the same post. For example, someone might see a Page update in News Feed once, and then a second time if their friend shares it.
Reach: The number of people who received impressions of a Page post. Reach might be less than impressions since one person can see multiple impressions.
You can use the second drop-down to switch from seeing post clicks, Likes, comments and shares to seeing only Likes, comments and shares; post hides, spam reports and unlikes; or engagement rate percentage. The latter is defined as follows.
Engagement Rate Percentage: Engagement rate is the percentage of people who saw a post that Liked, shared, clicked or commented on it.
People Tab
On the People tab, you will find a breakdown of demographic metrics for your fans, the people you’ve reached with your Page posts and the people who have engaged with your Page posts. This information can be utilized to ensure that you are getting the right fans for your business and to help create better content for your audience.
Facebook also lets you export additional data about your Page, posts and uploaded videos. This gives you raw data about your Page’s activity, and each metric is defined within the spreadsheet.
Facebook Video Metrics
If you publish videos to Facebook, you’ll have access to in-depth video metrics.
Total views: The total number of people who saw your video(s). Views are also broken down by the duration of your videos people watched—10 seconds, 30 seconds or 95%. Plus, you can see how many of the views were auto play, click to play or viewed with the sound on.
Average completion percent: The average amount of time people watch your videos. Audience retention is important because it gives insights into how engaging and captivating your videos are. If you’re not holding their attention for very long, you may need to make changes to the videos you’re creating and sharing.
Peak live viewers: The highest number of viewers you had during a Facebook Live stream. Your peak viewership time can help you plan for the best time to host future live streams.
Video engagement: The number and types of engagement your videos receive. Knowing the number of people who viewed your videos is nice. But did the viewers actually enjoy your content? Keep tabs of your video engagement metrics to gauge how well received your videos and live streams are to users.
For those who would prefer a cleaner summary of their Facebook Insights, Sprout Social provides one simple report for Facebook analytics. With our report, you can see key social media metrics like the overall Page Likes, impressions and demographics of any page you manage.
You can also see details on how your content is performing and how people engage with specific posts on your Facebook Page.
This gives you the vital information you need about your Facebook Page in one report, versus navigating through multiple tabs.
Twitter Analytics
While not as detailed as Facebook, Twitter offers its own analytics for all account users. When you arrive at your analytics dashboard, you will be greeted by a 28-day summary of metrics and highlights for your activity by month.
Included are the following metrics.
Related Articles
More Social Media Analytics Resources
Complete Guide to Hashtag Analytics
9 Ways Social Media Measurement Can Improve Your Marketing Strategy
Reach vs Impressions: What’s the Difference in Terms?
Tweets: The number of Tweets you’ve posted to your account.
Tweet Impressions: The number of people that have seen your Tweets have been seen by.
Profile Visits: The number of people who have visited your profile.
Mentions: The number of times your username has been mentioned by others.
Followers: The number of followers on your Twitter account.
Tweets Linking to you: The number of Tweets attributed to you in Twitter Cards with URLs.
On the Tweets tab, you will see a 28-day summary of metrics for the Tweets you’ve shared.
These metrics include the following.
Engagement Rate: The number of total link clicks, Retweets, favorites and replies your Tweets receive divided by the number of impressions.
Link Clicks: The number of times links within your Tweets were clicked. This includes links to hashtags and other users mentioned in your Tweets.
Retweets: The number of times your Tweets were retweeted by others.
Favorites: The number of times your Tweets were favorited by others.
Replies: The number of times people replied to your Tweets.
You can click on any Tweet on this screen to see more detailed metrics.
On the Audience tab, you will get a detailed breakdown of demographics, organized by:
Lifestyle
Consumer behavior
Mobile footprint
For those who would prefer a simpler summary of their Twitter analytics, Sprout Social provides one easy-to-digest report. In a quick glance, you can see all of your main metrics such as impressions, engagement, link clicks and more.
You can see demographic data as well.
The Twitter keyword report gives you additional data on conversations going on about your brand, so you can measure your share of voice.
Instagram Analytics
In the early days, businesses had very limited insights into how their Instagram posts performed. But with the introduction of Instagram Insights and Sprout’s Instagram management tools, you now have a lot of helpful information at your disposal.
If you switch from a personal account to an Instagram business profile, you’ll be able to see an overview of your posts’ performance and demographic information about your audience.
Impressions: The total number of times your posts have been seen.
Reach: The number of unique accounts that have seen your posts
Profile views: The number of times your profile was viewed.
Engagement: The number of likes and comments on your posts.
Saved: The number of unique accounts that saved your posts.
Instagram Insights gives you a “top posts” section where you can see your best performing posts sorted by these specific metrics.
For even more data, you can use Sprout’s Instagram analytics dashboard. With this report, you can see your post performance and follower growth for multiple profiles in a single dashboard. Plus, the reports are presentation-ready in case you need to show them to clients or other team members.
In addition to looking at your individual posts, we also included hashtag reporting. Since hashtags are such an important part of your Instagram marketing strategy, you need to track which ones perform the best.
Want to know how your Instagram Stories are performing? Use our advanced analytics from Simply Measured to get insights into how people engage with your Stories. See metrics like:
Taps forward
Taps back
Story replies
Exits
Between Instagram Insights and Sprout’s suite of analytics, you have plenty of data to use for planning out new content and spotting Instagram trends in your past posts.
LinkedIn Analytics
When you visit your LinkedIn Company Page you can click on the Analytics tab to learn more about your post performance and audience. First, you will see metrics for individual posts made by your Company Page.
These metrics include the following.
Impressions: The number of times the update was shown to LinkedIn members.
Clicks: The number of clicks on your content, company name or logo.
Interactions: The number of likes, comments and shares on your update.
Followers: The number of followers you acquired when sponsoring an update.
Engagement: The number of interactions divided by number of impressions.
Next, you will see information about your followers and how you compare to similar companies.
Finally, you’ll see metrics for your page views, unique visitors and visitor demographics. Use the drop-down to switch between seniority, industry, company size and function.
To keep all your social media metrics in one place, you can use Sprout’s LinkedIn Company Pages report. Our analytics lets you measure the performance of your posts, get demographics on your audience and more. Like our other reports, everything is neatly organized into a single page.
Pinterest Analytics
If you have a Pinterest business account, you can access Pinterest analytics to learn more about your profile activity, audience and Pins. You will start on the Overview screen where you can see key metrics for your profile, audience, activity from your domain and most popular Pins.
In the Your Pinterest Profile section, you will see detailed metrics for your profile’s impressions, daily viewers and Pins. You can use the tabs at the top of the report to see top Pins based on number of impressions, Repins, clicks and all-time favorites.
In the Your Audience section, you can see metrics for your average monthly viewers, average monthly engaged and specific demographics and interests.
In the Activity from your domain section, you can see pinning activity from the website you have verified for your page using the Pin It button. You can use the tabs at the top to see top pins from your domain based on impressions, repins, clicks and all-time favorites.
Google+ Insights
Google+ does not offer many metrics for its Pages. On your main dashboard, you’ll find an overview of your most important metrics.
If you click “View insights,” you will find three sections of data. The first is the Visibility section.
Here, you’ll see your total views, broken down by:
Pageviews
Post views
Photo views
In the Engagement section, you will see metrics about the posts to your Google+ page. These include total actions, +1’s, comments and shares. Beneath the detailed metrics for your posts, you will see average actions by post type.
In the Audience section, you get a quick demographics overview of your Page followers.
Google Analytics Metrics for Social Media
Now that you know what kind of metrics you can get out of the top social media networks, let’s discuss the most crucial metrics for your business.
Using Google Analytics goals, you can learn more about conversions on your website, such as:
Product sales
Lead submissions
Email subscriptions
Combine your goals with the built-in social media reports within Google Analytics to find out which social networks are best for your business.
Under the Acquisition section, you’ll find a few useful social media reports that show which social networks drive traffic and customers to your website.
Under Social Referrals, you will get a more detailed breakdown of the following metrics based on social network referral traffic.
The metrics here include:
Sessions: The periods of time when a user is active on your website.
Pageviews: Instances of a page being loaded (or reloaded) in a browser.
Avg. Session Duration: The average length of sessions on your website.
Pages / Session: The average number of pages viewed per session.
In the Social Conversions report, you’ll see which networks lead to conversions on your website, along with dollar values. The dollar value is only visible if you set your Google Analytics goal up with a specific dollar value per conversion.
Analyzing your social media performance metrics and statistics is important for every business. These reports can help you determine where to focus your energy when it comes to specific social media networks. More than tracking followers and engagement, they will show you which networks ultimately help your bottom line.
Try Sprout’s social media analytics dashboard to have all of your social media metrics in one location.
This post All of the Social Media Metrics That Matter originally appeared on Sprout Social.
from SM Tips By Minnie https://sproutsocial.com/insights/social-media-metrics-that-matter/
0 notes
Text
The recipe behind Buzzfeed’s Tasty success story
Beginning with the French Chef 1963 TV show setting the standards for online cooking and moving to successful online cooking delivery business models such as Martha Stewart, using digital media to share cooking ideas is clearly a successful trend. Step by step cooking guidelines, recipes with short preparation time frames, varied and nutritious menus created by in-house nutritionists, naturally sourced ingredients, relatable presenters and flexible order deliveries are the standard success drivers but by adding the following nuances, Buzzfeed’s Tasty series epitomized the free online cooking idea’s model. The viral digital publisher’s “Tasty” Food Brand truly created a “World Wide Rave” as David Meerman Scott would put it.
Reasons for page virality and hype was the unique digital marketing synergy of finding a growing theme trend, harnessing the preferred media and learning styles for segmented buyer personas, creating exemplary content for each segment, leveraging social media and search engine marketing and continuously testing, adjusting and improving practices.
Decipher the trends and leverage the appropriate media
According Sharablee on an Adweek post, food content and healthy lifestyles is one the fastest growing online categories. Also, digital video is an industry growing at a more than 20% annual growth since last year according to eMarketer, 2016. Video marketing is effective in leading targeted traffic to visit specific landing pages, improves social media sharing and boost conversions and digital marketing ROI.
Be valuable, brief and keep it light
For overworking people solving the problem of “how can I find something healthy to eat today” is a true concern. Combining this “frustration” with an activity we could perform ourselves to destress from our daily hurdles, feeling childish, cheerful and creative again is something we crave. But we want it quick and original. Tasty cooking videos positioned cooking as an inspirational and sharable task that is achievable even from the cooking amateurs. DIY is also on the rise and cornerstone in content marketing. The Tasty team succeeded in thinking from their buyer’s perspective and creating snackable, remarkable and entertaining content that is easily shareable across social media accounts and digital devices. Using a light, upbeat and humorous-approach to convey their story-like recipes they managed to produce buyer-centric, graspable and efficient content in their instructive 1 minute quality videos that were also mobile optimized. Focusing on valuable and free content creation they achieved authentic audience connection and were consistent in their playful, memorable and uptempo brand personality.
Decoding Tasty’s thought leadership video content reveals a unique mixture of creative and mostly healthy recipes, easily replicable with limited supplies (apparent through their “5 ingredients or less recipes” section), smooth hand movement videos, and a flair of professionalism with recipes prepared as if from the point of view of actual cook.
The site is made-up of a range of segment videos that lead to sub-pages indicating the emphasis on niche audience targeting for meaningful connections. From breakfast, dinner, appetizers, dessert recipes, the "Tasty Happy Hour" section on alcoholic beverages, "Tasty Fresh" and the variations of the same dish in the “Recipes 4 Ways” section, Tasty caters for diverse tastes. The multitude of section offerings aims to provide relevant and thus, shareable content for diverse audiences. The best examples are "Tasty Junior” which became its own page TastyJr.com with its personalized cookbook for kids, sections on international cuisines such as British, Portuguese, French etc. and "Tasty Story" with celebrities such as Marcus Samuelsson and Martha Stewart taking the lead.
Content marketing & link building for SEM results
According to David Meerman Scott content marketing is indeed the best recipe for SEM. “Brand journalism” as he calls it; thinking as publisher of information instead of a product advertiser and selling free advice rather than products, pays off online. Tasty cooking series used short and catchy titles and descriptions in their videos and leveraged the long tail of search using targeted keyword search terms. For SEM organic search including keywords and phrases that buyers are searching on search engine's is recommended and Tasty aced the game. Furthermore, successful link building on social channels for content promotion is also key to success. Links of Tasty’s videos lead to unique landing pages offering specific content for the per case targeted buyer personas.
Ubiquitous Social Network presence & impressive stats
Tasty started out optimized for Facebook but soon deployed its presence across all major social media networks with native video uploads. The team continuously posted visually rich content across Facebook, YouTube, Instagram, Twitter, Pinterest, Vine and Tumblr accounts to increase reach of videos and boost engagement and they also optimized social sharing buttons. Their good branding, social selling reach and use of social media etiquette lead to impressive social networking stats.
According to TubularInsights’ “February’s Most-Watched Facebook Publishers” Leaderboard Report 2017 Tasty ranked at #6. Their results are so remarkable that it is worth considering some actual numbers per social networking platform:
Tasty’s total Social Reach across the 5 major social networking platforms was as high as 94.9m with 87% followers on Facebook. Its February Total Views reached 1.3bn, 93% of which was from Facebook alone (1.2bn). Total Facebook Views since the page was launched on July 31, 2015 are 29.4bn with an average view per video of 23.6m people! 25% of active Facebook users watch at least 1 video every month!
Visiting Tasty’s “Likes” Facebook page on March 16th, “Total Page Follows” were more than 83m with a 0.6% weekly increase, “People Talking About This” stats were more than 8m and there was a 30.5% increase in “New Page Likes” to more than 470K. For content uploaded only 1 day ago they received 5.7m views, 82.8K likes and 40.9K shares. Their posts were also optimized for Facebook’s autoplay feature and Tasty also leveraged the fact that the food category in general has mass appeal which makes it easy to insert ads.
Their YouTube channel is the fastest growing platform with more than 2m Subscribers and Total Views peaking to approx. 350m on March 16. They have a total of 751 videos uploaded and an average view per video of 450K people. Their last 90 days channel stats included 190 uploads, 60.5m views and and an impressive engagement of 63.1K comments. Just in the last 7 days likes were up by 127K! They also have an impressive link building per YouTube post. A single post might be accompanied with as many as 5 links landing on their Facebook page, different landing pages on Buzzfeed’s website such as “Customize and Buy the Tasty Cookbook Today” or “Find Recipes Here” and the Cast & Crew Lead Producer’s BuzzFeed Motion Pictures Page.
As expected, there is a clear upward trend Tasty’s Instagram viewership. For their 614 posts (of which 379 were videos) including explicit recipe preparation they have achieved 8.9m Total followers, 542m Total Views and an Average View per Video of 1.4m people. For posts uploaded just 1 day ago (i.e. 15 March) there received 871K Views, 72.2K Likes and more than 1.3K Comments. Tasty maintains a regularly updated account making approx. 1 daily post. For their last week’s posts (3/8/17-3/15/17) they received approx. 1.5m Views and 1.7m Comments! Most importantly, as an indication of user engagement and sharing of content, most users are tagging posts to their friends!
Tasty is not not so active in Vine with 305K total followers and 214m Total Views for their 185 posts and with a stable follower growth trend in this account for the last month. On Pinterest they have 631K total followers, have segmented their boards per category, and have an average of 3.5K pins per post. They also make good use of Tumblr etiquette applying hashtags and appropriate category tags. For their latest Tubmlr posts they received an average of 3K notes, 2K likes and 700 reblogs per post! Last, on Twitter they have more than 428K Followers, more than 1.4K Likes and most importantly 575 Tweets. They also have links to their iTunes app, Buzzfeed page and Vine account proving their stunning link building and cross social platform practices.
Data driven decisions, test & improve
Tasty’s data leveraging was apparent first from their informed adjustments of ingredients swapping healthier for less healthy choices and effective use of analytics to determine the platform and time with optimal audience response for their posts.
Tasty is truly rocking it!
NBCUniversal has doubled its investment in Buzzfeed and evidence of Tasty’s success is that the brand is planning to air cooking spots on NBC's Today show. Also, a by-product of Tasty’s success is Goodful’s Facebook (with more than 12m likes) and BuzzFeed’s page creating original shows on Healthy lifestyle.
Always track meaningful success metrics
Tasty is indeed the epitome of social media and buzz marketing success. Not only have they received sky-high number of Views, Likes and Followers across all their accounts but they have also excelled in user engagement with their content. As shown, their "share rate" ratio (social shares/impressions x 100) and other much more meaningful social media metrics (pins, reblogs, tweets) of valuable and resonating content were exceptionally good. According to Adweek Tasty has a well-performing video benchmark of 33% share rate and 165,000 shares per video. Also credible industry sources such as Adweek and Fortune have praised the brand’s cooking ideas and success.
Nevertheless, as explained in Adweek, savvy digital marketing and media analysts should also track “ROI-related metrics such as brand lift, ad recall and sales”. As stated in the relevant article, “one of the challenges with branded content and native advertising right now is measuring it from a brand rather than a publisher perspective”.
#Buzzfeed#Tasty#Goodful#Facebook#Tasty cooking series#success#cooking#cooking videos#5 ingredients or less recipes#Tasty Happy Hour#video marketing#Recipes 4 Ways#Tasty Junior#David Meerman Scott#Adweek#Tubular#viral#buzz marketing#content marketing
0 notes
Text
Prev tags: #dead boy detectives#note that this is certainly a rise in engagement due to the cancellation. however it's been a month of continued trending.#this report is weekly and tracks viewership hashtags and social media engagement#on twitter the show trends with over 6.5k posts per day#every day
in case you were curious, dead boys did achieve charting again! and i do indeed find it very funny.
893 notes
·
View notes