#opentelemetry
Explore tagged Tumblr posts
Visit Tumblr Blog
Explore Tumblr blogs with no restrictions, modern design and the best experience.
Last Seen Tumblr Blogs


Fun Fact
Tumblr was named as a finalist in Lead411’s New York City Hot 125 in Aug 2010.
Text
Report Shows OpenTelemetry’s Impact on Go Performance
Observability in software development has become a cornerstone for building reliable and efficient systems. A recent report highlights OpenTelemetry’s impact on Go performance, shedding light on how this open-source observability framework influences the efficiency of applications written in the Go programming language. As Go, also known as Golang, continues to gain traction for its simplicity and performance in cloud-native environments, understanding the implications of integrating tools like OpenTelemetry is crucial for developers aiming to optimize their systems.
This blog explores the findings of the report, diving into how OpenTelemetry affects Go applications, its benefits, challenges, and practical considerations for developers. With observability becoming a non-negotiable aspect of modern software, this analysis provides insights for Go developers seeking to balance performance with robust monitoring.
What is OpenTelemetry and Why It Matters for Go
OpenTelemetry is an open-source project under the Cloud Native Computing Foundation (CNCF) that provides a standardized way to collect, process, and export telemetry data, including traces, metrics, and logs. For Go developers, it offers a powerful toolkit to gain visibility into application behavior, especially in distributed systems like microservices architectures. Go’s lightweight concurrency model and fast execution make it a popular choice for high-performance applications, but without proper observability, debugging and optimizing these systems can be challenging.
The report emphasizes that OpenTelemetry’s integration with Go enables developers to instrument their code efficiently, capturing critical data about request latencies, error rates, and system resource usage. This visibility is essential for identifying bottlenecks and ensuring applications run smoothly in production.
The Role of Observability in Go Applications
Go’s design prioritizes simplicity and performance, making it ideal for building scalable systems. However, as applications grow in complexity, developers need tools to monitor and understand their behavior. OpenTelemetry fills this gap by providing a standardized approach to observability, allowing developers to collect telemetry data without relying on proprietary solutions. This standardization is particularly valuable in Go, where minimalism is a core principle, as it aligns with the language’s philosophy of avoiding unnecessary complexity.
Key Findings on OpenTelemetry’s Impact on Go Performance
The report provides a detailed analysis of how OpenTelemetry affects Go applications, focusing on performance metrics such as latency, throughput, and resource consumption. While OpenTelemetry enhances observability, it introduces some overhead, which developers must carefully manage to maintain Go’s hallmark efficiency.
Performance Overhead of Instrumentation
One of the primary concerns for Go developers is the potential performance cost of adding observability. The report reveals that OpenTelemetry’s instrumentation, when properly configured, introduces minimal overhead—typically less than 5% in terms of CPU and memory usage for most workloads. This is a testament to Go’s efficiency and OpenTelemetry’s lightweight design. However, in high-throughput systems processing millions of requests per second, even small overheads can accumulate, requiring developers to optimize their instrumentation strategies.
For instance, the report notes that excessive tracing or poorly configured sampling can increase latency. By using techniques like adaptive sampling, where only a subset of requests is traced, developers can mitigate this impact while still gaining valuable insights.
Benefits of Enhanced Observability
Despite the minor overhead, the report underscores the significant benefits of OpenTelemetry’s impact on Go performance. By providing detailed traces and metrics, OpenTelemetry helps developers pinpoint performance issues quickly. For example, in a case study highlighted in the report, a Go-based microservice reduced its average request latency by 20% after using OpenTelemetry to identify a bottleneck in a database query. This kind of actionable insight is invaluable for maintaining high-performing systems.
Moreover, OpenTelemetry’s compatibility with popular observability platforms like Prometheus, Jaeger, and Grafana allows developers to visualize and analyze data effectively, further enhancing their ability to optimize Go applications.
Challenges of Implementing OpenTelemetry in Go
While the benefits are clear, integrating OpenTelemetry into Go applications is not without challenges. The report outlines several considerations developers must address to ensure successful adoption without compromising performance.
Configuration Complexity
OpenTelemetry’s flexibility comes with a learning curve. Configuring exporters, samplers, and processors requires a deep understanding of both the tool and the application’s architecture. The report notes that misconfigurations, such as overly verbose logging or incorrect sampling rates, can lead to performance degradation. For Go developers, who often prioritize simplicity, this complexity can feel counterintuitive.
To address this, the report recommends starting with minimal instrumentation and gradually expanding as developers become familiar with OpenTelemetry’s components. Using Go-specific libraries, such as the OpenTelemetry Go SDK, can also simplify the process.
Balancing Observability and Performance
Another challenge is striking the right balance between observability and performance. The report highlights that excessive telemetry collection can strain system resources, particularly in resource-constrained environments like edge computing. Developers must carefully select which metrics and traces to collect, focusing on those that provide the most value for debugging and optimization.
Best Practices for Using OpenTelemetry with Go
To maximize the benefits of OpenTelemetry’s impact on Go performance, the report offers several best practices for developers. These strategies help minimize overhead while ensuring robust observability.
Optimize Sampling Strategies
Sampling is a critical factor in managing OpenTelemetry’s performance impact. The report suggests using probabilistic or rate-based sampling to reduce the volume of telemetry data without sacrificing visibility. For high-traffic Go applications, adaptive sampling—where the sampling rate adjusts based on system load—can further optimize performance.
Leverage Context Propagation
Go’s concurrency model, with its goroutines and channels, requires careful handling of request context. OpenTelemetry’s context propagation ensures that telemetry data is correctly associated with the right request, even in highly concurrent systems. The report emphasizes the importance of properly propagating context to avoid gaps in traces, which can obscure performance issues.
Monitor Resource Usage
To prevent unexpected performance hits, developers should monitor the resource usage of OpenTelemetry itself. Tools like Prometheus can track the CPU and memory overhead of instrumentation, allowing developers to fine-tune configurations as needed.
Real-World Applications and Success Stories
The report includes several case studies demonstrating OpenTelemetry’s impact on Go performance in real-world scenarios. One notable example is a fintech company that used OpenTelemetry to optimize a Go-based payment processing system. By analyzing traces, the company identified inefficiencies in its API calls, reducing transaction times by 15% and improving customer satisfaction.
Another case study involves a cloud-native startup that integrated OpenTelemetry into its Go microservices. The detailed metrics provided by OpenTelemetry allowed the team to scale their infrastructure more efficiently, reducing costs while maintaining performance.
Future Outlook for OpenTelemetry and Go
As observability continues to evolve, OpenTelemetry is poised to become a standard tool for Go developers. The report predicts that future improvements in OpenTelemetry’s Go SDK will further reduce overhead and simplify integration. Additionally, advancements in automated instrumentation could make it easier for developers to adopt OpenTelemetry without extensive manual configuration.
The growing adoption of Go in cloud-native and serverless environments also underscores the importance of tools like OpenTelemetry. As more organizations rely on Go for critical workloads, the ability to monitor and optimize performance will be a key differentiator.
OpenTelemetry’s impact on Go performance is a game-changer for developers building high-performance, observable systems. While it introduces some overhead, the benefits of enhanced visibility and actionable insights far outweigh the costs when implemented thoughtfully. By following best practices like optimized sampling and context propagation, Go developers can harness OpenTelemetry to build faster, more reliable applications.
As the report demonstrates, OpenTelemetry empowers developers to unlock the full potential of their Go applications, ensuring they remain performant in even the most demanding environments. For Go developers looking to stay ahead in the world of observability, embracing OpenTelemetry is a step toward building more robust and efficient systems.
#OpenTelemetry#GoLang#Performance#Observability#Monitoring#Telemetry#GoDevelopment#SoftwarePerformance#Benchmarking#DistributedTracing#Metrics#Logs#Profiling#TechReport#DevOps#CloudNative#ApplicationPerformance#Optimization
0 notes
Text
Cassandra To Spanner Proxy Adaptor Eases Yahoo’s Migration

Yahoo’s migration process is made easier with a new Cassandra to Spanner adapter.
A popular key-value NoSQL database for applications like caching, session management, and real-time analytics that demand quick data retrieval and storage is Cassandra. High performance and ease of maintenance are ensured by its straightforward key-value pair structure, particularly for huge datasets.
- Advertisement -
However, this simplicity also has drawbacks, such as inadequate support for sophisticated queries, the possibility of data repetition, and challenges when it comes to modeling complicated relationships. In order to position itself for classic Cassandra workloads, Spanner, Google Cloud’s always-on, globally consistent, and nearly infinite-scale database, blends the scalability and availability of NoSQL with the strong consistency and relational nature of traditional databases. With the release of the Cassandra to Spanner Proxy Adapter, an open-source solution allowing plug-and-play migrations of Cassandra workloads to Spanner without requiring modifications to the application logic, switching from Cassandra to Spanner is now simpler than ever.
Spanner for NoSQL workloads
Strong consistency, high availability, nearly infinite scalability, and a well-known relational data model with support for SQL and ACID transactions for data integrity are all features that Spanner offers. Being a fully managed service, it facilitates operational simplification and frees up teams to concentrate on developing applications rather than managing databases. Additionally, by reducing database downtime, Spanner’s high availability even on a vast global scale supports business continuity.
Spanner is always changing to satisfy the demands of contemporary companies. Improved multi-model capabilities including graph, full-text, and vector searches, higher analytical query performance with Spanner Data Boost, and special enterprise features like geo-partitioning and dual-region settings are some of the most recent Spanner capabilities. These potent features, together with Spanner’s alluring price-performance, provide up a world of fascinating new opportunities for Cassandra users.
Yahoo has put the Cassandra to Spanner adapter to the test
“Spanner sounds like a leap forward from Cassandra,” in case you were wondering. How can I begin? The proxy adapter offers a plug-and-play method for sending Cassandra Query Language (CQL) traffic from your client apps to Spanner. The adapter works as the application’s Cassandra client behind the scenes, but it communicates with Spanner internally for all data manipulation operations. The Cassandra to Spanner proxy adapter simply works without requiring you to migrate your application code!
Yahoo benefited from increased performance, scalability, consistency, and operational efficiency after successfully migrating from Cassandra to Spanner. Additionally, the proxy adapter made the migration process simple.
Reltio is another Google Cloud client that has made the switch from Cassandra to Spanner. Reltio gained the advantages of a fully managed, globally distributed, and highly consistent database while minimizing downtime and service disruption through an easy migration process.
These success examples show that companies looking to upgrade their data architecture, uncover new capabilities, and spur creativity may find that switching from Cassandra to Spanner is a game-changer.
How is your migration made easier by the new proxy adapter? The following procedures are involved in a typical database migration:Image credit to Google Cloud
Some of these stages are more complicated than others, such as moving your application (step 4) and moving the data (step 6). Migrating a Cassandra-backed application to point to Spanner is made much easier by the proxy adaptor. A high-level summary of the procedures needed to use the new proxy adapter is provided here:
Assessment: After switching to Spanner, determine which of your Cassandra schema, data model, and query patterns may be made simpler.
Schema design: The documentation thoroughly discusses the similarities and differences between Spanner’s and Cassandra’s table declaration syntax and data types. For optimum efficiency, you can additionally utilize relational features and capabilities with Spanner, such as interleaved tables.
Data migration: To move your data, follow these steps:
Bulk load: Utilizing programs like the Spanner Dataflow connector or BigQuery reverse ETL, export data from Cassandra and import it into Spanner.
Replicate incoming information: Use Cassandra’s Change Data Capture (CDC) to instantly replicate incoming updates to Spanner from your Cassandra cluster.
Updating your application logic to execute dual-writes to Cassandra and Spanner is an additional option. If you want to make as few modifications to your application code as possible, google Cloud do not advise using this method.
Update your Cassandra setup and set up the proxy adapter: The Cassandra to Spanner Proxy Adapter operates as a sidecar next to your application; download and start it. The proxy adapter uses port 9042 by default. Remember to modify your application code to point to the proxy adapter if you choose to use a different port.
Testing: To make sure everything functions as planned, thoroughly test your migrated application and data in a non-production setting.
Cutover: Move your application traffic to Spanner as soon as you are comfortable with the migration. Keep a watchful eye out for any problems and adjust performance as necessary.
What does the new proxy adapter’s internal components look like?
The application sees the new proxy adaptor as a Cassandra client. The Cassandra endpoint’s IP address or hostname has changed to point to the proxy adapter, which is the only discernible change from the application’s point of view. This simplifies the Spanner migration without necessitating significant changes to the application code.Image credit to Google Cloud
To provide a one-to-one mapping between every Cassandra cluster and its matching Spanner database, Google builds the proxy adapter. A multi-listener architecture is used by the proxy instance, and each listener is connected to a different port. This makes it possible to handle several client connections at once, with each listener controlling a separate connection to the designated Spanner database.
The complexities of the Cassandra protocol are managed by the translation layer of the proxy. This layer handles buffers and caches, decodes and encodes messages, and most importantly parses incoming CQL queries and converts them into counterparts that are compatible with Spanner.
To gather and export traces to Cloud Trace, the proxy adapter supports OpenTelemetry.
Taking care of common issues and difficulties
Let’s talk about some issues you might be having with your migrations:
Cost: Take a look at Accenture’s benchmark result, which shows that Spanner guarantees cost effectiveness in addition to consistent latency and throughput. To help you utilize all of Spanner’s features, the company has also introduced a new tiered pricing structure called “Spanner editions,” which offers improved cost transparency and cost-saving options.
Latency increases: When executing the proxy adapter in a Docker container, Google advises running it on the same host as the client application (as a side-car proxy) or on the same Docker network to reduce an increase in query latencies. Additionally, Google advised limiting the proxy adapter host’s CPU usage to less than 80%.
Design flexibility: Spanner’s more rigid relational design gives benefits in terms of data integrity, query capability, and consistency, but Cassandra offers more flexibility.
Learning curve: There are some distinctions between Cassandra’s and Spanner’s data types. Examine this thorough material to help with the transition.
Start now
For companies wishing to take advantage of the cloud’s full potential for NoSQL workloads, Spanner is an appealing choice due to its robust consistency, streamlined operations, improved data integrity, and worldwide scalability. Google Cloud is making it simpler to plan and implement your migration strategy with the new Cassandra to Spanner proxy adapter, allowing your company to enter a new era of data-driven innovation.
Read more on govindhtech.com
#Cassandra#SpannerProxyAdaptor#NoSQLdatabase#EasesYahooMigration#Spanner#OpenTelemetry#newproxyadapter#internalcomponents#news#NoSQLworkloads#technology#technews#govindhtech
0 notes
Text
0 notes
Text
Checking your OpenTelemetry pipeline with Telemetrygen
Testing OpenTelemetry configuration pipelines without resorting to instrumented applications, particularly for traces, can be a bit of a pain. Typically, you just want to validate you can get an exported/generated signal through your pipeline, which may not be the OpenTelemetry Collector (e.g., FluentBit or commercial solutions such as DataDog). This led to the creation of Tracegen, and then the…
View On WordPress
0 notes
Text
How to Test Service APIs
When you're developing applications, especially when doing so with microservices architecture, API testing is paramount. APIs are an integral part of modern software applications. They provide incredible value, making devices "smart" and ensuring connectivity.
No matter the purpose of an app, it needs reliable APIs to function properly. Service API testing is a process that analyzes multiple endpoints to identify bugs or inconsistencies in the expected behavior. Whether the API connects to databases or web services, issues can render your entire app useless.
Testing is integral to the development process, ensuring all data access goes smoothly. But how do you test service APIs?
Taking Advantage of Kubernetes Local Development
One of the best ways to test service APIs is to use a staging Kubernetes cluster. Local development allows teams to work in isolation in special lightweight environments. These environments mimic real-world operating conditions. However, they're separate from the live application.
Using local testing environments is beneficial for many reasons. One of the biggest is that you can perform all the testing you need before merging, ensuring that your application can continue running smoothly for users. Adding new features and joining code is always a daunting process because there's the risk that issues with the code you add could bring a live application to a screeching halt.
Errors and bugs can have a rippling effect, creating service disruptions that negatively impact the app's performance and the brand's overall reputation.
With Kubernetes local development, your team can work on new features and code changes without affecting what's already available to users. You can create a brand-new testing environment, making it easy to highlight issues that need addressing before the merge. The result is more confident updates and fewer application-crashing problems.
This approach is perfect for testing service APIs. In those lightweight simulated environments, you can perform functionality testing to ensure that the API does what it should, reliability testing to see if it can perform consistently, load testing to check that it can handle a substantial number of calls, security testing to define requirements and more.
Read a similar article about Kubernetes API testing here at this page.
#kubernetes local development#opentelemetry and kubernetes#service mesh and kubernetes#what are dora metrics
0 notes
Text
SigNoz: Free and Open Source Syslog server with OpenTelemetry
SigNoz: Free and Open Source Syslog server with OpenTelemetry @signozhq #homelab #SigNozOpenSourceAlternative #DatadogVsSigNoz #MonitorApplicationsWithSigNoz #ApplicationPerformanceManagementTools #DistributedTracingWithSigNoz #MetricsAndDashboards
I am always on the lookout for new free and open-source tools in the home lab and production environments. One really excellent tool discovered recently is a tool called SigNoz. SigNoz is a free and open-source syslog server and observability program that provides an open-source alternative to Datadog, Relic, and others. Let’s look at SigNoz and see some of the features it offers. We will also…

View On WordPress
#alert systems in observability#application performance management tools#Datadog vs. SigNoz#distributed tracing with SigNoz#exceptions monitoring best practices#log management solutions#metrics and dashboards guide#monitor applications with SigNoz#SigNoz and OpenTelemetry integration#SigNoz open-source alternative
1 note
·
View note
Text
OpenTelemetry Tracing in < 200 lines of code
https://jeremymorrell.dev/blog/minimal-js-tracing/
2 notes
·
View notes
Text
Telemetry Pipelines Workshop: Integrating Fluent Bit With OpenTelemetry, Part 1
http://securitytc.com/TCRLwP
2 notes
·
View notes
Text
Observability vs. Monitoring: Implementing Distributed Tracing with Open Telemetry in Bangalore
Introduction: Why Observability is Bangalore’s New Tech Superpower Did you know that 60% of IT outages in distributed systems occur due to undetected latency between services (Gartner 2023)? For a tech hub like Bangalore—where companies deploy hundreds of microservices—traditional monitoring is like checking a car’s speedometer while ignoring its engine diagnostics.
Take the case of a Bangalore e-commerce giant that reduced checkout delays by 40% after implementing OpenTelemetry for distributed tracing. Suddenly, they could see the entire customer journey—from cart additions to payment processing—as a single, traceable flow.
For DevOps professionals in DevOps coaching in Bangalore, mastering observability tools like OpenTelemetry isn’t just about fixing bugs faster—it’s about preventing them altogether. This guide breaks down: ✔ Observability vs monitoring: Key differences ✔ How OpenTelemetry transforms troubleshooting ✔ Bangalore-specific implementation strategies
Monitoring vs. Observability: What Bangalore’s Tech Teams Need to Know
Monitoring: The Rearview Mirror What it does: Alerts you when known metrics (CPU, memory) breach thresholds Limitation: Can’t explain why a payment gateway times out
Observability: The X-Ray Vision What it provides: Distributed traces (Full request journeys) Context-rich logs Multi-dimensional metrics Bangalore Example:
OpenTelemetry trace of an e-commerce order
Browse (150ms) → AddToCart (200ms) → PaymentGateway (2000ms) → Confirm (150ms)
This trace exposed a slow third-party payment API—solved by switching providers.
The Tool Stack Revolution Purpose Monitoring Tools Observability Tools Metrics Nagios, Zabbix Prometheus, OpenTelemetry Tracing N/A Jaeger, OpenTelemetry Logs ELK Stack Loki, OpenTelemetry
This stack is now taught in advanced DevOps coaching in Bangalore programs.
Why OpenTelemetry? The Bangalore Advantage
Unified Data Collection Single SDK for traces, metrics, logs Vendor-agnostic: Works with AWS, GCP, Azure
Auto-Instrumentation Magic Zero-code changes for Java/Python apps Example: A Koramangala startup traced Django API latencies in 2 hours
Cost-Efficient Scaling Sampling controls: Keep only 10% of traces but 100% of errors
Bangalore Case Study: From 4-Hour Outages to 4-Minute Fixes Problem: A food-delivery app’s orders failed randomly during peak hours.
OpenTelemetry Implementation: Instrumented all microservices (Python + Go)
Discovered: Restaurant API cached menu data incorrectly Delivery service leaked database connections
Fixed: Added Redis caching Implemented connection pooling
Results: ✅ MTTR reduced from 4 hours → 4 minutes ✅ Peak throughput increased by 35% This troubleshooting prowess is why DevOps coaching in Bangalore prioritizes observability labs.
Overcoming Observability Challenges ❌ “Too Much Data!” Solution: Focus on SLOs (e.g., “Checkout < 2s”) Use flame graphs to spot latency hotspots ❌ “Complex Setup” Fix: Start with auto-instrumentation → expand gradually ❌ “Team Resistance” Strategy: Show cost savings—every 1% uptime improvement = $250K+ saved (Forrester)
Bangalore’s Observability Adoption Roadmap Start Small Instrument one critical service (e.g., payments) Build Context Add business attributes to traces: span.setAttribute("user.tier", "premium"); Correlate Everything Link traces to logs/metrics via TraceID Automate Alerts Trigger Slack alerts when: Error rate > 1% P99 latency > 500ms Upskill Continuously Advanced techniques are covered in DevOps coaching in Bangalore
Why Bangalore’s Tech Ecosystem Needs Observability 🔹 Microservices Boom: 70% of Bangalore tech firms use containers 🔹 Competitive Edge: Observability engineers earn 40% more 🔹 Industry-Aligned Training: DevOps coaching in Bangalore now includes: OpenTelemetry certification prep Distributed tracing labs Incident simulation drills

Conclusion: Observability—Your Microservices Crystal Ball In Bangalore’s high-stakes tech landscape: ✔ Monitoring tells you when something breaks ✔ Observability shows why—before users notice For DevOps professionals, DevOps coaching in Bangalore provides the hands-on Open Telemetry experience needed to future-proof careers.
Ready to see through your systems like never before? Enroll today and master observability’s superpowers!
What’s your biggest visibility challenge—sporadic latency or alert fatigue? Share your war stories below!
0 notes
Text
#ばばさん通信ダイジェスト : Database observability: How OpenTelemetry semantic conventions improve consistency across signals
賛否関わらず話題になった/なりそうなものを共有しています。
Database observability: How OpenTelemetry semantic conventions improve consistency across signals
https://grafana.com/blog/2025/06/06/database-observability-how-opentelemetry-semantic-conventions-improve-consistency-across-signals/
0 notes
Text
Opentelemetry vs Prometheus: Opentelemetry Overview

Opentelemetry vs Prometheus
Prometheus monitors, stores, and visualises metrics but does not keep logs or support traces for root cause analysis. The application cases of Prometheus are more limited than OpenTelemetry.
Programming language-agnostic integrations allow OpenTelemetry to track more complicated metrics than Prometheus. Automated instrumentation models make OTel more scalable and extensible than the Prometheus. OpenTelemetry requires a back-end infrastructure and no storage solution, unlike Prometheus.
Quick summary Prometheus calculates cumulative measurements as a total, whereas OpenTelemetry uses deltas. Prometheus stores short-term data and metrics, whereas OTel may be used with a storage solution. OpenTelemetry uses a consolidated API to send or pull metrics, logs, and traces and transform them into a single language, unlike Prometheus. Prometheus pulls data from hosts to collect and store time-series metrics. OTel can translate measurements and is language agonistic, providing developers additional options. Data and metrics are aggregated by Prometheus using PromQL. Web-visualized metrics and customisable alarms are provided by Prometheus. Integration with visualisation tools is required for OpenTelemetry. OTel represents metric values as integers instead of floating-point numbers, which are more precise and understandable. Prometheus cannot use integer metrics. Your organization’s demands will determine which option is best. OpenTelemetry may be better for complex contexts with dispersed systems, data holistic comprehension, and flexibility. This also applies to log and trace monitoring.
Prometheus may be suited for monitoring specific systems or processes using alerting, storage, and visualisation models.
Prometheus and OpenTelemetry Application performance monitoring and optimisation are crucial for software developers and companies. Enterprises have more data to collect and analyse as they deploy more applications. Without the correct tools for monitoring, optimising, storing, and contextualising data, it’s useless.
Monitoring and observability solutions can improve application health by discovering issues before they happen, highlighting bottlenecks, dispersing network traffic, and more. These capabilities reduce application downtime, improve performance, and enhance user experience.
App monitoring tools OpenTelemetry and the Prometheus are open-source Cloud Native Computing Foundation (CNCF) initiatives. An organization’s goals and application specifications determine which data and functions need which solutions. Before using OpenTelemetry or Prometheus, you should know their main distinctions and what they offer.
Java Opentelemetry OTel exports these three forms of telemetry data to Prometheus and other back ends. This lets developers chose their analysis tools and avoids vendor or back-end lock-in. OpenTelemetry integrates with many platforms, including Prometheus, to increase observability. Its flexibility increases because OTel supports Java, Python, JavaScript, and Go. Developers and IT staff may monitor performance from any browser or location.
Its ability to gather and export data across multiple applications and standardise the collecting procedure make OpenTelemetry strong. OTel enhances distributed system and the microservice observability.
For application monitoring, OpenTelemetry and Prometheus integrate and operate well together. The DevOps and IT teams can use OpenTelemetry and Prometheus to collect and transform information for performance insights.
Opentelemetry-demo OpenTelemetry (OTel) helps generate, collect, export, and manage telemetry data including logs, metrics, and traces in one place. OTel was founded by OpenCensus and OpenTracing to standardise data gathering through APIs, SDKs, frameworks, and integrations. OTel lets you build monitoring outputs into your code to ease data processing and export data to the right back end.
Telemetry data helps determine system health and performance. Optimised observability speeds up troubleshooting, improves system reliability, reduces latency, and reduces application downtime.
Opentelemetry architecture APIs OpenTelemetry APIs uniformly translate programming languages. This lets APIs capture telemetry data. These APIs help standardise OpenTelemetry measurements.
SDKs Software development tools. Frameworks, code libraries, and debuggers are software development building elements. OTel SDKs implement OpenTelemetry APIs and provide telemetry data generation and collection tools.
OpenTelemetry collector The OpenTelemetry collector accepts, processes, and exports telemetry data. Set OTel collectors to filter specified data types to the back end.
Instrumentation library OTel offers cross-platform instrumentation. The instrumentation libraries let OTel integrate with any programming language.
Opentelemetry collector contrib Telemetry data including metrics, logs, and traces can be collected without modifying code or metadata using the OpenTelemetry protocol (OTLP).
Metrics A high-level overview of system performance and health is provided via metrics. Developers, IT, and business management teams decide what metrics to track to fulfil business goals for application performance. A team may measure network traffic, latency, and CPU storage. You may also track application performance trends with metrics.
Logs Logs record programme or application events. DevOps teams can monitor component properties with logs. Historical data might demonstrate performance, thresholds exceeded, and errors. Logs track application ecosystem health.
Traces Traces provide a broader picture of application performance than logs and aid optimisation. They track a request through the application stack and are more focused than logs. Traces let developers pinpoint when mistakes or bottlenecks occur, how long they remain, and how they effect the user journey. This data improves microservice management and application performance.
What’s Prometheus? Application metrics are collected and organised using Prometheus, a monitoring and alerting toolkit. SoundCloud created the Prometheus server before making it open-source.
End-to-end time-series data monitoring is possible using Prometheus. Time-series metrics capture regular data, such as monthly sales or daily application traffic. Visibility into this data reveals patterns, trends, and business planning projections. Prometheus collects application metrics for dedicated functions that DevOps teams want to monitor after integration with a host.
Using PromQL, Prometheus metrics offer data points with the metric name, label, timestamp, and value. For better visualisation, PromQL lets developers and IT departments aggregate data metrics into histograms, graphs, and dashboards. Enterprise databases and exporters are accessible to Prometheus. Application exporters pull metrics from apps and endpoints.
Prometheus tracks four metrics Counters Counters measure increasing numerical values. Counters count completed tasks, faults, and processes or microservices.
Gauges Gauges measure numerical data that fluctuate due to external variables. They can monitor CPU, memory, temperature, and queue size.
Histograms Events like request duration and answer size are measured via histograms. They split the range of these measurements into buckets and count how many fall into each bucket.
Summaries Summaries assess request durations and response size like histograms, but they also count and total all observed values.
Prometheus’ data-driven dashboards and graphs are also useful.
Benefits of Prometheus Prometheus provides real-time application monitoring for accurate insights and fast troubleshooting. It also permits function-specific thresholds. When certain thresholds are hit or exceeded, warnings might speed up problem resolution. Prometheus stores and provides analytics teams with massive amounts of metrics data. It stores data for instant examination, not long-term storage. Prometheus typically stores data for two to fifteen days.
Prometheus works perfectly with Kubernetes, an open-source container orchestration technology for scheduling, managing, and scaling containerised workloads. Kubernetes lets companies create hybrid and multicloud systems with many services and microservices. These complicated systems gain full-stack observability and oversight with Prometheus and Kubernetes.
Grafana Opentelemetry Grafana, a powerful visualisation tool, works with Prometheus to create dashboards, charts, graphs, and alerts. Grafana can visualise metrics with Prometheus. The compatibility between these platforms makes complex data easier to share between teams.
Integration of OpenTelemetry with Prometheus No need to choose OpenTelemetry and Prometheus are compatible. Prometheus data models support OpenTelemetry metrics and OTel SDKs may gather them. Together, these systems provide the best of both worlds and enhanced monitoring. As an example:
When combined, OTel and Prometheus monitor complex systems and deliver real-time application insights. OTel’s tracing and monitoring technologies work with Prometheus’ alerting. Prometheus handles big data. This capability and OTel’s ability to combine metrics, traces, and logs into one interface improve system and application scalability. PromQL can generate visualisation models using OpenTelemetry data. To provide additional monitoring tools, OpenTelemetry and Prometheus interface with IBM Instana and Turbonomic. Instana’s connection map, upstream/downstream service connection, and full-stack visibility let OTel monitor all services. They give the same wonderful experience with OTel data as with all other data sources, providing you the context you need to swiftly detect and address application problems. Turbonomic automates real-time data-driven resourcing choices using Prometheus’ data monitoring capabilities. These optimised integrations boost application ecosystem health and performance.
Read more on Govindhtech.com
#Programming#OpenTelemetry#ibm#kubernets#devops#multicloud#apis#microservices#technology#technews#govindhtech
0 notes
Text
Observability in Action - Book Review
With the Christmas holidays happening, things slowed down enough to sit and catch up on some reading – which included reading Cloud Observability in Action by Michael Hausenblas from Manning. You could ask – why would I read a book about a domain you’ve written about (Logging In Action with Fluentd) and have an active book in development (Fluent Bit with Kubernetes)? The truth is, it’s good to…

View On WordPress
0 notes
Text
Kubernetes Cluster Management at Scale: Challenges and Solutions
As Kubernetes has become the cornerstone of modern cloud-native infrastructure, managing it at scale is a growing challenge for enterprises. While Kubernetes excels in orchestrating containers efficiently, managing multiple clusters across teams, environments, and regions presents a new level of operational complexity.
In this blog, we’ll explore the key challenges of Kubernetes cluster management at scale and offer actionable solutions, tools, and best practices to help engineering teams build scalable, secure, and maintainable Kubernetes environments.
Why Scaling Kubernetes Is Challenging
Kubernetes is designed for scalability—but only when implemented with foresight. As organizations expand from a single cluster to dozens or even hundreds, they encounter several operational hurdles.
Key Challenges:
1. Operational Overhead
Maintaining multiple clusters means managing upgrades, backups, security patches, and resource optimization—multiplied by every environment (dev, staging, prod). Without centralized tooling, this overhead can spiral quickly.
2. Configuration Drift
Cluster configurations often diverge over time, causing inconsistent behavior, deployment errors, or compliance risks. Manual updates make it difficult to maintain consistency.
3. Observability and Monitoring
Standard logging and monitoring solutions often fail to scale with the ephemeral and dynamic nature of containers. Observability becomes noisy and fragmented without standardization.
4. Resource Isolation and Multi-Tenancy
Balancing shared infrastructure with security and performance for different teams or business units is tricky. Kubernetes namespaces alone may not provide sufficient isolation.
5. Security and Policy Enforcement
Enforcing consistent RBAC policies, network segmentation, and compliance rules across multiple clusters can lead to blind spots and misconfigurations.
Best Practices and Scalable Solutions
To manage Kubernetes at scale effectively, enterprises need a layered, automation-driven strategy. Here are the key components:
1. GitOps for Declarative Infrastructure Management
GitOps leverages Git as the source of truth for infrastructure and application deployment. With tools like ArgoCD or Flux, you can:
Apply consistent configurations across clusters.
Automatically detect and rollback configuration drifts.
Audit all changes through Git commit history.
Benefits:
· Immutable infrastructure
· Easier rollbacks
· Team collaboration and visibility
2. Centralized Cluster Management Platforms
Use centralized control planes to manage the lifecycle of multiple clusters. Popular tools include:
Rancher – Simplified Kubernetes management with RBAC and policy controls.
Red Hat OpenShift – Enterprise-grade PaaS built on Kubernetes.
VMware Tanzu Mission Control – Unified policy and lifecycle management.
Google Anthos / Azure Arc / Amazon EKS Anywhere – Cloud-native solutions with hybrid/multi-cloud support.
Benefits:
· Unified view of all clusters
· Role-based access control (RBAC)
· Policy enforcement at scale
3. Standardization with Helm, Kustomize, and CRDs
Avoid bespoke configurations per cluster. Use templating and overlays:
Helm: Define and deploy repeatable Kubernetes manifests.
Kustomize: Customize raw YAMLs without forking.
Custom Resource Definitions (CRDs): Extend Kubernetes API to include enterprise-specific configurations.
Pro Tip: Store and manage these configurations in Git repositories following GitOps practices.
4. Scalable Observability Stack
Deploy a centralized observability solution to maintain visibility across environments.
Prometheus + Thanos: For multi-cluster metrics aggregation.
Grafana: For dashboards and alerting.
Loki or ELK Stack: For log aggregation.
Jaeger or OpenTelemetry: For tracing and performance monitoring.
Benefits:
· Cluster health transparency
· Proactive issue detection
· Developer fliendly insights
5. Policy-as-Code and Security Automation
Enforce security and compliance policies consistently:
OPA + Gatekeeper: Define and enforce security policies (e.g., restrict container images, enforce labels).
Kyverno: Kubernetes-native policy engine for validation and mutation.
Falco: Real-time runtime security monitoring.
Kube-bench: Run CIS Kubernetes benchmark checks automatically.
Security Tip: Regularly scan cluster and workloads using tools like Trivy, Kube-hunter, or Aqua Security.
6. Autoscaling and Cost Optimization
To avoid resource wastage or service degradation:
Horizontal Pod Autoscaler (HPA) – Auto-scales pods based on metrics.
Vertical Pod Autoscaler (VPA) – Adjusts container resources.
Cluster Autoscaler – Scales nodes up/down based on workload.
Karpenter (AWS) – Next-gen open-source autoscaler with rapid provisioning.
Conclusion
As Kubernetes adoption matures, organizations must rethink their management strategy to accommodate growth, reliability, and governance. The transition from a handful of clusters to enterprise-wide Kubernetes infrastructure requires automation, observability, and strong policy enforcement.
By adopting GitOps, centralized control planes, standardized templates, and automated policy tools, enterprises can achieve Kubernetes cluster management at scale—without compromising on security, reliability, or developer velocity.
0 notes
Text
Why Splunk Is the Go-To Platform for Enterprise Security and Observability
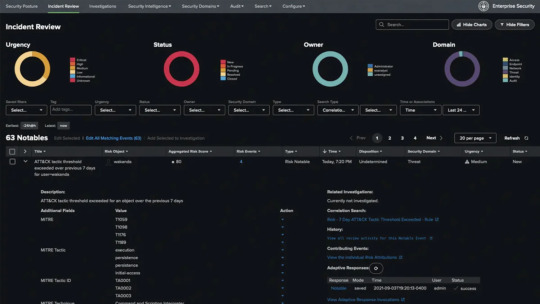
In today’s digital-first world, organizations generate and rely on vast volumes of machine data to run their operations, serve customers, and protect digital assets. As cyber threats grow in complexity and IT environments become more fragmented with cloud, hybrid, and multi-cloud setups, enterprises are under pressure to maintain visibility, ensure compliance, and respond to incidents in real time. Enter Splunk: the platform leading enterprises trust for security, observability, and data-driven decision-making.
Splunk has become synonymous with real-time analytics and intelligent monitoring. Its ability to ingest, index, and correlate data from virtually any source makes it indispensable for enterprises seeking to gain end-to-end visibility across their digital infrastructure. But what exactly makes Splunk service the go-to platform for enterprise security and observability? Let’s break it down.
1. Unified Data Platform for Security and IT Operations
Splunk provides a unified platform that bridges the gap between IT security, and business operations. Unlike siloed tools that provide fragmented views, Splunk consolidates data from across your network, applications, endpoints, and cloud services to deliver a single source of truth.
Whether you’re monitoring for performance issues, detecting security breaches, or ensuring compliance, Splunk enables stakeholders to work from a common, real-time data set. This holistic approach empowers faster, more accurate decisions and fosters collaboration across departments.
2. Powerful Security Information and Event Management (SIEM) Capabilities
One of the strongest use cases for Splunk is in enterprise security. Splunk Enterprise Security (ES) acts as a powerful SIEM platform, enabling security teams to detect, investigate, and respond to threats efficiently. It offers advanced analytics, prebuilt dashboards, threat intelligence integration, and real-time alerting.
With features like risk-based alerting, behavioral analytics, and threat detection rules, Splunk helps security teams cut through the noise and focus on high-priority incidents. It empowers analysts to conduct rapid incident response and forensic investigations using historical data.
3. Unmatched Observability Tools for Modern Applications
Observability is more than just monitoring—it’s about understanding system behavior across distributed environments. Splunk Observability Cloud offers a full-stack observability solution that includes infrastructure monitoring, application performance monitoring (APM), log analysis, and synthetic transaction testing.
By leveraging OpenTelemetry and AI-driven insights, Splunk provides real-time visibility into system health, user experiences, and performance bottlenecks. This enables DevOps and SRE teams to troubleshoot faster, optimize application performance, and deliver consistent uptime.
4. Scalability for Enterprise Workloads
Enterprise environments are complex, and the volume of machine data they produce can be staggering. Splunk is designed to scale with your business, whether you're analyzing gigabytes or petabytes of data daily. Its distributed architecture supports horizontal scaling and high availability, ensuring consistent performance even under heavy loads.
This scalability is critical for large enterprises that require long-term retention, high-speed analytics, and support for thousands of users accessing data concurrently.
5. Advanced Analytics and Machine Learning
Splunk's analytics capabilities go beyond simple search and dashboards. With built-in machine learning (ML) and support for custom models, Splunk enables predictive analytics, anomaly detection, and behavior profiling. Security and IT teams can use ML to identify suspicious patterns, forecast system failures, or automate threat detection.
The Splunk Machine Learning Toolkit (MLTK) empowers users to apply, train, and tune models using their existing data—no data science degree is required. This intelligent layer of automation enhances situational awareness and drives proactive responses.
6. Robust Ecosystem and Integrations
Splunk integrates seamlessly with a wide range of tools, platforms, and services, including AWS, Microsoft Azure, Google Cloud, Kubernetes, ServiceNow, Palo Alto Networks, and more. These integrations extend Splunk’s capabilities and ensure it fits naturally into your existing technology stack.
The Splunkbase app marketplace features thousands of apps and add-ons for specialized data sources, dashboards, and utilities—making it easier for teams to customize the platform to suit their needs.
7. Enhanced Compliance and Audit Readiness
For industries like finance, healthcare, and government, regulatory compliance is a top priority. Splunk simplifies compliance management by offering prebuilt dashboards and reports aligned with standards like HIPAA, PCI DSS, GDPR, and ISO 27001.
Automated data collection, alerting, and audit trails make it easier to demonstrate compliance and pass audits with confidence. Splunk also provides role-based access controls and data masking to protect sensitive information.
8. Flexible Deployment Options: On-Prem, Cloud, or Hybrid
Not all enterprises are at the same stage of cloud adoption. Splunk’s flexible deployment options allow organizations to deploy the platform on-premises, in the cloud, or a hybrid environment.
Splunk Cloud Platform offers the same functionality as on-prem with the added benefits of scalability, automatic updates, and reduced infrastructure management. It’s ideal for businesses that want to accelerate time to value and reduce operational overhead.
9. Real-Time Dashboards and Visualizations
Splunk’s intuitive dashboards and data visualizations help users transform raw machine data into actionable insights. From real-time alerts on security threats to performance metrics for executive reports, Splunk offers customizable dashboards that can be tailored to user roles and use cases.
Interactive charts, graphs, and maps help bring data stories to life, making it easier for decision-makers to act on insights without technical barriers.
Final Thoughts: Why Splunk Stands Out
In a world where data is both a powerful asset and a potential liability, having the right tools to manage, secure, and understand your data is critical. Splunk delivers on all fronts—offering real-time analytics, enterprise-grade security, and unparalleled observability.
By unifying IT operations, DevOps, and security teams around a single data platform, Splunk breaks down silos, accelerates response times, and drives digital resilience. Its flexibility, intelligence, and scalability make it the ideal choice for enterprises navigating the complexities of modern IT environments.
If your organization is ready to move beyond reactive monitoring and embrace intelligent, proactive operations, Splunk is not just an option—it’s the answer.
#splunk services#microsoft azure sentinel#Splunk solutions#splunk enterprise#splunk security#Splunk consultant#microsoft sentinel#SIEM solutions#Sentinel
0 notes
Text
OpenTelemetry Is Great, but Who the Hell Is Going to Pay for It?
https://www.adatosystems.com/2025/02/10/who-the-hell-is-going-to-pay-for-this/
0 notes