#crude oil price in commodity market
Explore tagged Tumblr posts
Visit Tumblr Blog
Explore Tumblr blogs with no restrictions, modern design and the best experience.
Last Seen Tumblr Blogs


Fun Fact
There are dozens of funny blogs to kill time on Tumblr.
Text
Oil Prices Inch Up Despite Mixed Signals

Oil prices edged slightly higher on Friday. Contracts for Brent crude oil expiring in August climbed 0.4%, reaching $86.73 per barrel. Similarly, West Texas Intermediate (WTI) crude futures, a key benchmark for North American oil, rose 0.4% to $82.09 per barrel.
This modest increase comes amidst conflicting forces in the oil market. While concerns about potential supply disruptions from the Middle East and ongoing geopolitical tensions provided some upward pressure, a strong U.S. dollar acted as a counterweight. A stronger dollar can make oil, priced in dollars, less attractive to buyers using other currencies.
The focus for investors has now shifted to upcoming U.S. inflation data, which could influence future decisions by the Federal Reserve on interest rates. Higher interest rates can strengthen the dollar and potentially dampen demand for oil.
#Oil prices#Brent crude oil#West Texas Intermediate (WTI)#Crude oil futures#Oil market trends#Middle East supply disruptions#Geopolitical tensions#U.S. dollar strength#Federal Reserve interest rates#U.S. inflation data#Oil demand#Energy market analysis#Global oil supply#Commodities trading#Economic indicators
0 notes
Text
Gas Station Stream of Consciousness Post
Gas Stations as Liminal Spaces

I've had quite a few hyperfixations in my day - ATMs, laundry detergents, credit cards - so my current one pertaining to gas stations is fitting considering my affinity for liminal spaces and the dedication of this blog to them. Liminal spaces are transitory in nature, hence their portrayal in online circles through photos of carpeted hallways, illuminated stairwells, dark roads, and backrooms, among other transitional points.

Gas stations are posted online as well; images of their fuel pumps or neon signage photographed through a rainy car window communicate their liminality and the universal experiences they provide to all of society. Perhaps they are the ultimate specimen of a liminal space. The machines they are created for, automobiles and tractor trailers alike, themselves are tools for motion, vestibules that enable travel and shipment across long distances at high speeds. Cars and roads are liminal spaces, albeit in different formats, and gas stations serve as their lighthouses. Vehicles at filling stations, therefore, are in a sense liminal spaces within liminal spaces within liminal spaces.
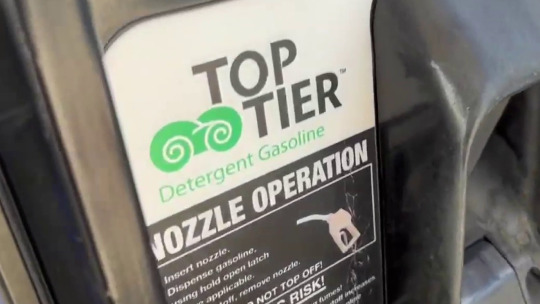
The uniqueness of a gas station as a liminal space, however, is its intersection with the economics and aesthetics of capitalism. Gasoline (and diesel fuel) is a commodity, downstream from crude oil, merely differentiated by octane ratings. Some argue that minute distinctions between agents, detergents, and additives make some brands better than others. Indeed, fuels that are approved by the Top Tier program, sponsored by automakers, have been shown to improve engine cleanliness and performance, but this classification does not prefer specific refiners over others; it is simply a standard. To a consumer, Top Tier fuels are themselves still interchangeable commodities within the wider gasoline commodity market.
The Economics of Gas Stations

The market that gas stations serve is characterized by inelastic demand, with customers who reckon with prices that fluctuate day in and day out. This is not to say that consumer behavior does not change with fuel prices. It has been observed that as prices rise, consumers are more eager to find the cheapest gas, but when prices fall, drivers are less selective with where they pump and are just happy to fill up at a lower price than last week. In response, gas stations lower their prices at a slower rate than when increasing prices, allowing for higher profit margins when wholesale prices fall. This has been dubbed the "rockets and feathers" phenomenon.

When portrayed as liminal spaces, gas stations are most often depicted at night, places of solitude where one may also enter the adjacent convenience store and encounter a fellow individual who isn't asleep, the modern day lightkeeper. The mart that resides at the backcourt of a gas station is known to sell goods at higher prices than a supermarket, simultaneously taking advantage of a captive customer, convenient location, and making up for the inefficiencies of a smaller operation. It may come as no surprise, then, that gas stations barely make any money from fuel sales and earn their bulk through C-store sales. This is a gripe I have with our economic system. Business is gamified, and in many cases the trade of certain goods and services, called loss leaders, is not an independent operation and is subsidized by the success of another division of a business, a strategy inherently more feasible for larger companies that have greater scale to execute it.

Nevertheless, most gas station owners, whether they have just one or hundreds of sites, find this method fruitful. Even though most gas stations in the US sell one of a handful of national brands, they operate on a branded reseller, or dealer, model, with oil companies themselves generally not taking part in the operations of stations that sell their fuels. The giants do still often have the most leverage and margin in the business, with the ability to set the wholesale price for the distributor, which sells at a markup to the station owner, which in turn will normally make the least profit in the chain when selling to the end customer at the pump. This kind of horizontal integration that involves many parties lacks the synergies and efficiencies of vertical integration that are so applauded by capitalists, but ends up being the most profitable for firms like ExxonMobil, who only extract and refine oil, and on the other end of the chain merely license their recognizable brands to the resellers through purchasing agreements. Furthermore, in recent years, independent dealers have sold their businesses to larger branded resellers, in many cases the ones from whom they had been buying their fuel.
A Word on ExxonMobil's Branding Potential

The largest publicly traded oil company in the world is Exxon Mobil Corporation. It is a direct descendent of the Rockefeller monopoly, Standard Oil, which was broken up in 1911 into 34 companies, the largest of which was Jersey Standard, which became Exxon in 1973. This title was generated by a computer as the most appealing replacement name to be used nationwide to unify the Humble, Enco, and Esso brands, decades before AI was spoken of. The latter brand is still used outside of the United States for marketing, arising from the phonetic pronunciation of the initials of Standard Oil. In 1999, Exxon and Mobil merged, and the combined company to this day markets under separate brands. Exxon is more narrowly used, to brand fuel in the United States, while Mobil has remained a motor oil and industrial lubricant brand, as well as a fuel brand in multiple countries.

Mobil originated in 1866 as the Vacuum Oil Company, which first used the current brand name for Mobiloil, and later Mobilgas and Mobilubricant products, with the prefix simply short for "automobile". Over time, Mobil became the corporation's primary identity, with its official name change to Mobil Oil Corporation taking place in 1966. Its updated wordmark with a signature red O was designed by the agency Chermayeff & Geismar, and the company's image for service stations was conceived by architect Eliot Noyes. New gas stations featured distinctive circular canopies over the pumps, and the company's recognizable pegasus logo was prominently on display for motorists.

I take issue with the deyassification of the brand's image over time. As costs were cut and uniformity took over, rectangular canopies were constructed in place of the special ones designed by Noyes that resembled large mushrooms. The pegasus remained a prominent brand icon, but the Mobil wordmark took precedence, which I personally believe to be an error in judgement. This disregard for the pegasus paved the way for its complete erasure in 2016 with the introduction of ExxonMobil's "Synergy" brand for its fuel. The mythical creature is now much smaller and appears only at the top right corner of pumps at Mobil gas stations, if at all.

Even into the 90s and the 21st century the Pegasus had its place in Mobil's marketing. In 1997, the company introduced its Speedpass keytag, which was revolutionary for its time and used RFID technology, akin to mobile payments today, to allow drivers to get gas without entering the store or swiping a card. When a Speedpass would be successfully processed, the pegasus on the gas pump would light up red.

When Exxon and Mobil merged in 1999, the former adopted the payment method too, with Exxon's less iconic tiger in place of the pegasus.

The program was discontinued in 2019 in favor of ExxonMobil's app, which is more secure since it processes payments through the internet rather than at the pump.

What Shell has done with its brand identity is what Mobil should've done for itself. The European company's logo was designed in 1969 by Raymond Loewy, and is a worth contender for the "And Yet a Trace of the True Self Exists in the False Self" meme. In recent years, Shell went all in on its graphic, while Mobil's pegasus flew away. I choose to believe that the company chose to rebrand its stations in order to prevent the malfunction in the above image from happening.

ExxonMobil should have also discontinued the use of the less storied Exxon brand altogether, and simplifying its consumer-facing identity to just the global Mobil mark. Whatever, neither of the names are actual words. As a bonus, here is a Google map I put together of all 62 gas stations in Springfield, MA. This is my idea of fun. Thanks for reading to the end!
#exxonmobil#exxon#mobil#gas station#gas stations#liminal space#liminal spaces#liminal#liminalcore#liminal aesthetic#justice for pegasus#shell#corporations#capitalism#branding#marketing#standard oil#economics#gas#gasoline#fuel#oil companies
108 notes
·
View notes
Video
youtube
EURUSD 83 Consecutive Successes!
Title: "PrimeXAlgo NVDA: 31 Consecutive Winning Trades!
🔥 | AI Trading Signals for Stock Markets"
Description: 🚀 Breaking News: PrimeXAlgo OIL Achieves 27 Consecutive Trading Successes!
Revolutionizing Oil Trading with Advanced AI Technology:
✅ 27 Consecutive Successful Trades
✅ Real-Time Live Chart Analysis
✅ No Repainting Signals
✅ AI-Powered Decision Making
🔍 Unique Features:
Analysis of 2,500+ Market Indicators
Cross-Market Compatibility (Oil, Gold, Bitcoin, Nasdaq)
Real-Time Signal Generation
100% Legal & Ethical Trading Technology
Works in All Time Zones
Advanced AI Implementation
💹 Markets Coverage:
Oil Trading
Commodities
Cryptocurrency
Forex
Stocks
Indices
🌐 Join Our Trading Community: Website: https://primexalgo.com Telegram: https://t.me/primexalgo Discord: https://discord.com/channels/1288670367401119888/1288670564126294078 Instagram: https://instagram.com/primexalgo X/Twitter: https://x.com/PrimeXAlgo Facebook: https://www.facebook.com/profile.php?id=61566510386136
⏰ Video Timeline: 0:00 - Introduction 1:30 - Oil Trading Success Story 3:00 - Technology Overview 4:30 - Live Trading Demo 6:00 - Implementation Guide 8:00 - Results & Testimonials
Start maximizing your oil trading potential with PrimeXAlgo today!
#OilTrading #AITrading #TradingSignals #CommodityTrading #PrimeXAlgo #FinancialMarkets #TradingSuccess #OilMarket #AITechnology #TradingStrategy #Investment #Finance #Trading
Tags: primexalgo oil, oil trading signals, ai trading oil, commodity trading, trading algorithm, oil market analysis, oil trading strategy, automated trading, oil price prediction, trading indicators, real-time trading, technical analysis, oil market signals, crude oil trading, energy trading, market analysis, trading technology, ai trading system, oil futures, market prediction.
2 notes
·
View notes
Text


“American crude-oil production rose 1.5% in August to hit a record 13.4 million barrels a day, as the top producing states of Texas and New Mexico saw output hit fresh record highs of 5.82 million and 2.09 million, respectively.“
Oversupply Could Mute Effects of Wider Middle-East Conflict on Oil Prices
https://www.worldbank.org/en/news/press-release/2024/10/29/commodity-markets-outlook-october-2024-press-release @WorldBank #oott #opec #chemical #investor #ennovance
#shalegas #pennsylvania #climate #esg #cleantech
#investor#privateequity#ennovance#shale oil#shalegas#oilprices#opec#crude oil#chemicals#investors#debt#equity
2 notes
·
View notes
Text
Different Financial Instruments
Different Financial Instruments in India The financial market in India provides a wide variety of products to suit different risk tolerances and investment requirements. Making wise investing selections requires having a thorough understanding of these instruments. Here, we examine a few of the most important financial products that are offered in India.
Stocks Ownership in a corporation is represented by stocks, or equity. Purchasing shares of a firm permits you to participate in its development and earnings as an owner. On stock markets such as the National Stock Exchange (NSE) and the Bombay Stock Exchange (BSE), stocks are exchanged. Although they have a large amount of market risk, they provide huge profits. Prior to making an investment in stocks, investors should perform extensive research.
Bonds Bonds are fixed-income securities that governments, businesses, and local governments issue to raise money. At maturity, they repay the principle amount together with monthly interest payments. Although they sometimes yield less returns than stocks, bonds are seen to be safer. For conservative investors seeking consistent income, they are perfect.
Mutual Funds Mutual funds invest in a diverse portfolio of stocks, bonds, and other assets by pooling the money of several individuals. Professional fund managers oversee them. By providing diversity, mutual funds help individual investors take on less risk. They are available in several varieties, including debt, equity, and hybrid funds, to accommodate varying risk tolerances and investment objectives.
Fixed Deposits (FDs) Fixed deposits are one of the most popular investment options in India. They offer a fixed interest rate for a specified tenure, providing assured returns. FDs are considered very safe, especially when deposited in reputable banks. They are suitable for risk-averse investors seeking guaranteed returns.
Derivatives Financial contracts known as derivatives derive their value from underlying assets such as stocks, bonds, or indexes. Derivatives that are frequently used are swaps, options, and futures. They are employed in price movement speculation and risk hedging. Since they can be complicated, derivatives are usually only advised for seasoned investors.
Instruments for Foreign Exchange Currency trading is a part of foreign exchange instruments. Businesses and investors use them to speculate on currency changes or as a hedge against currency risk. Forex trading is extremely risky and necessitates a solid grasp of world economic issues.
Cash and Cash Equivalents These include instruments like treasury bills, commercial papers, and certificates of deposit. They are highly liquid and can be quickly converted into cash. Cash equivalents are low-risk investments, suitable for short-term needs or as a part of a diversified portfolio
Goods and Services Investing in commodities such as crude oil, silver, and gold is an additional choice. Direct commodity trading is also possible, as is commodity futures trading. They diversify an investment portfolio and act as a buffer against inflation. In summary The financial market in India provides a vast range of instruments to suit varying risk appetites and investment requirements. Investors have a wide range of alternatives, from secure and steady fixed deposits to high-risk, high-reward stocks. Making wise investing selections requires having a thorough understanding of these instruments, as well as the risks and rewards associated with each. There is a financial product in India to meet your demands, regardless of whether you are an aggressive investor wanting large profits or a conservative investor seeking safety.
2 notes
·
View notes
Text

First thing I will like y'all to take a look at before going through my blog is the company I work for👍
I know most of y'all must have heard or might not heard about Bluepeak-global company. So if you're seeing this, it's an opportunity for you to grab but we will never force you to join us but at least try to give at least a look and make your research before you judge 👨⚖️
Okay, Blue peak Global company is a big investment company based in US but they have branches across the globe 🌎. Bluepeak global is the investors Gateway to the World’s Markets. We’re the core in Natural Resources(Diamond, Gold,crude oil) Real Estate, Stocks,Etfs and Bonds,indices, commodities. Our transparent, low commissions and financing rates, support for best price, stock yield enhancement program which help minimize costs to maximize your returns.
About bluepeak global
bluepeak global is an investment company, whose team is working on making money from the volatility of cryptocurrencies and offer great returns to our clients.
No matter their income level, social class, or anything else, it is the fundamental responsibility of bluepeak global to provide everyone with acceptable housing that is affordable. Our daily efforts are focused on exceeding expectations by keeping our word, building up our land bank, growing our clientele, and providing premium services and reasonably priced home options. Our range of series are created on suitable lands using recurrent development methods. They provide excellent value and a well-known product since they are standardized in terms of design, layout, and specification. Making the unbelievable accessible is our aim.
Below is a link to Bluepeak-global website 👇
You might not trust me to teach you or tell you more about the company and that's why there's a company video there on our website which has every information you need and the company ONLINE SUPPORT are always online too to attend to your messages and guide you. Do take your time and do your findings too. It's a global company and have marketing agents everywhere too which am one of it representing from Colombia🇨🇴. But there's only one Bluepeak-global head office which is located at👇
108 woodland way Greenwood, south Carolina (SC) USA 🇺🇸
Oh the picture ☝ that's me back there on my glasses👓 in the picture of our last meeting at the office😹 Am the smallest 🤦🏻♂️
3 notes
·
View notes
Text
Vegetable Oil Industry in India
The vegetable oils industry in India is a significant sector that plays a crucial role in the country's economy and food supply. India is one of the largest consumers and importers of vegetable oils globally due to its large population and dietary preferences.
The vegetable oils industry in India involves the production, processing, and marketing of various types of edible oils derived from plants. Some of the commonly used vegetable oils in India include palm oil, soybean oil, sunflower oil, mustard oil, groundnut oil, cottonseed oil and coconut oil.
Here are some key aspects of the vegetable oils industry in India:
Production: India produces a certain amount of vegetable oils domestically, primarily from oilseeds such as soybeans, groundnuts, rapeseed/mustard, sunflower, and sesame. However, domestic production is insufficient to meet the country's growing demand, leading to a significant reliance on imports.
Imports: India is one of the largest importers of vegetable oils in the world. The country imports vegetable oils from various countries such as Indonesia, Malaysia, Argentina, Ukraine, and others. Palm oil constitutes a significant portion of the imports, followed by soybean oil and sunflower oil.
Consumption: Vegetable oils are a staple ingredient in Indian cuisine and are used extensively for cooking purposes. The growing population, changing dietary patterns, and increasing urbanization have contributed to the rising consumption of vegetable oils in the country.
Processing: Vegetable oils are extracted from oilseeds through mechanical or solvent extraction methods. The oilseeds are processed in oil mills or solvent extraction units to obtain crude oil, which undergoes refining processes to produce refined vegetable oils.
Government Policies: The Indian government has implemented various policies to support the vegetable oils industry, promote domestic production, and reduce import dependency. These policies include subsidies, minimum support prices for oilseeds, research and development initiatives, and trade regulations.
Health Considerations: In recent years, there has been an increasing focus on the health aspects of vegetable oils. Consumers are becoming more conscious of factors such as trans fats, saturated fats, and overall nutritional value. This has led to a growing demand for healthier vegetable oil options and increased awareness of oil labeling and quality standards.
It's important to note that the vegetable oils industry is subject to market fluctuations, global commodity prices, weather conditions, and government policies, which can impact production, prices, and trade dynamics. For the most up-to-date information and statistics on the vegetable oils industry in India, it is advisable to refer to industry reports, trade publications, and official government sources.
2 notes
·
View notes
Text
US Plans 200% Tariff on Russia Aluminum as Soon as This Week
The US is preparing to slap a 200% tariff on Russian-made aluminum as soon as this week to keep pressure on Moscow as the one-year anniversary of the invasion of Ukraine nears, according to people familiar with the situation.
President Joe Biden has yet to give the official go-ahead, and there have been concerns in the administration about collateral damage on US industries, including aerospace and automobiles, said the people, who asked not to be identified discussing internal deliberations.
The move, which has been contemplated for months, is also aimed at Russia, the world’s second-largest aluminum producer, because Moscow has been dumping supplies on the US market and harming American companies. The timing of the decision could slip past this week, one of the people said.
The White House National Security Council didn’t immediately respond to requests for comment.
The escalation of pressure on Moscow comes after Washington unleashed unprecedented levels of sanctions to punish and isolate President Vladimir Putin’s government, including freezing its central bank assets globally, targeting its banking, technology and defense sectors and sanctioning individuals linked to Putin.
The move against aluminum also continues efforts by the US and European Union to blunt Russia’s role as global commodities powerhouse. The EU has banned imports of Russian oil, gas and fuels in an attempt to cut its reliance on Moscow. The impact of that move, however, has been mitigated by a redrawing of the global oil trade map, with most crude supplies going now to China and India at lower prices.
There’s no indication so far that the EU is planning a similar move on Russian aluminum.
US Market
Russia, the world’s largest aluminum producer after China, has been a significant source of material for the US market. Most of it is value-added items, rather than in bulk product, with US buyers ranging from building and construction to automotive.
Such a steep tariff would effectively end US imports of the metal from Russia. While the country has traditionally accounted for 10% of total US aluminum imports, the amount has dropped to just more than 3%, according to US trade data.
The tariff option would be less severe than actions considered last year by the administration, including an outright ban or sanctions on Russia’s sole producer of the metal, United Co. Rusal International PJSC. Such a move risked wider market disruptions, by making Russian supplies essentially toxic for buyers globally.
Rusal shares in Moscow were trading down as much as 3% on Monday after the news. The company declined to comment.
As the White House has weighed action on Russian aluminum, buyers in the US had been discussing the potential of alternate supply in the event of a ban, tariff or sanction. Industry participants in recent months have also tried to game plan where Russian metal would go if it was suddenly blocked out of the US market, as well as Europe, with many speculating that it could be transshipped via China or other countries and reexported, obscuring its origins.
Industry Support
Aluminum prices dropped about 15% last year amid worries of a slowing global economy and the ongoing pandemic lockdowns in China, the world’s largest consumer.
Aluminum futures traded on the London Metal Exchange on Monday briefly erased gains and rose as much as 0.6% on news of the tariffs, before declining 1.7% to $2,526.50 a metric ton as of 3:25 p.m. London time.
The Aluminum Association, a trade group that represents the industry in the US, said in a statement Monday that “the aluminum industry stands in support of any and all efforts deemed necessary by the US government and its NATO allies” to address Russia’s invasion. “This is a global security and humanitarian disaster that goes far beyond the interests of any single industry.”
US imports of Russian aluminum had dropped to near zero in October as the administration weighed a ban, worrying domestic buyers who didn’t want to be stuck with the material. Imports rebounded to 11,600 tons in November before easing back to 9,700 tons in January.
3 notes
·
View notes
Text
Wall Street Rallies, Yields Weaken, USD Down
US stocks rallied on Wednesday, helped by falling treasury yields, as worries over trade tensions eased slightly and investors focused back on corporate earnings.

US30Roll H1
Treasury yields weakened as traders digested a big batch of US data. Ahead of Friday's key January non-farm payrolls data, the latest ADP report showed private payrolls increased by 183,000 during the first month of 2025, above forecasts of 148,000, while the December total was upwardly revised by 54,000 to 176,000.

Meanwhile, the December US trade deficit was larger than expected, with the actual trade balance deficit at $98.4 billion, a significant increase from the forecasted figure of $96.5 billion and well above the previous figure of $78.9 billion.
And the Institute of Supply Management’s non-manufacturing Purchasing Managers Index (PMI) report indicated a slower growth rate, coming in at 52.8, below the forecasted figure of 54.2.
On foreign exchanges, the US dollar retreated again, having been on the backfoot since the Trump administration did a deal with both Canada and Mexico to delay the introduction of their trade tariffs. The dollar Index was 0.3% lower, falling back from a three-week high seen at the start of the week.

DXY H1
At the stock market close in New York, the blue-chip Dow Jones Industrials Average was up 0.7% at 44,873, while the broader S&P 500 index added 0.4% at 6,061, and the tech-laden Nasdaq Composite rose 0.2% to 19,692.
A recovery by Nvidia helped tech issues bounce back, with the AI chip giant gaining 5.4%.
Fellow tech giant Apple ended off earlier lows, down just 0.1% after reports that Chinese regulators are considering whether to open a formal probe into the iPhone giant’s App Store fees and policies.
But Google-owner Alphabet dropped 6.9% after its fourth-quarter revenue – released after-hours on Tuesday - missed expectations, especially on disappointing earnings from its cloud division, which is closely tied to AI.
And Advanced Micro Devices shed 6.3% after its fourth-quarter data center revenue came in at $3.9 billion, below consensus expectations of $4.15 billion.
Elsewhere with earnings, Uber Technologies lost 7.6% after the ride-hailing and food delivery giant forecast current-quarter bookings below estimates.
Snapchat parent Snap fell 8.4% despite the social-media company posting a surprise quarterly profit and higher-than-expected revenue, with some analysts highlighting concerns about user growth and an app transition rollout.
Walt Disney shed 2.4% after the entertainment company reported a loss of subscribers at its Disney+ streaming service, even as it posted better-than-anticipated first-quarter earnings.
Ford Motor lost 1.5% after the car firm reported fourth-quarter earnings that surpassed Wall Street expectations but its electric vehicle (EV) division posted a steep loss and the automaker warned of increasing challenges ahead.
But Mattel surged 15.3% higher after the toy company reported earnings ahead of consensus estimates late Tuesday thanks to higher margins, with sales slightly ahead of expectations.
With commodities, gold prices hit another record high at $2,877 an ounce amid safe haven buying in the face of Trump war worries.
However, oil prices were lower on trade concerns and after higher-than-expected US crude inventories data raised worries over consumption levels in the world’s largest consumer.
US crude stocks rose by just over 5 million barrels in the week ended January 31, according to American Petroleum Institute data, while gasoline inventories rose by a similar amount.

USOILRoll Daily
US WTI crude dropped 2.1% to $71.18 a barrel, while UK Brent crude shed 1,8% at $74.63 a barrel.
Meanwhile, the price of Bitcoin fell by 0.3% to around $97,450, with the key cryptocurrency failing to sustain gains above the key $100,000 level, amid the escalating US-China trade tensions.
However, analysts at Standard Chartered believe Bitcoin can hit $500,000 before President Donald Trump leaves office in four-years’ time, citing increased investor access and declining volatility as key drivers.
Disclaimer:
The information contained in this market commentary is of general nature only and does not take into account your objectives, financial situation or needs. You are strongly recommended to seek independent financial advice before making any investment decisions.
Trading margin forex and CFDs carries a high level of risk and may not be suitable for all investors. Investors could experience losses in excess of total deposits. You do not have ownership of the underlying assets. AC Capital Market (V) Ltd is the product issuer and distributor. Please read and consider our Product Disclosure Statement and Terms and Conditions, and fully understand the risks involved before deciding to acquire any of the financial products provided by us.
The content of this market commentary is owned by AC Capital Market (V) Ltd. Any illegal reproduction of this content will result in immediate legal action.
0 notes
Text
The Canadian Dollar vs. Japanese Yen: The Secret Sauce to News Trading Mastery Why Most Traders Get News Trading Wrong (And How You Can Avoid It) Trading the Canadian Dollar (CAD) against the Japanese Yen (JPY) is like betting on a heavyweight boxer versus a ninja—one thrives on raw power (commodity-driven CAD), while the other dances through the chaos (safe-haven JPY). The problem? Most traders treat news trading like a game of roulette, hoping to hit it big instead of playing it smart. But today, we're pulling back the curtain on little-known insider techniques that let you ride the market waves instead of being crushed by them. Let’s dive into the underground strategies, overlooked economic signals, and game-changing ideas that will turn you into a news trading ninja. What Drives CAD/JPY? The Hidden Forces Behind the Pair 1. Oil Prices – The Fuel Behind CAD - Canada is a major oil exporter, meaning CAD has a direct correlation with crude oil prices. - When oil prices rise, CAD strengthens. When they fall, CAD takes a hit faster than a bad meme stock. - Secret Tip: Check WTI crude oil trends before placing trades—this is the cheat code institutional traders use. 2. Japan’s Love Affair with Risk Aversion - JPY is the world’s ultimate safe-haven currency. - If global markets panic (think recession fears or geopolitical tensions), JPY strengthens. - Underground Hack: If you see a spike in VIX (volatility index), expect money to flow into JPY. 3. The Bank of Canada vs. Bank of Japan – Who’s Calling the Shots? - The BoC is aggressive and isn’t afraid to raise interest rates. - The BoJ is ultra-dovish and avoids rate hikes like a diet-averse trader avoids salads. - Pro Move: The bigger the interest rate difference (spread) between Canada and Japan, the more opportunities for carry trades. Elite News Trading Strategies for CAD/JPY 1. The "Whale Move" Play – Front Running Economic Data - Major institutions position their trades before economic data releases. - Key news events to watch for CAD/JPY: - Canada's GDP, CPI, and Employment Reports - Japan’s Tankan Survey & BOJ Announcements - U.S. NFP (Yes, CAD/JPY reacts to this too!) - The Play: Use a "straddle strategy" around high-impact events. Set pending buy/sell orders 10-15 pips above/below recent highs/lows and ride the post-news volatility. 2. The "Fakeout Slayer" – Avoiding Stop Loss Hunts - Ever had your stop-loss triggered seconds before the price reversed in your favor? That’s market manipulation 101. - Secret Technique: Don’t place your stop loss at obvious support/resistance levels. Instead, use an ATR-based dynamic stop-loss (2.5x ATR) to stay under the radar. 3. The "Reverse Gold Rush" Strategy – CAD/JPY’s Secret Correlation - Most traders don’t realize CAD/JPY moves in sync with GOLD… until it’s too late. - When gold rises, JPY strengthens (risk-off move), causing CAD/JPY to drop. - Advanced Play: Use gold trends as an early warning system for CAD/JPY reversals. Case Study: The January 2024 CPI Shock In January 2024, Canada’s inflation data shocked the market, coming in hotter than expected. While most traders were still rubbing their eyes from their morning coffee, smart money had already front-ran the data. - Before the CPI release: Oil prices had been trending up for weeks, signaling CAD strength. - Smart traders anticipated an upside move in CAD/JPY and positioned early. - Result: CAD/JPY surged +150 pips in minutes, while uninformed traders were caught chasing the move too late. Lesson: The market doesn’t react to news—it anticipates it. Your job? Be one step ahead. Pro Tips for Mastering CAD/JPY News Trading ✅ Always check oil trends before trading CAD. Oil is the CAD whisperer. ✅ Monitor global risk sentiment. If fear is in the air, expect JPY strength. ✅ Use pending orders during major news events. Capture the move without emotional execution errors. ✅ Never chase the first spike. Institutions fake moves to shake out retail traders. ✅ Watch gold trends. They often hint at CAD/JPY’s next move. Unlock the Next-Level Edge Want to stay ahead of the market with exclusive Forex insights? Level up your trading game with our expert-backed resources: 🚀 Latest Forex News: Stay informed on real-time updates at StarseedFX Forex News 📘 Forex Education: Discover little-known strategies at StarseedFX Free Courses 📊 Community Membership: Get elite trading signals & analysis at StarseedFX Community —————– Image Credits: Cover image at the top is AI-generated Read the full article
0 notes
Text
The Impact of Oil Prices on Currency Exchange Rates
Introduction
Oil is one of the most influential commodities in the global economy, and its price fluctuations have significant effects on currency exchange rates. As a key driver of inflation, trade balances, and economic stability, oil prices impact the strength of both oil-exporting and oil-importing countries' currencies. Understanding the relationship between oil prices and foreign exchange (Forex) markets is crucial for traders, investors, and policymakers.
The Link Between Oil Prices and Currency Values
Oil prices affect currency exchange rates through supply and demand dynamics, trade balances, and economic performance. When oil prices rise, oil-exporting nations benefit as their revenues increase, often strengthening their currencies. Conversely, oil-importing countries may experience economic strain, leading to currency depreciation. The extent of this impact varies depending on a country's reliance on oil for revenue and economic stability.
Oil-Exporting Countries and Currency Strength
Countries that rely heavily on oil exports, such as Saudi Arabia, Russia, Canada, and Norway, often see their currencies strengthen when oil prices rise. Higher oil revenues increase foreign investment, improving the country's trade balance and boosting demand for its currency. For example, when oil prices surged in the early 2000s, the Russian ruble and Canadian dollar appreciated significantly. Similarly, when oil prices decline, these currencies tend to weaken due to reduced export earnings.

Oil-Importing Countries and Currency Depreciation
Oil-importing nations, including the United States, Japan, and most European countries, often experience currency depreciation when oil prices rise. Higher oil costs increase production expenses, contribute to inflation, and strain economic growth. This weakens investor confidence, leading to capital outflows and a decline in currency value. For instance, when oil prices spiked in 2008, the U.S. dollar faced depreciation pressures due to increased import costs and inflationary concerns.
The Role of the U.S. Dollar in Oil Prices
The U.S. dollar plays a unique role in the oil market because oil is primarily traded in dollars. When oil prices rise, oil-importing countries need more dollars to purchase crude oil, increasing demand for the currency. However, if high oil prices weaken the U.S. economy, the dollar may depreciate in the long term. Additionally, oil-exporting nations with large dollar reserves may diversify their holdings, influencing currency markets.
Inflation and Interest Rate Effects
Oil price fluctuations directly impact inflation rates, influencing central bank policies and interest rate decisions. Rising oil prices can lead to inflation, prompting central banks to raise interest rates to stabilize the economy. Higher interest rates often attract foreign capital, strengthening a currency. Conversely, when oil prices drop, inflationary pressures ease, and central banks may lower interest rates, leading to currency depreciation.
Geopolitical Risks and Market Reactions
Geopolitical events, such as conflicts in oil-producing regions or supply chain disruptions, can cause oil prices to fluctuate sharply, impacting currency markets. For example, tensions in the Middle East often lead to oil supply concerns, driving prices higher and strengthening the currencies of oil-exporting nations. Forex traders closely monitor geopolitical developments to anticipate potential currency movements related to oil price shifts.
Hedging Strategies in Forex Trading
Given the strong correlation between oil prices and currency exchange rates, Forex traders often use hedging strategies to manage risks. Traders may invest in currencies of oil-exporting nations when oil prices rise or short-sell these currencies when prices fall. Additionally, analyzing oil market trends helps traders predict Forex movements and adjust their positions accordingly.
Conclusion
Oil prices play a critical role in shaping currency exchange rates, affecting both oil-exporting and oil-importing nations differently. While rising oil prices tend to strengthen currencies of oil-rich countries, they often weaken those of oil-dependent importers. The influence of oil prices extends to inflation, interest rates, and geopolitical risks, making it a key factor in Forex market analysis. Understanding this relationship allows traders and investors to make informed decisions, manage risks, and capitalize on market opportunities.
0 notes
Text
Market Update: Key Indices and Stocks Show Mixed Movements Amidst Economic Projections
Index Futures Overview
As the trading day commenced, the major U.S. stock index futures exhibited modest fluctuations. Dow Jones Futures traded largely unchanged, indicating a neutral market sentiment. Meanwhile, S&P 500 Futures edged up by 2 points, representing a 0.1% increase. The Nasdaq 100 Futures also climbed by 20 points, or 0.1%, reflecting slight optimism in the tech sector.
Economic Projections: Job Market Insights
Economists are keeping a close watch on the U.S. labor market data, anticipating the addition of 189,000 jobs in June. This follows a stronger-than-expected increase of 272,000 jobs in May. The employment figures are crucial as they provide insights into the health of the economy and can influence Federal Reserve policy decisions. A robust job market typically signals economic strength, while any shortfall could raise concerns about a potential slowdown.
Stock Movements: Highlights and Lowlights
Tesla (NASDAQ: TSLA): Tesla's stock saw a premarket boost of nearly 2%, continuing its trend of strong performance. This increase may be attributed to positive investor sentiment surrounding the company's ongoing innovations and expansion plans in the electric vehicle market.
Macy’s (NYSE: M): Macy’s stock surged by 4% premarket. This rise could be due to positive retail sector performance or specific company news that has bolstered investor confidence. Macy’s, as a major player in the retail industry, often reflects broader consumer spending trends.
Coinbase Global (NASDAQ: COIN): In contrast, Coinbase Global experienced a significant drop, with its stock falling 6.5% premarket. The decline in Coinbase's stock price may be linked to recent regulatory scrutiny or market volatility impacting the cryptocurrency sector.
Commodity Market Movements
Crude Oil: U.S. crude futures (WTI) rose slightly by 0.1% to $83.98 a barrel, suggesting steady demand despite global economic uncertainties. Conversely, the Brent crude contract saw a marginal decline, trading at $87.40 a barrel. These movements indicate mixed market sentiments influenced by factors such as supply concerns and geopolitical developments.
Cryptocurrency Update
Bitcoin: The world's leading digital currency, Bitcoin, faced a downturn, falling to its lowest level since February. This decline reflects broader market trends affecting cryptocurrencies, including regulatory pressures and changes in investor sentiment.
Conclusion
Today's market snapshot presents a mixed picture with minor gains in major indices and varied performances among prominent stocks. Economic projections, particularly job market data, will play a crucial role in shaping market movements in the near term. Investors are advised to stay informed about ongoing economic indicators and company-specific developments to navigate the dynamic market landscape effectively.
This article provides a comprehensive overview of the current market trends, highlighting key indices, stocks, and economic projections. It offers valuable insights for investors and market watchers looking to understand the factors driving today's financial landscape.
#MarketTrends#StockMarket#IndexFutures#EconomicProjections#JobMarket#TeslaStock#MacyStock#CoinbaseGlobal#CrudeOil#BitcoinUpdate#FinancialMarkets#InvestingInsights#MarketAnalysis#CommodityMarkets#CryptocurrencyTrends
2 notes
·
View notes
Video
youtube
DOTUSDT 19 Consecutive Successes! Title: "PrimeXAlgo NVDA: 231 Consecutive Winning Trades! 🔥 | AI Trading Signals for Stock Markets"Description: 🚀 Breaking News: PrimeXAlgo OIL Achieves 27 Consecutive Trading Successes!Revolutionizing Oil Trading with Advanced AI Technology: ✅ 27 Consecutive Successful Trades ✅ Real-Time Live Chart Analysis ✅ No Repainting Signals ✅ AI-Powered Decision Making 🔍 Unique Features: Analysis of 2,500+ Market IndicatorsCross-Market Compatibility (Oil, Gold, Bitcoin, Nasdaq)Real-Time Signal Generation100% Legal & Ethical Trading TechnologyWorks in All Time ZonesAdvanced AI Implementation 💹 Markets Coverage: Oil TradingCommoditiesCryptocurrencyForexStocksIndices 🌐 Join Our Trading Community: Website: https://primexalgo.com Telegram: https://t.me/primexalgo Discord: https://discord.com/channels/1288670367401119888/1288670564126294078 Instagram: https://instagram.com/primexalgo X/Twitter: https://x.com/PrimeXAlgo Facebook: https://www.facebook.com/profile.php?id=61566510386136 ⏰ Video Timeline: 0:00 - Introduction 1:30 - Oil Trading Success Story 3:00 - Technology Overview 4:30 - Live Trading Demo 6:00 - Implementation Guide 8:00 - Results & TestimonialsStart maximizing your oil trading potential with PrimeXAlgo today! #OilTrading #AITrading #TradingSignals #CommodityTrading #PrimeXAlgo #FinancialMarkets #TradingSuccess #OilMarket #AITechnology #TradingStrategy #Investment #Finance #Trading Tags: primexalgo oil, oil trading signals, ai trading oil, commodity trading, trading algorithm, oil market analysis, oil trading strategy, automated trading, oil price prediction, trading indicators, real-time trading, technical analysis, oil market signals, crude oil trading, energy trading, market analysis, trading technology, ai trading system, oil futures, market prediction
2 notes
·
View notes
Text

Global Green Chemicals Market Size, Share, Growth and Forecast 2032
Global Green Chemicals Market size was valued at USD 129.58 billion in 2024 which is expected to reach USD 302.09 billion in 2032 with a CAGR of 11.16% between 2025 and 2032. Green chemicals are essential to economies if any country what to survive the exaggerating pollution levels and worsening livelihood of common populace. Air, water and food are essential commodities and even the rich (HNI) are finding it difficult to breathe in poor quality air, drink dirty water and eat polluted or GMO food.
No matter how much money is invested, all 3 can never be cleaned to a level of pre-industrial era where everything was naturally pure. Everyone started understanding problems associated with oil and chemicals and forcing governments to push through green alternatives demanding green chemicals which have the capability to change all that.
Crude oil depletion is another major factor owing to which the world is shifting towards green chemicals. As per IEA, oil demand is increasing rapidly and only in 2023, it is expected to increase by 1.9 million barrels per day (mb/d) reaching 101.7 mb/d, however supply is set to slow to 1 mb/d resulting in usage of more inventories and further increase in oil prices this year.
Rise in Consumer Demand for Sustainable Products Driving Global Green Chemicals Market
The increasing consumer demand for sustainable products is pivotal in driving the global green chemicals market. Today’s consumers are more eco-conscious, preferring products that are environmentally friendly and non-toxic. This trend spans various sectors, from food and beverages to personal care. Companies respond by adopting green chemicals in their production processes to meet these demands. As a result, the market experiences robust growth, supported by consumers willing to pay a premium for sustainability. This shift in consumer preferences is not just a passing trend but a powerful force shaping the future of the chemicals industry.
For instance, in May 2024, according to PwC’s 2024 voice of the consumer survey consumers are willing to pay 9.7% more for sustainably produced goods, despite inflation and cost-of-living concerns. This demonstrates a strong preference for eco-friendly products, driven by almost nine-in-ten experiencing the disruptive effects of climate change. As consumers prioritize sustainability, companies must balance affordability with environmental impact to meet this demand. This shift underscores the significant role of consumer demand in driving the global green chemicals market, encouraging industries to adopt and innovate green chemistry solutions.
Increased investment paving the way for a biofuel economy in Europe
Europe is a technologically advanced region and is heavily investing in the research and development of green chemicals. By the end of 2021, there have been 88 green chemistry projects operating in Europe, including 12 expansion projects and 73 new construction projects. The companies with the most involvement in these initiatives is BASF SE, INEOS, Northvolt AB, and Air Liquide SA. Germany, France, Spain, United Kingdom and Belgium are some of the top countries in the EU in which majority of these developments have taken place.
The use of biofuels for transportation in the European Union (EU) countries has increased over time, amounting to 1.6 million metric tons between 2015 and 2020. In Europe, Biodiesel was the most used biofuel in 2020 with a total consumption of 15.8 million metric tons, or approximately 13 million metric tonnes of oil equivalent. In 2020, the Covid-19 pandemic is closely linked to the decline in biofuels in addition to the United Kingdom’s exclusion from the EU.
Declining Crude Oil and Gas Reserves
One of the major factors that is also going to act as a prominent driver is the decreasing dependence on fossil fuels and increasing demand for a bio backed economy and renewable sources of energy since green chemicals involve utilizing renewable resources to create materials and energy includes using crops, woods and microorganisms. As per World Bank report on Congo economic prosperity in 2023, Congo’s 40% of GDP is dependent on crude oil business and depleting reserves can wipe out most of its supply by 2040, leaving limited room for further extraction since after a significant extraction, crude starts becoming heavy.
Bio-based products include bioplastics, fertilisers and chemicals. We can better safeguard our environment and biodiversity if we reduce our reliance on fossil fuels. Green chemicals offer several advantages over what we know as the conventional chemicals as they are more functional, efficient and most importantly are more environmentally friendly not only at their application but throughout their life cycle that is their synthesis, production, dispatchment as well as degradation is of no harm to the environment.
Biodiesel and Bioethanol are the Future of Mobility
Travel is a common substituent in the life of a working professional and makes up a significant time of the day for a working individual. The fuel consumption globally has increased tremendously in past few decades as there have been newer developments in the amounts of vehicles being produced. Conventional fuels cause damage to the environment and emit pollutants including CO, SO2, NO2 and even CFC in some cases which is majorly responsible for the ozone layer depletion. Crude Oil resources are also limited and their consumption has been exponentially rising. Therefore, it have made the world realize the use of green chemicals as biofuels and with a heavy investment, supply and demand are generated from the biofuel segment.
Several countries have policies and government regulations, which promotes usage of biofuels such as the National Policy on Biofuels in India. Biofuels contributes to 3.6% of the global transportation energy consumption in 2021, primarily for road transportation. Compared to 2021, the market for biofuels increased by 6% or 9,100 Million Litres Per Year, in 2022. Due to favourable policies in the United States and Europe, bio diesel is the fastest growing transportation fuel based on year-over-year growth. Brazil and India’s demand scenario are supported by blending mandates and financial incentives, and Indonesia’s 30% biodiesel blending mandate encourages the use of the fuel in the country.
In 2022, conventional ethanol is the most produced and consumed biofuel followed by conventional biodiesel, both contributing to over 96% share in global biofuel market. Advanced biodiesel and bio jet kerosene are still a developing category, whereas advanced ethanol is generating strong investments and started showcasing its potential.
Impact of COVID-19
The COVID-19 outbreak caused supply chain disruptions, production halts and manufacturing activity interruptions, all of which had a detrimental effect on the green chemicals market in 2020. In addition, automotive were not moving during lockdown and hence demand for fuel including biofuels tanked. Several automotive manufacturers halted their operations and some limited their productions due to negligible demand for months, which decreased the need for green chemicals especially biofuels. Several on-going green chemicals plants construction also halted due to financial and labour shortage along with limited movement of labours.
Download Free Sample Report
Impact of Russia-Ukraine War
The Russia-Ukraine war led to a high volatility in the price of crude oil leading arising the need and making it clear that the world needs to be shifting to greener alternatives of energy and therefore this promoted the use of green chemicals. Russia’s war on Ukraine has severely disrupted international markets, exposing weaknesses in the security of the raw material supply that is essential for industrial production. Export limitations, a lack of transparency and ongoing market asymmetries, particularly the concentration of production in a small number of countries and bilateral dependencies are the key factors impacting supply chain susceptibilities.
Report Scope
“Global Green Chemicals Market Assessment, Opportunities and Forecast, 2018-2032”, is a comprehensive report by Markets and Data, providing in-depth analysis and qualitative & quantitative assessment of the current state of the green chemicals market globally, industry dynamics and challenges. The report includes market size, segmental shares, growth trends, COVID-19 and Russia-Ukraine war impact, opportunities, and forecast between 2025 and 2032. Additionally, the report profiles the leading players in the industry mentioning their respective market share, business model, competitive intelligence, etc.
Click here for full report- https://www.marketsandata.com/industry-reports/green-chemicals-market
Latest reports-
Contact
Mr. Vivek Gupta 5741 Cleveland street, Suite 120, VA beach, VA, USA 23462 Tel: +1 (757) 343–3258 Email: [email protected] Website: https://www.marketsandata.com
0 notes
Text

Exploring the Forex Market: A Comprehensive Guide for Canada
Canada, a country with a robust economy and strong ties to global trade, plays a significant role in the forex market. The foreign exchange market (forex or FX) is the largest and most liquid financial market in the world, where currencies are traded 24/5. For Canadian traders and investors, the forex market offers unique opportunities and challenges. This guide will provide a detailed overview of forex trading, its relevance to Canada, and how traders can leverage strategies to maximize their success.
What Does Forex Mean?
Forex, short for foreign exchange, refers to the global marketplace for exchanging national currencies. This decentralized market operates 24 hours a day across major financial centers worldwide. Forex trading involves buying one currency while simultaneously selling another, making it a paired transaction. For example, when trading USD/CAD, you are speculating on the value of the U.S. dollar against the Canadian dollar.
Why Is Forex Important in Canada?
Economic Significance: Canada is one of the world’s largest exporters of natural resources, such as oil, natural gas, and minerals. Fluctuations in commodity prices often impact the Canadian dollar (CAD), making forex trading a critical area of interest for investors.
Global Trade: With strong trading relationships with the U.S., China, and Europe, Canada’s currency plays a vital role in international trade. The CAD is often seen as a “commodity currency,” influenced by the nation’s export dynamics.
Accessibility: Forex trading is accessible to Canadian residents through online platforms, providing an opportunity for individuals to participate in the global economy.
How to Start Forex Trading in Canada
Understand the Basics: Learn key concepts like currency pairs, pips, leverage, and margin.
Choose a Reliable Broker: Opt for a regulated broker that complies with Canadian financial laws. Popular regulatory bodies include the Investment Industry Regulatory Organization of Canada (IIROC).
Open a Trading Account: Register with a broker, verify your identity, and fund your account.
Educate Yourself: Leverage educational resources, webinars, and demo accounts to practice trading strategies.
Develop a Trading Plan: Outline your goals, risk tolerance, and preferred trading strategy.
Monitor Market News: Stay updated on economic indicators, geopolitical events, and central bank policies that affect currency movements.
Popular Currency Pairs for Canadian Traders
USD/CAD: The most traded pair involving the Canadian dollar, heavily influenced by oil prices and U.S. economic data.
EUR/CAD: Reflects trade dynamics between Canada and the European Union.
CAD/JPY: Popular among traders seeking exposure to the Japanese yen and Canadian dollar.
GBP/CAD: Offers insights into the economic relationship between Canada and the United Kingdom.
Key Forex Trading Strategies for Canadians
Trend Trading: Identify and follow market trends to maximize profits. For example, a rising oil price often strengthens the CAD.
Range Trading: Trade within a defined range when the market lacks clear trends.
Breakout Trading: Capitalize on significant price movements by identifying breakout levels.
Scalping: Execute multiple trades in a single day to take advantage of minor price changes.
Hedging: Protect your portfolio from adverse price movements by taking offsetting positions.
Economic Indicators Impacting CAD
Oil Prices: As a major exporter of oil, fluctuations in crude oil prices significantly influence the Canadian dollar.
GDP Data: Economic growth indicators impact the currency’s strength.
Interest Rates: Decisions by the Bank of Canada regarding interest rates affect forex traders’ sentiment.
Employment Reports: High employment rates often strengthen the CAD, while unemployment rates weaken it.
Trade Balance: A positive trade balance supports the CAD, whereas a deficit can create downward pressure.
Benefits of Forex Trading in Canada
High Liquidity: The forex market’s vast size ensures quick transactions with minimal slippage.
Flexible Trading Hours: Trade anytime, aligning with global financial centers’ operations.
Leverage Opportunities: Increase your market exposure with a small initial investment.
Diversification: Hedge against risks in other financial markets.
Risk and Challenges
Volatility: Rapid price changes can lead to significant losses.
Leverage Risks: While leverage amplifies gains, it also increases potential losses.
Regulatory Compliance: Ensure your broker adheres to IIROC standards to protect your investments.
Market Complexity: Understanding global economic events requires continuous learning.
Role of Technology in Forex Trading
Modern technology has revolutionized forex trading. Tools like MT4/MT5 platforms provide advanced charting features, automated trading options, and real-time market data. Mobile apps allow traders to manage their accounts on the go, ensuring they never miss an opportunity.
Why Choose Forex Bank Liquidity for Forex Trading?
At Forex Bank Liquidity, traders gain access to:
Accurate Signals: High-quality trading signals tailored for optimal profitability.
Expert Guidance: Personalized strategies from seasoned forex professionals.
Comprehensive Resources: Educational content to enhance your trading skills.
Community Support: Join a thriving community of traders to share insights and experiences.
Forex Trading Regulations in Canada
Canada’s forex market is well-regulated, ensuring transparency and investor protection. Key regulatory bodies include:
IIROC: Oversees brokers and ensures compliance with industry standards.
Canadian Securities Administrators (CSA): Regulates securities and financial markets.
Traders should verify their broker’s credentials and avoid unregulated platforms to safeguard their investments.
Conclusion
The forex market offers immense potential for Canadian traders willing to navigate its complexities. By leveraging proven strategies, staying informed, and partnering with reliable platforms like Forex Bank Liquidity, traders can achieve consistent success. Whether you’re a beginner or an experienced trader, the forex market provides opportunities to grow your wealth and master the art of currency trading. Start your journey today and unlock the potential of forex trading in Canada.
#forex #education #forexsignals #forex #robot #forex #expert #advisor #forexbankliquidity #bankliquidity #forexmarket #forex #digitalmarketing #forextrading
#ForexForBeginners #ForexEducation #TradingSuccess #forex #education #forexsignals #forex #robot #forex #expert #advisor #forexbankliquidity #bankliquidity #forexmarket #forex #digitalmarketing #forextrading
0 notes
Text
How Global Economic Trends Affect India’s Trade Balance

The trade balance, defined as the difference between a country's exports and imports, is a critical indicator of its economic health. For India, managing its trade balance has always been a delicate challenge due to its reliance on imports for energy and raw materials, coupled with efforts to boost exports. Global economic trends significantly influence the trade balance India maintains, as shifts in international markets, geopolitical tensions, and global supply chain dynamics directly impact trade flows. In this article, we’ll explore how these trends shape India’s trade balance and its implications for the economy.
1. Impact of Global Oil Prices
India is one of the world’s largest importers of crude oil, which constitutes a significant portion of its total imports. Fluctuations in global oil prices have a direct and immediate effect on India's trade balance.
Rising Oil Prices: When oil prices surge, India’s import bill increases dramatically, widening the trade deficit. This is particularly challenging since higher energy costs ripple through the economy, affecting manufacturing and transportation.
Falling Oil Prices: Conversely, a decline in oil prices eases import costs, improving the trade balance. However, this can be offset by reduced demand for Indian exports from oil-exporting nations affected by low prices.
India’s energy import dependency makes it highly sensitive to global crude price volatility, underscoring the need for energy diversification and domestic production.
2. Geopolitical Tensions and Trade Wars
Geopolitical events and trade disputes can disrupt global trade flows, impacting India's trade balance both directly and indirectly.
Disrupted Supply Chains: Conflicts like the Russia-Ukraine war have disrupted global supply chains for essential commodities like wheat, fertilizers, and oil. For India, this has led to higher import costs for fertilizers and energy while creating export opportunities for commodities like wheat.
Shifting Trade Alliances: Trade wars, such as those between the U.S. and China, present both challenges and opportunities. India has benefited by positioning itself as an alternative manufacturing hub, but it also faces increased competition in global markets.
Geopolitical stability is crucial for maintaining predictable trade flows and a balanced trade deficit.
3. Global Demand and Economic Slowdowns
Global demand for goods and services plays a vital role in determining India’s export performance. Economic slowdowns or recessions in key markets can severely affect India’s trade balance.
Weak Global Demand: A slowdown in major economies like the U.S., EU, or China reduces demand for Indian exports, especially in sectors like textiles, IT services, and gems and jewelry.
Emerging Market Growth: On the flip side, strong growth in emerging markets opens new opportunities for Indian exports, helping to narrow the trade deficit.
The dependence on external demand highlights the importance of diversifying India’s export markets to reduce vulnerability to global economic fluctuations.
4. Currency Fluctuations
Exchange rate movements significantly influence the trade balance India maintains with its trading partners.
Rupee Depreciation: A weaker rupee makes Indian exports more competitive globally but increases the cost of imports, particularly crude oil and electronics.
Rupee Appreciation: While a stronger rupee reduces import costs, it can make exports less competitive, impacting sectors reliant on foreign markets.
Managing currency volatility is vital for maintaining a stable trade balance and ensuring economic resilience.
5. Global Trade Policies and Agreements
International trade policies, including tariffs, sanctions, and free trade agreements (FTAs), shape the dynamics of India’s trade balance.
Tariffs and Sanctions: Higher tariffs or trade restrictions imposed by partner countries can hinder India’s export potential, worsening the trade deficit.
Free Trade Agreements: Recent FTAs, such as those with the UAE and Australia, aim to boost Indian exports by reducing trade barriers and expanding market access.
Adapting to evolving trade policies is critical for enhancing India’s export competitiveness and mitigating trade imbalances.
6. Impact of Global Supply Chain Shifts
The COVID-19 pandemic and subsequent supply chain disruptions have reshaped global trade patterns, affecting India's imports and exports.
Supply Chain Realignment: Many companies are adopting a "China+1" strategy to diversify supply chains, presenting opportunities for India to attract investments and increase exports.
Logistical Challenges: Disruptions in shipping and logistics during the pandemic led to higher costs and delays, negatively impacting India’s trade performance.
India’s efforts to strengthen its manufacturing sector and improve logistics infrastructure aim to leverage these global shifts for long-term trade gains.
7. Commodity Price Volatility
Global trends in commodity prices, including metals, agricultural products, and natural gas, directly impact India’s trade balance.
Rising Import Costs: Higher global prices for commodities like coal and fertilizers increase India’s import bill, widening the trade deficit.
Export Opportunities: Favorable pricing for Indian agricultural exports, such as rice and sugar, can offset import costs to some extent.
Balancing import dependencies with export potential is crucial for stabilizing the trade balance in the face of commodity price volatility.
Conclusion
Global economic trends have a profound impact on the trade balance India maintains, influencing its imports, exports, and overall economic stability. From oil price fluctuations and geopolitical tensions to shifting supply chains and global demand, these factors present both challenges and opportunities. To mitigate risks and leverage opportunities, India must focus on diversifying its export base, reducing import dependencies, and strengthening its position in global value chains. By adopting strategic policies and fostering economic resilience, India can better navigate global economic shifts and improve its trade balance over the long term.
0 notes