#aws cloudwatch metrics
Explore tagged Tumblr posts
Visit Tumblr Blog
Explore Tumblr blogs with no restrictions, modern design and the best experience.
Last Seen Tumblr Blogs


Fun Fact
Celebrities use Tumblr as well.
Video
youtube
AWS CloudWatch Alarm Setup | Sending CloudWatch Alarm to AWS SNS Topic Full Video Link - https://youtu.be/rBKYS3SUcHM Check out this new video on the CodeOneDigest YouTube channel! Learn how to create AWS cloudwatch alarm, Setup Amazon Simple Notification. How to send cloudwatch alarm to SNS topic. #codeonedigest #sns #aws #simplenotificationservice #cloudwatch #cloudwatchalarm #cloudwatchmetrics@codeonedigest @awscloud @AWSCloudIndia @AWS_Edu @AWSSupport @AWS_Gov @AWSArchitecture
#youtube#aws#amazon cloud#aws cloudwatch alarm#aws simple notification service#amazon sns service#aws sns#aws sns topic#amazon cloudwatch alarm#aws cloudwatch metrics
0 notes
Text
How can you optimize the performance of machine learning models in the cloud?
Optimizing machine learning models in the cloud involves several strategies to enhance performance and efficiency. Here’s a detailed approach:

Choose the Right Cloud Services:
Managed ML Services:
Use managed services like AWS SageMaker, Google AI Platform, or Azure Machine Learning, which offer built-in tools for training, tuning, and deploying models.
Auto-scaling:
Enable auto-scaling features to adjust resources based on demand, which helps manage costs and performance.
Optimize Data Handling:
Data Storage:
Use scalable cloud storage solutions like Amazon S3, Google Cloud Storage, or Azure Blob Storage for storing large datasets efficiently.
Data Pipeline:
Implement efficient data pipelines with tools like Apache Kafka or AWS Glue to manage and process large volumes of data.
Select Appropriate Computational Resources:
Instance Types:
Choose the right instance types based on your model’s requirements. For example, use GPU or TPU instances for deep learning tasks to accelerate training.
Spot Instances:
Utilize spot instances or preemptible VMs to reduce costs for non-time-sensitive tasks.
Optimize Model Training:
Hyperparameter Tuning:
Use cloud-based hyperparameter tuning services to automate the search for optimal model parameters. Services like Google Cloud AI Platform’s HyperTune or AWS SageMaker’s Automatic Model Tuning can help.
Distributed Training:
Distribute model training across multiple instances or nodes to speed up the process. Frameworks like TensorFlow and PyTorch support distributed training and can take advantage of cloud resources.
Monitoring and Logging:
Monitoring Tools:
Implement monitoring tools to track performance metrics and resource usage. AWS CloudWatch, Google Cloud Monitoring, and Azure Monitor offer real-time insights.
Logging:
Maintain detailed logs for debugging and performance analysis, using tools like AWS CloudTrail or Google Cloud Logging.
Model Deployment:
Serverless Deployment:
Use serverless options to simplify scaling and reduce infrastructure management. Services like AWS Lambda or Google Cloud Functions can handle inference tasks without managing servers.
Model Optimization:
Optimize models by compressing them or using model distillation techniques to reduce inference time and improve latency.
Cost Management:
Cost Analysis:
Regularly analyze and optimize cloud costs to avoid overspending. Tools like AWS Cost Explorer, Google Cloud’s Cost Management, and Azure Cost Management can help monitor and manage expenses.
By carefully selecting cloud services, optimizing data handling and training processes, and monitoring performance, you can efficiently manage and improve machine learning models in the cloud.
2 notes
·
View notes
Text
How to Use Apache JMeter for Performance Testing

1. Introduction
What is Apache JMeter?
Apache JMeter is an open-source tool designed for performance, load, and stress testing of web applications, APIs, databases, and more. It allows testers to simulate multiple users accessing an application simultaneously to measure its performance under different conditions.
Why Use JMeter for Performance Testing?
Free & Open-Source: No licensing costs.
User-Friendly GUI & Scripting Support: Suitable for beginners and advanced users.
Extensive Plugin Support: Allows for extended capabilities.
Supports Multiple Protocols: HTTP, FTP, JDBC, SOAP, and more.
Distributed Testing: Can generate a high load across multiple machines.
Common Use Cases for JMeter
Evaluating website and API performance under load.
Identifying server bottlenecks before deployment.
Stress testing to determine the breaking point of an application.
2. Installing Apache JMeter
Prerequisites
Java (JDK 8 or higher) installed. Verify using:
bash
java -version
JMeter Installation Package: Download from JMeter’s official site.
Installation Steps (Windows, macOS, Linux)
Extract the JMeter ZIP file into a directory.
Navigate to bin and launch JMeter:
Windows: Run jmeter.bat
macOS/Linux: Run ./jmeter
3. Understanding JMeter Components
Before running a test, it’s essential to understand JMeter’s building blocks:
Test Plan:
A test plan defines the structure of your performance test, including thread groups, samplers, listeners, and assertions.
Thread Group (Users & Load Simulation):
Defines number of virtual users (threads).
Specifies ramp-up time (gradual increase in users).
Controls loop count (number of test iterations).
Samplers (Types of Requests to Test)
JMeter supports different types of requests:
HTTP Request: Used for testing websites and REST APIs.
JDBC Request: Used for database performance testing.
FTP Request: Tests FTP servers.
Listeners (Result Analysis & Reports)
View Results Tree: Displays response details.
Aggregate Report: Provides overall test metrics.
Graph Results: Visual representation of response times.
Timers, Assertions, and Config Elements
Timers: Simulate realistic user wait times.
Assertions: Verify response correctness.
Config Elements: Store variables like base URL, login credentials.
4. Creating a Basic Performance Test
Step 1: Create a New Test Plan
Open JMeter → File → New Test Plan
Step 2: Add a Thread Group
Right-click on Test Plan → Add → Threads (Users) → Thread Group
Configure:
Number of Threads (Users): e.g., 100
Ramp-Up Period: e.g., 20 seconds
Loop Count: Infinite or fixed
Step 3: Add an HTTP Request Sampler
Right-click Thread Group → Add → Sampler → HTTP Request
Configure:
Server Name: example.com
Path: /login
Method: POST
Step 4: Add a Listener
Right-click Thread Group → Add → Listener → View Results Tree
Step 5: Run the Test & View Results
Click the Start (Green Play Button).
Observe the request-response details in View Results Tree.
5. Analyzing Performance Test Results
After running the test, it’s important to interpret the key performance metrics:
Metric Description Response Time Time taken to complete a request. Through put Requests processed per second. Error Rate Percentage of failed requests. Latency Time taken before the first response is received.
Example Report Interpretation:
High response times? Possible server bottleneck.
Low throughput? Needs performance optimization.
High error rate? Application may be failing under load.
6. Best Practices for Performance Testing with JMeter
1. Define Clear Test Objectives
What user load are you expecting?
What is the acceptable response time?
2. Simulate Real-World User Behavior
Use timers to avoid unrealistic rapid-fire requests.
Vary user interactions (e.g., login, browsing, checkout).
3. Monitor Server Performance
Use JMeter + APM tools (New Relic, Grafana, or AWS CloudWatch) to track CPU, memory, and database load.
4. Optimize JMeter Scripts for Large Tests
Avoid GUI Mode: Run tests in CLI mode (jmeter -n -t test.jmx).
Use Distributed Testing: Split the load across multiple machines.
5. Integrate JMeter with CI/CD Pipelines
Automate performance tests using Jenkins, GitHub Actions, or GitLab CI/CD.
7. Conclusion
Apache JMeter is a powerful tool for performance testing web applications, APIs, and databases. With a structured approach — defining test plans, running load tests, and analyzing results — developers and testers can identify bottlenecks and improve application scalability.
WEBSITE: https://www.ficusoft.in/software-testing-course-in-chennai/
0 notes
Text
A Deep Dive into Amazon CloudWatch: Your Ultimate Monitoring Solution
In today's cloud-centric world, effective monitoring is crucial for maintaining the performance and reliability of applications and services. Amazon CloudWatch, a core component of the Amazon Web Services (AWS) ecosystem, offers a robust solution for monitoring AWS resources and applications. In this blog, we’ll explore the features, benefits, and best practices for using Amazon CloudWatch to ensure your cloud infrastructure operates smoothly.
If you want to advance your career at the AWS Course in Pune, you need to take a systematic approach and join up for a course that best suits your interests and will greatly expand your learning path.
What is Amazon CloudWatch?
Amazon CloudWatch is a comprehensive monitoring and observability service designed to provide real-time insights into your AWS environment. It collects data from various AWS resources, enabling users to track performance, set alarms, and gain visibility into overall system health. With CloudWatch, organizations can proactively manage their cloud resources, ensuring optimal performance and minimal downtime.
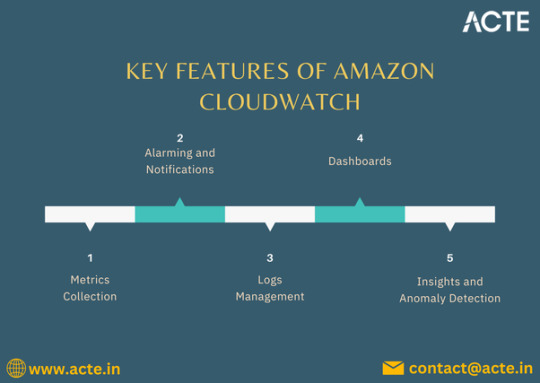
Key Features of Amazon CloudWatch
1. Comprehensive Metrics Collection
CloudWatch automatically gathers metrics from numerous AWS services. This includes essential data points such as CPU utilization, memory usage, and network traffic for services like EC2, RDS, and Lambda. By aggregating this data, users can monitor the health and efficiency of their resources at a glance.
2. Log Management and Analysis
CloudWatch Logs allows you to collect, monitor, and analyze log files from your applications and AWS resources. Users can search through logs in real-time, set retention policies, and create metrics based on log data, enabling effective troubleshooting and performance optimization.
3. Alarms and Notifications
Setting up CloudWatch Alarms helps you stay informed about the health of your services. You can define thresholds for specific metrics, and when those thresholds are breached, CloudWatch can trigger notifications via Amazon SNS (Simple Notification Service), ensuring you can act swiftly to address potential issues.
4. Custom Dashboards
CloudWatch Dashboards enable users to create personalized views of their metrics. These visual representations allow for easy monitoring of multiple resources, helping teams identify trends, bottlenecks, and anomalies quickly.
5. Event-Driven Monitoring
With CloudWatch Events, you can respond to changes in your AWS environment automatically. By defining rules, you can trigger actions based on specific events, such as scaling resources in response to increased load, further enhancing the automation of your infrastructure management.
6. Integration with AWS Services
CloudWatch integrates seamlessly with a wide range of AWS services, including AWS Lambda, Auto Scaling, and Amazon ECS (Elastic Container Service). This integration allows for more cohesive operations and enables automated responses to monitoring data.
To master the intricacies of AWS and unlock its full potential, individuals can benefit from enrolling in the AWS Online Training.

Benefits of Using Amazon CloudWatch
- Enhanced Operational Visibility
CloudWatch provides deep insights into your AWS resources, making it easier to monitor performance and troubleshoot issues before they escalate.
- Cost Management
By leveraging CloudWatch's monitoring capabilities, organizations can optimize resource usage, avoiding unnecessary costs associated with over-provisioning or underutilized resources.
- Increased Application Reliability
Proactive monitoring and alerting help maintain high application performance and reliability, leading to improved user experiences and satisfaction.
- Streamlined Automation
Automating responses to specific metrics and log events can save time and reduce the need for manual interventions, allowing teams to focus on more strategic initiatives.
Conclusion
Amazon CloudWatch is an indispensable tool for anyone utilizing AWS. Its comprehensive monitoring capabilities empower organizations to maintain high levels of performance and reliability in their cloud environments. By leveraging the features and best practices outlined in this blog, you can optimize your use of CloudWatch and ensure your applications run smoothly, ultimately enhancing business success in the cloud.
0 notes
Video
youtube
Amazon RDS Performance Insights | Monitor and Optimize Database Performance
Amazon RDS Performance Insights is an advanced monitoring tool that helps you analyze and optimize your database workload in Amazon RDS and Amazon Aurora. It provides real-time insights into database performance, making it easier to identify bottlenecks and improve efficiency without deep database expertise.
Key Features of Amazon RDS Performance Insights:
✅ Automated Performance Monitoring – Continuously collects and visualizes performance data to help you monitor database load. ✅ SQL Query Analysis – Identifies slow-running queries, so you can optimize them for better database efficiency. ✅ Database Load Metrics – Displays a simple Database Load (DB Load) graph, showing the active sessions consuming resources. ✅ Multi-Engine Support – Compatible with MySQL, PostgreSQL, SQL Server, MariaDB, and Amazon Aurora. ✅ Retention & Historical Analysis – Stores performance data for up to two years, allowing trend analysis and long-term optimization. ✅ Integration with AWS Services – Works seamlessly with Amazon CloudWatch, AWS Lambda, and other AWS monitoring tools.
How Amazon RDS Performance Insights Helps You:
🔹 Troubleshoot Performance Issues – Quickly diagnose and fix slow queries, high CPU usage, or locked transactions. 🔹 Optimize Database Scaling – Understand workload trends to scale your database efficiently. 🔹 Enhance Application Performance – Ensure your applications run smoothly by reducing database slowdowns. 🔹 Improve Cost Efficiency – Optimize resource utilization to prevent over-provisioning and reduce costs.
How to Enable Amazon RDS Performance Insights: 1️⃣ Navigate to AWS Management Console. 2️⃣ Select Amazon RDS and choose your database instance. 3️⃣ Click on Modify, then enable Performance Insights under Monitoring. 4️⃣ Choose the retention period (default 7 days, up to 2 years with paid plans). 5️⃣ Save changes and start analyzing real-time database performance!
Who Should Use Amazon RDS Performance Insights? 🔹 Database Administrators (DBAs) – To manage workload distribution and optimize database queries. 🔹 DevOps Engineers – To ensure smooth database operations for applications running on AWS. 🔹 Developers – To analyze slow queries and improve app performance. 🔹 Cloud Architects – To monitor resource utilization and plan database scaling effectively.
Amazon RDS Performance Insights simplifies database monitoring, making it easy to detect issues and optimize workloads for peak efficiency. Start leveraging it today to improve the performance and scalability of your AWS database infrastructure! 🚀
**************************** *Follow Me* https://www.facebook.com/cloudolus/ | https://www.facebook.com/groups/cloudolus | https://www.linkedin.com/groups/14347089/ | https://www.instagram.com/cloudolus/ | https://twitter.com/cloudolus | https://www.pinterest.com/cloudolus/ | https://www.youtube.com/@cloudolus | https://www.youtube.com/@ClouDolusPro | https://discord.gg/GBMt4PDK | https://www.tumblr.com/cloudolus | https://cloudolus.blogspot.com/ | https://t.me/cloudolus | https://www.whatsapp.com/channel/0029VadSJdv9hXFAu3acAu0r | https://chat.whatsapp.com/BI03Rp0WFhqBrzLZrrPOYy *****************************
*🔔Subscribe & Stay Updated:* Don't forget to subscribe and hit the bell icon to receive notifications and stay updated on our latest videos, tutorials & playlists! *ClouDolus:* https://www.youtube.com/@cloudolus *ClouDolus AWS DevOps:* https://www.youtube.com/@ClouDolusPro *THANKS FOR BEING A PART OF ClouDolus! 🙌✨*
#youtube#AmazonRDS RDSPerformanceInsights DatabaseOptimization AWSDevOps ClouDolus CloudComputing PerformanceMonitoring SQLPerformance CloudDatabase#amazon rds database S3 aws devops amazonwebservices free awscourse awstutorial devops awstraining cloudolus naimhossenpro ssl storage cloudc
0 notes
Text
Step-by-Step Guide to AIOps Platform Development for Enterprises
As IT infrastructures become more complex, enterprises are increasingly turning to AIOps (Artificial Intelligence for IT Operations) platforms to streamline operations, enhance efficiency, and proactively manage incidents. A well-developed AIOps platform can automate troubleshooting, reduce downtime, and optimize IT performance using AI and machine learning.

In this blog, we’ll take you through a step-by-step guide to AIOps platform development for enterprises, covering everything from planning and data integration to model deployment and continuous optimization.
Step 1: Define Business Goals and Requirements
Before starting AIOps platform development, enterprises must clearly define objectives and align them with business needs. Key considerations include:
What IT challenges need to be solved? (e.g., downtime reduction, anomaly detection, performance optimization)
What metrics will define success? (e.g., Mean Time to Resolution (MTTR), system uptime, cost savings)
What existing IT tools and processes need integration?
A collaborative approach involving IT teams, data scientists, and business stakeholders ensures alignment between AIOps capabilities and enterprise goals.
Step 2: Choose the Right AIOps Architecture
The AIOps platform should be designed with scalability, flexibility, and real-time processing in mind. A typical AIOps architecture consists of:
1. Data Collection Layer
Collects data from logs, metrics, traces, and event streams
Integrates with IT monitoring tools (e.g., Splunk, Datadog, Prometheus)
2. Data Processing & Normalization
Cleans and structures raw data to prepare it for analysis
Eliminates redundant, outdated, and irrelevant data
3. AI & Machine Learning Models
Uses anomaly detection, predictive analytics, and event correlation algorithms
Applies natural language processing (NLP) for automated log analysis
4. Automation & Remediation Layer
Implements self-healing capabilities through automation scripts
Provides recommendations or auto-remediation for IT incidents
5. Visualization & Reporting
Dashboards and reports for monitoring insights
Custom alerts for proactive issue resolution
By selecting the right cloud-based, on-premises, or hybrid architecture, enterprises ensure scalability and flexibility.
Step 3: Data Integration & Collection
AIOps thrives on real-time, high-quality data from multiple sources. The platform should ingest data from:
IT infrastructure monitoring tools (Nagios, Zabbix)
Application performance monitoring (APM) tools (New Relic, AppDynamics)
Network monitoring tools (SolarWinds, Cisco DNA)
Cloud services (AWS CloudWatch, Azure Monitor)
💡 Best Practice: Use streaming data pipelines (Kafka, Apache Flink) for real-time event processing.
Step 4: Implement AI/ML Models for Analysis
The core of an AIOps platform is its AI-driven analysis. Enterprises should develop and deploy models for:
1. Anomaly Detection
Identifies abnormal patterns in system behavior using unsupervised learning
Helps detect issues before they escalate
2. Event Correlation & Noise Reduction
Uses graph-based analysis to correlate alerts from different sources
Filters out noise and reduces alert fatigue
3. Predictive Analytics
Forecasts potential failures using time-series forecasting models
Helps IT teams take preventive action
4. Incident Root Cause Analysis (RCA)
Uses AI-based pattern recognition to identify root causes
Reduces mean time to detect (MTTD) and mean time to resolve (MTTR)
💡 Best Practice: Continuously train and refine models using historical and real-time data for higher accuracy.
Step 5: Implement Automation & Self-Healing Capabilities
The true power of AIOps comes from its ability to automate responses and remediation. Enterprises should:
Automate routine IT tasks like server restarts, patch updates, and log cleanup
Use AI-driven playbooks for common incident resolution
Implement closed-loop automation where AI detects issues and applies fixes automatically
💡 Example: If an AIOps system detects high memory usage on a server, it can automatically restart specific processes without human intervention.
Step 6: Develop Dashboards & Alerts for Monitoring
To provide IT teams with real-time insights, enterprises must develop intuitive dashboards and alerting systems:
Use Grafana, Kibana, or Power BI for visualization
Set up dynamic alert thresholds using AI to prevent false positives
Enable multi-channel notifications (Slack, Teams, email, SMS)
💡 Best Practice: Implement explainable AI (XAI) to provide transparent insights into why alerts are triggered.
Step 7: Test, Deploy, and Optimize
After development, the AIOps platform should be rigorously tested for:
Scalability: Can it handle large data volumes?
Accuracy: Are AI models correctly identifying anomalies?
Latency: Is the system responding in real-time?
After successful testing, deploy the platform in stages (pilot → phased rollout → full deployment) to minimize risks.
💡 Best Practice: Implement a feedback loop where IT teams validate AI recommendations and continuously improve models.
Step 8: Continuous Learning and Improvement
AIOps is not a one-time setup—it requires continuous monitoring and optimization:
Retrain AI models regularly with new datasets
Refine automation workflows based on performance feedback
Incorporate user feedback to improve accuracy and usability
💡 Best Practice: Schedule quarterly AIOps audits to ensure efficiency and alignment with business goals.
Conclusion
Developing an AIOps platform for enterprises requires a structured, step-by-step approach—from goal setting and data integration to AI model deployment and automation. When implemented correctly, AIOps can enhance IT efficiency, reduce downtime, and enable proactive incident management.
0 notes
Text
A Deep Dive into Amazon CloudWatch: Your AWS Management Ally
In the ever-evolving landscape of cloud computing, effective monitoring and management are crucial for maintaining optimal performance and reliability. Amazon CloudWatch, a core service of Amazon Web Services (AWS), serves as a powerful ally in this regard. In this blog, we will explore the features, benefits, and real-world applications of Amazon CloudWatch, helping you leverage its capabilities to enhance your AWS environment.
If you want to advance your career at the AWS Course in Pune, you need to take a systematic approach and join up for a course that best suits your interests and will greatly expand your learning path.

What is Amazon CloudWatch?
Amazon CloudWatch is a robust monitoring service designed to provide real-time insights into AWS resources and applications. By collecting and tracking metrics, logs, and events, CloudWatch enables users to monitor their cloud infrastructure and applications comprehensively.
Key Features of Amazon CloudWatch
Comprehensive Metrics Collection: CloudWatch automatically gathers metrics from various AWS services such as EC2, RDS, and S3. You can also publish custom metrics to gain deeper visibility into your specific applications.
Log Management and Analysis: With CloudWatch Logs, you can collect, monitor, and analyze log files from your AWS resources, making troubleshooting and performance analysis more efficient.
Alarms and Notifications: CloudWatch allows you to set alarms based on specific metrics, enabling proactive monitoring. For instance, you can create alarms for CPU usage, memory consumption, or error rates, triggering notifications via Amazon SNS (Simple Notification Service) when thresholds are crossed.
Custom Dashboards: CloudWatch provides customizable dashboards that allow you to visualize your metrics and logs in a consolidated view, making it easier to track performance trends.
Event Management: With CloudWatch Events, you can respond to changes in your AWS resources automatically. This capability allows for automated workflows by triggering AWS Lambda functions or other actions based on specific events.
To master the intricacies of AWS and unlock its full potential, individuals can benefit from enrolling in the AWS Online Training.
Benefits of Using Amazon CloudWatch
Enhanced Visibility: Gain real-time insights into your applications and resources, facilitating better decision-making and troubleshooting.
Cost Efficiency: Monitor resource usage to identify underutilized instances or services. This insight helps optimize costs and allocate resources more effectively.
Improved Application Reliability: Proactive monitoring and alerting allow you to address issues before they impact users, ensuring a more reliable application experience.
Simplified Troubleshooting: Integration of logs with metrics streamlines the process of identifying and resolving issues, reducing downtime.
Real-World Use Cases
Application Performance Monitoring: Use CloudWatch to track the performance of your applications in real time, ensuring they run smoothly and efficiently.
Infrastructure Health Checks: Monitor the health and performance of your AWS infrastructure, including servers, databases, and network components, to maintain optimal operation.
Security and Compliance Monitoring: Leverage CloudWatch to monitor for suspicious activities in your AWS environment, enhancing your security posture.
Cost Management: Analyze usage patterns to identify areas for cost savings, helping you optimize your cloud expenditure.
Conclusion
Amazon CloudWatch is an indispensable tool for organizations utilizing AWS services. Its comprehensive monitoring, logging, and alerting features empower businesses to maintain high performance, reliability, and cost-efficiency. By leveraging CloudWatch effectively, you can ensure your applications and resources are always performing at their best, making it a valuable ally in your cloud management strategy.
0 notes
Text
"Mastering AWS CloudWatch: A Comprehensive Guide to Monitoring and Logging"
Introduction AWS CloudWatch is a powerful monitoring and logging service provided by Amazon Web Services (AWS). It allows you to collect and track metrics, logs, and performance data for your applications and services running on AWS. In this comprehensive guide, we will cover the core concepts, implementation, and best practices for mastering AWS CloudWatch. What you will learn: Core concepts…
0 notes
Video
youtube
CloudWatch Metrics Made Simple with Real-time Monitoring Full Video Link - https://youtu.be/3JBLgWFQ0cY Check out this new video on the CodeOneDigest YouTube channel! Learn how to use #cloudwatch for application health monitoring. How to create custom #metrics in AWS cloudwatch? Learn about cloudwatch #APM tool.@codeonedigest @awscloud @AWSCloudIndia @AWS_Edu @AWSSupport @AWS_Gov @AWSArchitecture
0 notes
Text
How to Use Amazon Sage Maker for Machine Learning Projects

How to Use Amazon SageMaker for Machine Learning Projects
Amazon SageMaker is a fully managed service that enables developers and data scientists to build, train, and deploy machine learning (ML) models at scale. It simplifies the ML workflow by providing infrastructure, automation, and built-in tools.
Step 1: Setting Up Amazon SageMaker
Log in to AWS Console: Navigate to Amazon SageMaker in the AWS Management Console.
Create a SageMaker Notebook Instance:
Go to Notebook Instances → Create Notebook Instance.
Select an instance type (e.g., ml.t2.medium for small workloads).
Attach an IAM Role with permissions to access S3, CloudWatch, and SageMaker.
Wait for the instance to be in the “InService” state.
Open Jupyter Notebook: Once the instance is ready, open Jupyter and start coding.
Step 2: Data Preparation
Load Data from Amazon S3
python
import boto3 import pandas as pd s3_bucket = "your-bucket-name" file_key = "data/train.csv" s3 = boto3.client("s3") obj = s3.get_object(Bucket=s3_bucket, Key=file_key) df = pd.read_csv(obj["Body"])
Preprocess the Data
Handle missing values.
Normalize numerical features.
Encode categorical variables.
python
df.fillna(0, inplace=True) # Replace missing values with zero df = pd.get_dummies(df, columns=["category_column"]) # One-hot encoding
Step 3: Training a Machine Learning Model
Select a Built-in Algorithm
SageMaker offers built-in algorithms like XGBoost, Linear Learner, and DeepAR.
Example: Using Linear Learner for classification.
Upload Data to S3
python
from sagemaker import Session session = Session() s3_train_path = session.upload_data("train.csv", bucket=s3_bucket, key_prefix="data")
Define an Estimator and Train the Model
python
import sagemaker from sagemaker.amazon.linear_learner
import LinearLearner role = sagemaker.get_execution_role() linear_learner = LinearLearner(role=role, instance_count=1, instance_type="ml.m4.xlarge")
linear_learner.fit({"train": s3_train_path})
Step 4: Model Deployment
Deploy as a Real-time Endpoint
python
predictor = linear_learner.deploy(initial_instance_count=1, instance_type="ml.m4.xlarge")
Make Predictions
python
import numpy as np test_data = np.array([[5.1, 3.5, 1.4, 0.2]]) # Example input result = predictor.predict(test_data) print(result)
Step 5: Model Monitoring and Optimization
Use Amazon CloudWatch to track metrics such as inference latency and CPU usage.
Enable Model Drift Detection using SageMaker Model Monitor.
Retrain Model Automatically using SageMaker Pipelines.
Conclusion
Amazon SageMaker simplifies the ML workflow by automating data preprocessing, training, deployment, and monitoring. It is ideal for businesses looking to scale ML applications efficiently.
WEBSITE: https://www.ficusoft.in/aws-training-in-chennai/
0 notes
Text
Beyond Testing: Monitoring APIs with Automation Tools
API automation tools are not just for testing; they play a crucial role in API monitoring, ensuring APIs perform optimally in real-world conditions. Monitoring APIs with automation tools offers continuous insights into performance, availability, and reliability, helping teams address issues proactively.
Real-Time Performance Tracking
Tools like Postman, ReadyAPI, and New Relic enable real-time monitoring of API response times, latency, and throughput. These metrics are critical to ensuring seamless user experiences.
Error Detection and Alerts
Automated monitoring tools can identify issues such as failed endpoints, incorrect responses, or timeouts. Alerts notify teams immediately, allowing quick resolution and minimizing downtime.
Monitoring in Production Environments
Tools like Datadog or AWS CloudWatch continuously monitor APIs in live environments, ensuring they function correctly under real-world load conditions.
Integration with CI/CD Pipelines
API monitoring can be integrated with CI/CD workflows, enabling teams to validate the stability of APIs with every release.
Ensuring SLA Compliance
Automated monitoring tracks uptime and response metrics to ensure APIs meet Service Level Agreements (SLAs).
By extending automation tools beyond testing into monitoring, teams can enhance their API lifecycle management, ensuring consistent performance and reliability in dynamic environments.
#api test automation#rest assured api testing#api automation#api automation testing tools#api test tool#api automation tools#rest api automation#rest api testing automation#best api automation testing tools#best api automation tools#api testing in automation
0 notes
Text
Exploring Amazon ECS: A Comprehensive Guide to AWS's Container Management Service
Amazon Elastic Container Service (ECS) is a powerful and flexible container orchestration service offered by Amazon Web Services (AWS). Designed for developers and organizations looking to deploy and manage containerized applications, ECS simplifies the orchestration process. In this blog, we'll explore the features, benefits, and best practices of using Amazon ECS.
If you want to advance your career at the AWS Course in Pune, you need to take a systematic approach and join up for a course that best suits your interests and will greatly expand your learning path.
What is Amazon ECS?
Amazon ECS allows you to run Docker containers on a managed cluster of Amazon EC2 instances. It abstracts the complexity of infrastructure management, enabling you to focus on building and deploying applications. With ECS, you can easily manage the lifecycle of your containers, scale applications based on demand, and integrate with other AWS services.
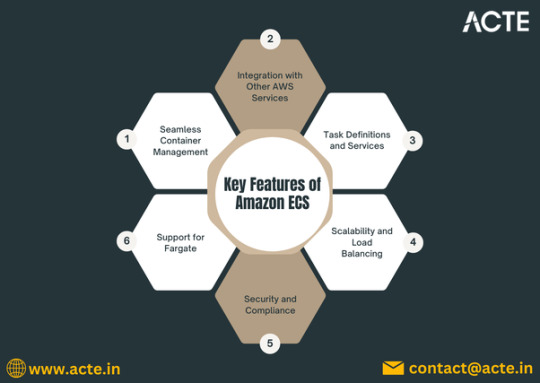
Key Features of Amazon ECS
1. Task Definitions
Task definitions are a crucial component of ECS. They define the parameters for your containers, including the Docker image to use, CPU and memory requirements, networking settings, and environment variables. This makes it easy to deploy consistent and repeatable container instances.
2. Service Management
ECS allows you to define services that maintain a specified number of task instances running at all times. If a task fails, ECS automatically replaces it, ensuring high availability for your applications.
3. Integration with AWS Services
ECS seamlessly integrates with other AWS services, such as Amazon RDS, Amazon S3, and AWS Lambda. This integration helps you build complex applications that leverage the full power of the AWS ecosystem.
4. Scalability and Load Balancing
ECS supports auto-scaling, allowing you to adjust the number of running tasks based on application demand. You can set up policies that scale your services in or out automatically, ensuring optimal performance while minimizing costs.
5. Security Features
ECS provides robust security controls, including IAM roles for fine-grained access management, VPC support for network isolation, and encryption options for sensitive data. This helps you maintain compliance and protect your applications.
6. Support for Fargate
AWS Fargate is a serverless compute engine for running containers. With Fargate, you can run ECS tasks without managing the underlying EC2 instances, simplifying deployment and scaling further.
To master the intricacies of AWS and unlock its full potential, individuals can benefit from enrolling in the AWS Online Training.
Benefits of Using Amazon ECS
Cost Efficiency: With ECS, you only pay for the resources you use, reducing infrastructure costs. Fargate eliminates the need for provisioning EC2 instances, allowing for more flexible billing.
High Availability: ECS is built for resilience. Its automatic health checks and self-healing capabilities ensure your applications remain available even in the face of failures.
Flexibility in Deployment: You can choose to run your containers on EC2 instances or use Fargate, giving you the flexibility to select the best deployment model for your needs.
Best Practices for Using Amazon ECS
Use Task Definitions Wisely: Create reusable task definitions to minimize duplication and ensure consistency across environments.
Implement Auto-Scaling: Set up auto-scaling policies based on metrics such as CPU utilization or request count to optimize resource usage.
Leverage IAM for Security: Use IAM roles to define permissions for your tasks, ensuring that your applications have access to only the resources they need.
Monitor and Log: Utilize AWS CloudWatch for monitoring and logging your ECS services. This will help you identify performance bottlenecks and troubleshoot issues.
Test Before Production: Always test your applications in a staging environment before deploying to production. This helps catch issues early and ensures a smooth rollout.
Conclusion
Amazon ECS is a robust solution for managing containerized applications in the cloud. With its rich feature set, seamless integration with AWS services, and support for both EC2 and Fargate, ECS provides the tools necessary to build, deploy, and scale applications efficiently. By understanding its capabilities and following best practices, you can harness the full potential of Amazon ECS to enhance your application development and deployment processes.
0 notes
Text
Amazon CloudWatch: The Solution For Real-Time Monitoring
What is Amazon CloudWatch?
Amazon CloudWatch allows you to monitor your Amazon Web Services (AWS) apps and resources in real time. CloudWatch may be used to collect and track metrics, which are characteristics you can measure for your resources and apps.
Every AWS service you use has metrics automatically displayed on the CloudWatch home page. Additionally, you may design your own dashboards to show analytics about your own apps as well as bespoke sets of metrics of your choosing.
When a threshold is crossed, you may set up alerts that monitor metrics and send messages or that automatically modify the resources you are keeping an eye on. For instance, you may keep an eye on your Amazon EC2 instances‘ CPU utilization and disk reads and writes, and then use that information to decide whether to start more instances to accommodate the increasing strain. To save money, you may also utilize this data to halt instances that aren’t being used.
CloudWatch gives you system-wide insight into operational health, application performance, and resource usage.
How Amazon CloudWatch works
In essence, Amazon CloudWatch is a storehouse for measurements. Metrics are entered into the repository by an AWS service like Amazon EC2, and statistics are retrieved using those metrics. Statistics on your own custom metrics may also be retrieved if you add them to the repository.
Metrics may be used to compute statistics, and the CloudWatch interface can then display the data graphically.
When specific conditions are fulfilled, you may set up alert actions to stop, start, or terminate an Amazon EC2 instance. Additionally, you may set up alerts to start Amazon Simple Notification Service (Amazon SNS) and Amazon EC2 Auto Scaling on your behalf. See Alarms for further details on setting up CloudWatch alarms.
Resources for AWS Cloud computing are kept in highly accessible data center buildings. Each data center facility is situated in a particular geographic area, referred to as a Region, to offer extra scalability and dependability. To achieve the highest level of failure isolation and stability, each region is designed to be totally separated from the others. Although metrics are kept independently in Regions, you may combine information from many Regions using CloudWatch’s cross-Region feature.
Why Use CloudWatch?
A service called Amazon CloudWatch keeps an eye on apps, reacts to changes in performance, maximizes resource use, and offers information on the state of operations. CloudWatch provides a consistent picture of operational health, enables users to create alarms, and automatically responds to changes by gathering data from various AWS services.
Advantages Of Amazon CloudWatch
Visualize and analyze your data with end-to-end observability
Utilize robust visualization tools to gather, retrieve, and examine your resource and application data.
Operate efficiently with automation
Utilize automated actions and alerts that are programmed to trigger at preset thresholds to enhance operational effectiveness.
Quickly obtain an integrated view of your AWS or other resources
Connect with over 70 AWS services with ease for streamlined scalability and monitoring.
Proactively monitor and get actional insights to enhance end user experiences
Use relevant information from your CloudWatch dashboards’ logs and analytics to troubleshoot operational issues.
Amazon CloudWatch Use cases
Monitor application performance
To identify and fix the underlying cause of performance problems with your AWS resources, visualize performance statistics, generate alarms, and correlate data.
Perform root cause analysis
To expedite debugging and lower the total mean time to resolution, examine metrics, logs, log analytics, and user requests.
Optimize resources proactively
By establishing actions that take place when thresholds are reached according to your requirements or machine learning models, you may automate resource planning and save expenses.
Test website impacts
By looking at images, logs, and web requests at any moment, you can determine precisely when and how long your website is affected.
Read more on Govidhtech.com
#AmazonCloudWatch#CloudWatch#AWSservice#AmazonEC2#EC2instance#News#Technews#Technology#Technologynews#Technologytrends#Govindhtech
0 notes
Text
"What Is the Role of an AWS Solution Architect in DevOps and Automation?"

The rapid adoption of cloud technologies has created a strong demand for professionals who can design and implement scalable, secure, and cost-effective cloud solutions. Among these professionals, the AWS Solution Architect stands out as a critical role in helping organizations harness the power of Amazon Web Services (AWS). But what exactly does an AWS Solution Architect do? Let’s break down this pivotal role.
1. Understanding Client Requirements
An AWS Solution Architect acts as a bridge between the technical and business sides of an organization. Their first responsibility is to thoroughly understand a client’s business objectives, challenges, and technical requirements. By assessing current infrastructure and identifying pain points, they lay the groundwork for an effective cloud solution.
Key responsibilities include:
Conducting stakeholder interviews.
Gathering and analyzing technical requirements.
Defining success metrics for cloud migration or deployment projects.
2. Designing Scalable and Secure Architectures
At the heart of their role, AWS Solution Architects design cloud architectures that are scalable, secure, and tailored to the client’s needs. Leveraging AWS’s wide range of services—such as EC2, S3, RDS, Lambda, and VPC—they create solutions that optimize performance and cost while ensuring high availability.
Key considerations during design include:
Security: Ensuring data encryption, access control, and compliance with industry standards.
Scalability: Designing systems that can handle traffic spikes and scale seamlessly.
Cost Optimization: Choosing the right AWS services to minimize costs while meeting requirements.
3. Overseeing Cloud Migration
When organizations move from on-premises infrastructure to AWS, Solution Architects play a crucial role in planning and executing the migration process. They develop step-by-step strategies, often employing AWS services like the AWS Migration Hub, Database Migration Service (DMS), and Snowball for seamless transitions.
Key tasks include:
Assessing current infrastructure for cloud readiness.
Identifying dependencies and prioritizing workloads for migration.
Ensuring minimal downtime during the transition.
4. Collaborating with Cross-Functional Teams
AWS Solution Architects don’t work in isolation. They collaborate with developers, DevOps engineers, system administrators, and business teams to implement their designs effectively. They often serve as technical advisors during the implementation phase, ensuring the architecture is executed as planned.
Collaboration may involve:
Guiding development teams on best practices for coding within the AWS environment.
Working with DevOps teams to set up CI/CD pipelines using AWS tools like CodePipeline and CodeBuild.
Assisting operations teams with monitoring and logging via services like CloudWatch and AWS X-Ray.
5. Ensuring Performance Optimization
Even after deployment, the role of an AWS Solution Architect doesn’t end. They continuously monitor and optimize systems to ensure they perform at their best. This includes:
Reviewing usage patterns and scaling resources accordingly.
Analyzing system performance using tools like AWS CloudWatch.
Suggesting optimizations to reduce costs, such as leveraging Spot Instances or improving database configurations.
6. Staying Updated with AWS Advancements
The AWS ecosystem evolves rapidly, with new services, features, and updates being released regularly. AWS Solution Architects must stay ahead of these changes to provide cutting-edge solutions to clients. This involves:
Earning AWS certifications (e.g., AWS Certified Solutions Architect – Associate or Professional).
Attending AWS events, such as re:Invent and AWS Summits.
Exploring new AWS services to identify opportunities for innovation.
7. Educating Clients and Teams
An often-overlooked aspect of the AWS Solution Architect’s role is education. They help clients and internal teams understand the architecture, tools, and best practices to maximize the value of their AWS investment. This includes:
Conducting workshops and training sessions.
Documenting solutions and creating technical guides.
Supporting teams in troubleshooting and issue resolution.
Why is the Role of an AWS Solution Architect Important?
The AWS Solution Architect’s role is crucial because they ensure that organizations can leverage AWS’s full potential to meet business goals. By combining technical expertise with business acumen, they:
Accelerate cloud adoption and innovation.
Reduce costs and improve efficiency.
Ensure robust security and compliance.
Foster collaboration between technical and non-technical teams.
Is Becoming an AWS Solution Architect Right for You?
If you’re passionate about technology, enjoy solving complex problems, and have strong communication skills, becoming an AWS Solution Architect could be an excellent career path. The role offers exciting challenges, high demand, and competitive compensation. To get started, consider earning the AWS Certified Solutions Architect – Associate certification as a foundation for building your expertise.
In conclusion, AWS Solution Architects play a vital role in shaping the cloud strategies of organizations worldwide. By bridging the gap between business needs and technical solutions, they help businesses thrive in the era of digital transformation. Whether you're a business leader or an aspiring professional, understanding this role can provide valuable insights into the future of cloud computing.
Let me know if you’d like the next blog or any adjustments!
#awstraining#cloudservices#softwaredeveloper#training#iot#data#azurecloud#artificialintelligence#softwareengineer#cloudsecurity#cloudtechnology#business#jenkins#softwaretesting#onlinetraining#ansible#microsoftazure#digitaltransformation#ai#reactjs#awscertification#google#cloudstorage#git#devopstools#coder#innovation#cloudsolutions#informationtechnology#startup
0 notes
Text
Generative AI in the Cloud: Best Practices for Seamless Integration
Generative AI, a subset of artificial intelligence capable of producing new and creative content, has seen widespread adoption across industries. From generating realistic images to creating personalized marketing content, its potential is transformative. However, deploying and managing generative AI applications can be resource-intensive and complex. Cloud computing has emerged as the ideal partner for this technology, providing the scalability, flexibility, and computing power required.
This blog explores best practices for seamlessly integrating generative AI development services with cloud consulting services, ensuring optimal performance and scalability.
1. Understanding the Synergy Between Generative AI and Cloud Computing
Why Generative AI Needs the Cloud
Generative AI models are data-intensive and require substantial computational resources. For instance, training models like GPT or image generators like DALL-E involves processing large datasets and running billions of parameters. Cloud platforms provide:
Scalability: Dynamically adjust resources based on workload demands.
Cost Efficiency: Pay-as-you-go models to avoid high upfront infrastructure costs.
Accessibility: Centralized storage and computing make AI resources accessible globally.
How Cloud Consulting Services Add Value
Cloud consulting services help businesses:
Design architectures tailored to AI workloads.
Optimize cost and performance through resource allocation.
Navigate compliance and security challenges.
2. Choosing the Right Cloud Platform for Generative AI
Factors to Consider
When selecting a cloud platform for generative AI, focus on the following factors:
GPU and TPU Support: Look for platforms offering high-performance computing instances optimized for AI.
Storage Capabilities: Generative AI models require fast and scalable storage.
Framework Compatibility: Ensure the platform supports AI frameworks like TensorFlow, PyTorch, or Hugging Face.
Top Cloud Platforms for Generative AI
AWS (Amazon Web Services): Offers SageMaker for AI model training and deployment.
Google Cloud: Features AI tools like Vertex AI and TPU support.
Microsoft Azure: Provides Azure AI and machine learning services.
IBM Cloud: Known for its AI lifecycle management tools.
Cloud Consulting Insight
A cloud consultant can assess your AI workload requirements and recommend the best platform based on budget, scalability needs, and compliance requirements.
3. Best Practices for Seamless Integration
3.1. Define Clear Objectives
Before integrating generative AI with the cloud:
Identify use cases (e.g., content generation, predictive modeling).
Outline KPIs such as performance metrics, scalability goals, and budget constraints.
3.2. Optimize Model Training
Training generative AI models is resource-heavy. Best practices include:
Preprocessing Data in the Cloud: Use cloud-based tools for cleaning and organizing training data.
Distributed Training: Leverage multiple nodes for faster training.
AutoML Tools: Simplify model training using tools like Google Cloud AutoML or AWS AutoPilot.
3.3. Adopt a Cloud-Native Approach
Design generative AI solutions with cloud-native principles:
Use containers (e.g., Docker) for portability.
Orchestrate workloads with Kubernetes for scalability.
Employ serverless computing to eliminate server management.
3.4. Implement Efficient Resource Management
Cloud platforms charge based on usage, so resource management is critical.
Use spot instances or reserved instances for cost savings.
Automate scaling to match resource demand.
Monitor usage with cloud-native tools like AWS CloudWatch or Google Cloud Monitoring.
3.5. Focus on Security and Compliance
Generative AI applications often handle sensitive data. Best practices include:
Encrypt data at rest and in transit.
Use Identity and Access Management (IAM) policies to restrict access.
Comply with regulations like GDPR, HIPAA, or SOC 2.
3.6. Test Before Full Deployment
Run pilot projects to:
Assess model performance on real-world data.
Identify potential bottlenecks in cloud infrastructure.
Gather feedback for iterative improvement.
4. The Role of Cloud Consulting Services in Integration
Tailored Cloud Architecture Design
Cloud consultants help design architectures optimized for AI workloads, ensuring high availability, fault tolerance, and cost efficiency.
Cost Management and Optimization
Consultants analyze usage patterns and recommend cost-saving strategies like reserved instances, discounts, or rightsizing resources.
Performance Tuning
Cloud consultants monitor performance and implement strategies to reduce latency, improve model inference times, and optimize data pipelines.
Ongoing Support and Maintenance
From updating AI frameworks to scaling infrastructure, cloud consulting services provide end-to-end support, ensuring seamless operation.
5. Case Study: Generative AI in the Cloud
Scenario: A marketing agency wanted to deploy a generative AI model to create personalized ad campaigns for clients. Challenges:
High computational demands for training models.
Managing fluctuating workloads during campaign periods.
Ensuring data security for client information.
Solution:
Cloud Platform: Google Cloud was chosen for its TPU support and scalability.
Cloud Consulting: Consultants designed a hybrid cloud solution combining on-premises resources with cloud-based training environments.
Implementation: Auto-scaling was configured to handle workload spikes, and AI pipelines were containerized for portability. Results:
40% cost savings compared to an on-premise solution.
50% faster campaign deployment times.
Enhanced security through end-to-end encryption.
6. Emerging Trends in Generative AI and Cloud Integration
6.1. Edge AI and Generative Models
Generative AI is moving towards edge devices, allowing real-time content creation without relying on centralized cloud servers.
6.2. Multi-Cloud Strategies
Businesses are adopting multi-cloud setups to avoid vendor lock-in and optimize performance.
6.3. Federated Learning in the Cloud
Cloud platforms are enabling federated learning, allowing AI models to learn from decentralized data sources while maintaining privacy.
6.4. Green AI Initiatives
Cloud providers are focusing on sustainable AI practices, offering carbon-neutral data centers and energy-efficient compute instances.
7. Future Outlook: Generative AI and Cloud Services
The integration of generative AI development services with cloud consulting services will continue to drive innovation. Businesses that embrace best practices will benefit from:
Rapid scalability to meet growing demands.
Cost-effective deployment of cutting-edge AI solutions.
Enhanced security and compliance in a competitive landscape.
With advancements in both generative AI and cloud technologies, the possibilities for transformation are endless.
Conclusion
Integrating generative AI with cloud computing is not just a trend—it’s a necessity for businesses looking to innovate and scale. By leveraging the expertise of cloud consulting services, organizations can ensure seamless integration while optimizing costs and performance.
Adopting the best practices outlined in this blog will help businesses unlock the full potential of generative AI in the cloud, empowering them to create, innovate, and thrive in a rapidly evolving digital landscape.
Would you like to explore implementation strategies or specific cloud platform comparisons in detail?
0 notes
Text
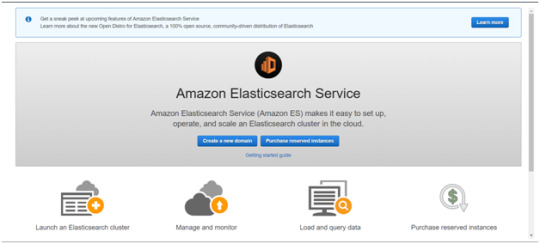
Is AWS Elasticsearch Developer’s True Hero?

Elasticsearch is a free open source search engine, which is used for log analytics, full-text search, application monitoring and more. It makes easy to deploy, operate and scale Elasticsearch clusters in the AWS Cloud. We can get direct access to the Elasticsearch APIs. It provides Scalability, Availability and Security for the workload process run.
Elasticsearch architecture
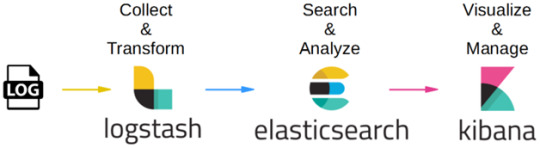
The AWS Elasticsearch Service Architecture is very dynamically to allow create instances, remove instances, change instance sizes, change storage configuration and customize to make other changes. This Elasticsearch allows to search and analyse the data log. It consists of three components.
Logstash – is used to collect and transferred to the Elasticsearch.
Elasticsearch –facilitates search and analyze with the logs stored in it. It acts as a database.
Kibana –Kibana enables the data visualization on the dashboard that uses ELK stack. This tool provides a quick insight of the documents using visualization Kibana’s dashboard contains interactive diagrams, geospatial data, and graphs to visualize complex queries that let you search, view, or interact with the stored data. Kibana helps you to perform advanced data analysis and visualize your data in a variety of tables, charts, and maps.
Get started with an Elastic Cluster with AWS
First, create an AWS account and follow the following steps to claim your domain.
Tap on to “Create a new domain”
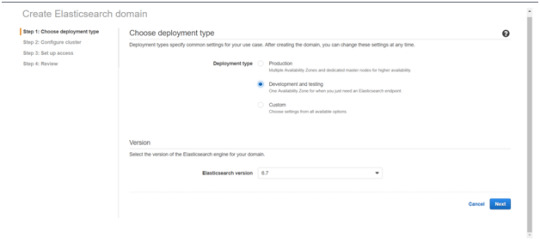
Select on the appropriated Deployment type and select the Elasticsearch version. Click Next.
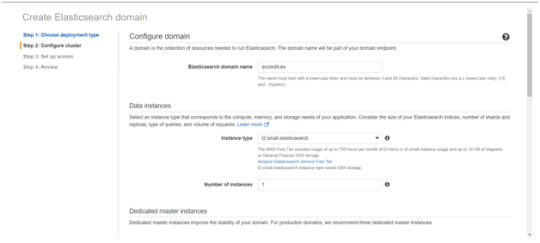
Enter a domain name and choose the Instance type in the prompt page and Click Next.
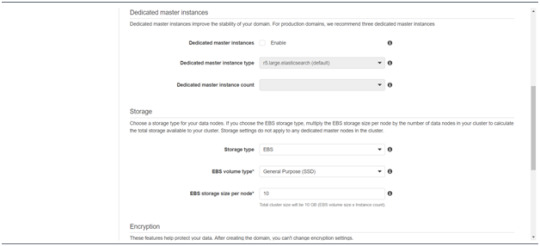
Follow to enter the “Dedicated master instances”
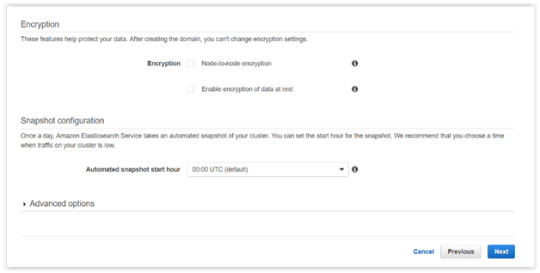
Click Next.
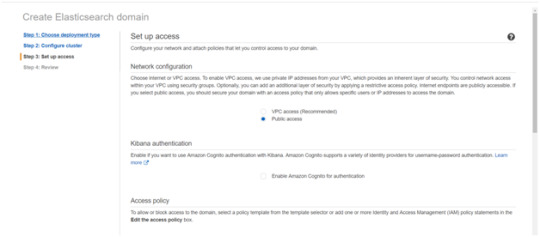
After the Cluster Configuration, you will be taken to the Set up access part. In the Setup access part, enable the specific set of users who can access your ElasticSearch cluster. There are two options — VPC access and Public access. Once you select one of the options and confirm your entries your new cluster is created.
Things to consider
1. Expandable
Amazon Elasticsearch Service provides to monitor your cluster through Amazon CloudWatch metrics.
We can change the cluster in various size from top or bottom within single clicks in the AWS management console or via a single API call.
There is a customizable setting available based on the range of instance types and storage options including SSD-powered EBS volumes.
2.Integrations
Many integrations available in the AWS Elasticsearch such as Kibana for data visualization, Amazon CloudTrail is used to audit API calls configure in AWS ES domains and integrate with Amazon Amazon S3, Amazon Kinesis, and Amazon DynamoDB for loading streaming data into Amazon ES.
3.Guarantee
It guarantees to provide a secure environment and easy integration with Amazon VPC and VPC security groups. There is an availability to access the Identity and Access Management (IAM) control. It provides authentication for Kibana and Data encryption with node-to-node encryption.
4.Availability
Amazon ES supports the different zones in two geographical locations and various node allocations with a large number of zones in the same region itself. It manages the cluster and notifies the damaged nodes automatically.
Conclusion
This article has covered what AWS Elastic Search means, its benefits, what happens between and how you can use it.
#AWS#Elasticsearch#LogAnalytics#SearchEngine#CloudComputing#DataVisualization#Kibana#Scalability#Security#CloudWatch#AWSIntegration#DataEncryption#VPC#ElasticCluster#API#CloudInfrastructure#TechSolutions#BigData#AWSElasticsearch#ElasticSearchService#DataAnalysis#CloudServices
0 notes