#analytical Dashboard
Explore tagged Tumblr posts
Text
design interactive power bi dashboards for your business
0 notes
Text
i get to work with time series data at work & im excited about it
#one step closer to becoming hermann gottlieb lmao#it's also interesting because it's like. the first job ive had where they just expect me to figure stuff out??#sort of anyway#like i have been given a thing to manage#they taught me how to do parts of that but basically im in charge of analysis#and like. figuring out WHAT needs doing#which means i get to watch stats videos at work 💕#my plan for the next week or so is like. every morning check how the thing is doing & make changes as needed#and then if i have extra time use that to refine my analytics approaches#which for now means setting up R so i can get the data in there lmao#we have a dashboard but the dashboard is best for eyeballin it#personal
3 notes
·
View notes
Text
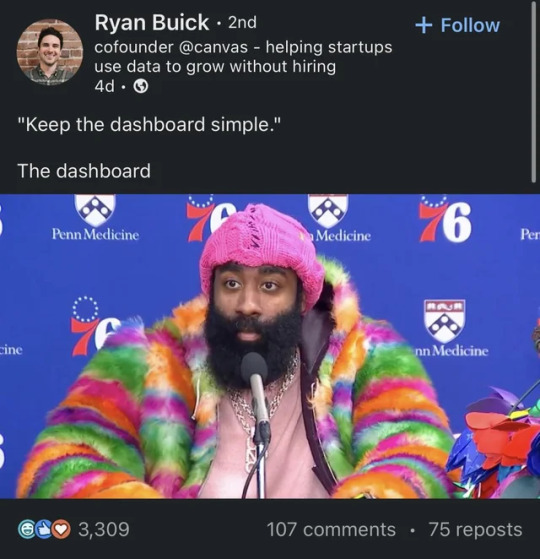
#Finance#Business#Work Meme#Work Humor#Excel#Hilarious#funny meme#funny#accounting#office humor#consulting#big data#data analysis#data visualization#data analytics#data#dashboard commentary#tableau#power bi
13 notes
·
View notes
Text
Dashboard laten maken?
2 notes
·
View notes
Text

You still been using outdated design tools to create dashboard mockups? 🥴 OOF. Issokay We've all been there.
Now create hi-fi dashboard wireframes with Mokkup.ai in under 30 mins. Share, comment, export and present your designs to the world! 🌎
#data analytics#dashboard#data#powerbi#tableau#visualization#dashboards#dashboard simulator#datascience#free#freetools
2 notes
·
View notes
Text
Top 5 Benefits of Low-Code/No-Code BI Solutions
Low-code/no-code Business Intelligence (BI) solutions offer a paradigm shift in analytics, providing organizations with five key benefits. Firstly, rapid development and deployment empower businesses to swiftly adapt to changing needs. Secondly, these solutions enhance collaboration by enabling non-technical users to contribute to BI processes. Thirdly, cost-effectiveness arises from reduced reliance on IT resources and streamlined development cycles. Fourthly, accessibility improves as these platforms democratize data insights, making BI available to a broader audience. Lastly, agility is heightened, allowing organizations to respond promptly to market dynamics. Low-code/no-code BI solutions thus deliver efficiency, collaboration, cost savings, accessibility, and agility in the analytics landscape.
#newfangled#polusai#etl#nlp#data democratization#business data#big data#ai to generate dashboard#business dashboard#bi report#generativeai#business intelligence tool#artificialintelligence#machine learning#no code#data analytics#data visualization#zero coding
3 notes
·
View notes
Text
Navigating Real-Time Operations: The Power of Operational Dashboards
Operational dashboards are dynamic visual interfaces that provide real-time insights into an organization's day-to-day activities and performance. These dashboards are particularly valuable for monitoring short-term operations at lower managerial levels, and they find application across various departments. They stand as the most prevalent tools in the realm of business intelligence.
Typically, operational dashboards are characterized by their comprehensive nature, offering junior managers detailed information necessary to respond to market dynamics promptly. They also serve to alert upper management about emerging trends or issues before they escalate. These dashboards primarily cater to the needs of managers and supervisors, enabling them to oversee ongoing activities and make rapid decisions based on the presented information. Operational dashboards often employ graphical representations like graphs, charts, and tables and can be customized to display information pertinent to the specific user.
Examples of data typically showcased on an operational dashboard include:
Sales figures
Production metrics
Inventory levels
Service levels
Employee performance metrics
Machine or equipment performance data
Customer service metrics
Website or social media analytics
It is crucial to emphasize that operational dashboards are distinct from other dashboard types, such as strategic and analytical dashboards. These different dashboards serve varied purposes and audiences and contain dissimilar datasets and metrics. Here are a couple of examples.
Below, you can see a Revenue overview dashboard for QuickBooks. It provides month-by-month overviews of invoices, products, customers, profit and loss. Such a dashboard can be used on a daily basis and help monitor and manage operating activities.
This data visualization is connected to a data automation solution, Coupler.io. It automatically transfers fresh data from QuickBooks to the dashboard, making it auto-updating. Such a live dashboard can be an important instrument for enabling informed decision-making.
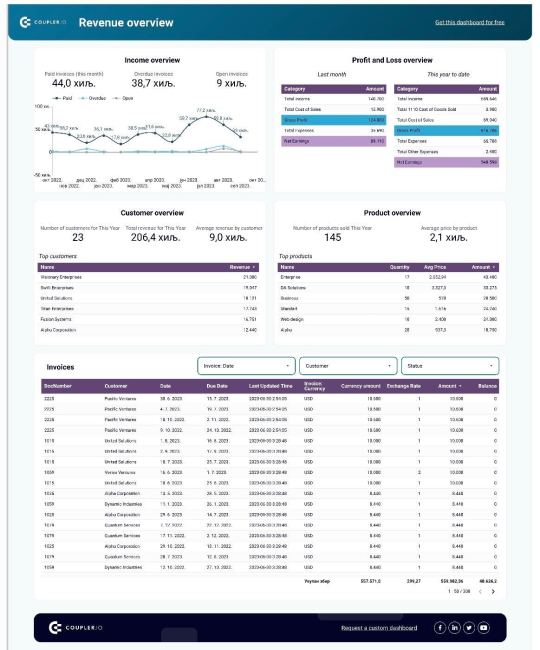
This Revenue overview dashboard is available as a free template. Open it and check the Readme tab to see how to use it.
Here’s another example of an operational dashboard, the Facebook Ads dashboard. It allows ad managers to closely track their ad performance. This dashboard is also powered by Coupler.io, so it depicts ad data in near real-time. This allows marketers to quickly define what works and what doesn’t and make adjustments on the go.
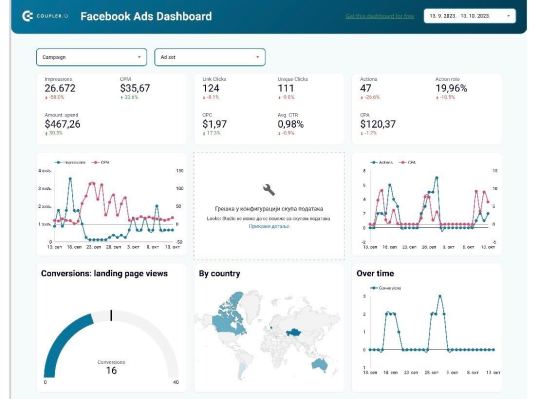
Facebook Ads dashboard is available as a free template. You can grab it and quickly get a copy of this dashboard with your data. In conclusion, operational dashboards are indispensable tools for organizations seeking to thrive in a dynamic business landscape. These real-time visual displays offer invaluable insights into day-to-day operations, equipping managers and supervisors with the information to make swift, informed decisions. As the most widely used business intelligence instruments, operational dashboards empower businesses to adapt to market changes, identify emerging trends, and maintain a competitive edge. Their versatility and capacity to monitor a wide range of metrics make them an essential asset for managing the intricacies of modern operations.
#marketing dashboards#digital marketing#dashboards#data analytics#data visualization#operational dashboards
2 notes
·
View notes
Text
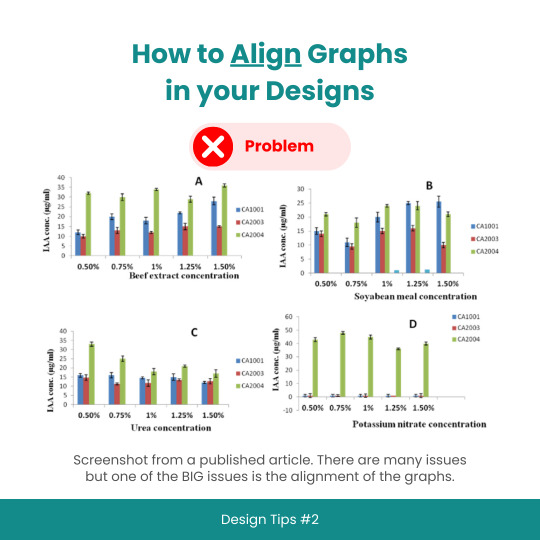
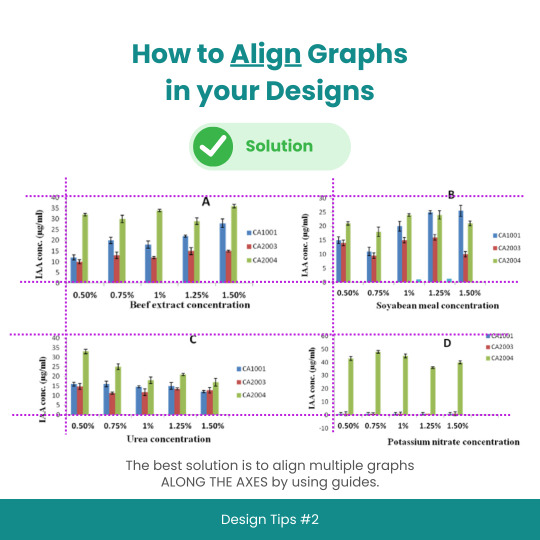

Design Tips #2: How to Align Graphs in your Designs
#designtips#datavisualization#graph#data#statistics#analytics#dataisbeautiful#chart#dashboard#datagram#dataart#infographic#informationisbeautiful#datatellingstories#datadesign#ddj#datasketch#dataviz
3 notes
·
View notes
Text
Advanced Power BI Techniques: From Data Prep to Visualization
In today’s data-driven world, businesses are constantly seeking smarter ways to turn raw data into actionable insights. Power BI, Microsoft’s powerful business analytics tool, is one of the most widely used platforms for data visualization and reporting. While beginners can build basic dashboards with ease, mastering advanced Power BI techniques can help you unlock the platform’s full potential—from data preparation to impactful visualizations.
If you're ready to take your skills to the next level, this article is your roadmap.

Why Go Beyond the Basics?
Power BI is more than just drag-and-drop charts. Advanced users tap into features like:
Power Query for complex data transformations
DAX (Data Analysis Expressions) for custom calculations
Data modeling for relational analysis
Row-level security for access control
Custom visuals and drill-through reports
These capabilities allow you to build highly interactive, real-time dashboards that deliver deep insights tailored to your organization’s needs.
Advanced Data Preparation with Power Query
Power Query is the engine behind Power BI’s data transformation capabilities. It allows users to clean, filter, merge, pivot, and shape data before it even hits the report canvas.
Examples of advanced data prep techniques:
Creating custom columns using M language
Merging multiple datasets from different sources
Automating refresh schedules for large-scale data flows
Mastering DAX for Smart Calculations
DAX is the formula language of Power BI. With it, you can create calculated columns, measures, and KPIs to deliver deeper analysis.
Popular advanced DAX functions:
CALCULATE – for dynamic filtering
FILTER – for customized context evaluation
TIME INTELLIGENCE – for date-based comparisons
RANKX – for creating rank-based insights
Advanced Visualizations That Tell a Story
Power BI lets you create more than just bar charts and pie graphs. With custom visuals, drill-through pages, bookmarks, and tooltips, you can build storytelling dashboards that guide users through your data.
Pro Tips:
Use heat maps and decomposition trees for root cause analysis.
Leverage tooltips to give extra context without cluttering the dashboard.
Use bookmarks to create guided reports or interactive presentations.
Power BI Training in KPHB: Learn from the Experts
If you’re serious about advancing your career in data analytics, enrolling in a structured course can be a game-changer. At NareshIT, our Power BI training in KPHB is designed to take you from intermediate to expert level with hands-on projects and real-world case studies.
👉 Visit NareshIT – Power BI Training in KPHB
FAQs – Power BI Training in KPHB
Q1: What is covered in the Power BI training at KPHB? A: The course covers Power BI basics, advanced DAX, Power Query, data modeling, report design, and real-time dashboards with hands-on practice.
Q2: Do I need prior experience with Power BI? A: Basic understanding of Excel and data concepts is helpful, but the course includes beginner to advanced content.
Q3: Is certification included? A: Yes, upon completion of the course, you’ll receive a recognized certification from NareshIT.
Q4: Are live projects included in the course? A: Absolutely! The training includes real-time projects to help you apply what you learn in practical scenarios.
Q5: How do I enroll in the Power BI course in KPHB? A: You can easily register online. Visit this link for more details.
Whether you're a data analyst, business user, or aspiring BI professional, mastering advanced Power BI techniques is a powerful step toward making smarter business decisions. Don’t just use data—make it work for you.
👉 Join Power BI Training in KPHB at NareshIT Today!
#powerbi#darascience#dataanalytics#BusinessIntelligence#data#DataInsights#python#DataDrivenDecisions#tableau#DataTools#sql#dashboard#DataReporting#onlinelearning#analytics#courses#dynamics#bi#software
0 notes
Text
How to Use No-Code Tools to Build Business Dashboards
Data is the new oil—but only if you know how to refine it. Business dashboards are the refinery. They transform raw data into clean, visual insights you can actually use. And the best part? You don’t need to write a single line of code to build one. Welcome to the no-code revolution. How to Use No-Code Tools to Build Business Dashboards What Are No-Code Dashboard Tools? No-code tools are…
#Airtable vs Looker Studio#business analytics tools#data visualization tools#how to build dashboards#no-code dashboards
0 notes
Text
oh k-science, we're really in it now
#personal#thank god i have my blorbos lmao#sooooo the other shoe has dropped on the math stuff at work#i have 2 bosses and. turns out they dont agree#one boss is really excited about it. other boss thinks it's gonna be a money pit#i did not know this until today's team meeting!#so when i mentioned that i was planning on setting up statistics software she immediately started asking questions#essentially putting me in the position of having to justify the expense of paying me to do this#they set up this fancy analytics dashboard but like. all anyone is doing with it is eyeballing things as far as i can tell#and like. thats fine. but she wants me to also use it#and it's like. if you want me to do proper stats i need the raw data#im not at risk of losing my job here but i am at risk of losing the chance to do math at work & get data experience#urgh. would like to lie face down for a while#im not politically savvy enough for this bro
1 note
·
View note
Text
The data management and analysis capabilities of your organization can be greatly enhanced by incorporating Power BI into your business processes. Power BI enables businesses to make smarter, faster decisions by offering powerful data visualization and real-time analytics. However, successfully implementing Power BI requires a strategic approach that covers everything from choosing the right developers to deploying dashboards and utilizing its services. The initial step in Power BI implementation is hiring developers skilled in creating solutions customized to your company's needs. These developers are responsible for setting up the technical framework, designing Power BI dashboards, and ensuring seamless integration with your data sources. A well-organized dashboard can transform complex data into easy-to-read visuals, giving decision-makers a clear view of business performance and trends. Once your dashboards run, the next focus is utilizing Power BI services. These services allow you to share reports across teams and collaborate effectively and securely. With Power BI's cloud-based capabilities, employees at all levels can access up-to-date insights, regardless of location, ensuring that everyone in the organization is on the same page when making crucial business decisions. A successful implementation also requires a clear understanding of your company's data needs and workflows. Identifying relevant data sources and ensuring they're correctly connected to Power BI is critical for providing accurate and actionable insights. Additionally, it's essential to train employees using the platform to get the most out of the tool. Empowering your team with the skills to use Power BI effectively ensures better adoption and more significant business value. Adopting Power BI in your enterprise offers many opportunities for more informed decision-making. Businesses can gain deeper insights into performance and trends by working with skilled Power BI developers, creating meaningful Power BI dashboards, and utilizing Power BI services to enhance collaboration.In addition to supporting a data-driven culture that promotes growth and maintains an organization's competitiveness, Power BI streamlines data analysis.
#microsoft power bi consultant#microsoft power bi solutions#power bi analytics#power bi consultants#power bi consulting company#power bi consulting services#power bi dashboard development#power bi data visualization#power bi developers#power bi development#power bi development company#power bi implementation#power bi integration services#power bi solutions#power bi services#data visualization with power bi#microsoft power bi consulting services#power bi administration#power bi consultant#power bi dashboard#power bi experts#power bi integration#power bi platform#power bi development services#power bi migration
0 notes
Text
Unlocking Insights with Kalodata: TikTok Creator Analytics
Hello everyone! I'm excited to share my experience with Kalodata's SaaS platform, particularly its TikTok creator analytics feature. As a content creator, understanding audience engagement and performance metrics is crucial. Kalodata provides a user-friendly interface that allows me to track my TikTok performance effortlessly.
The analytics dashboard is packed with insightful data, from viewer demographics to engagement rates, which helps me tailor my content for better reach. I appreciate how Kalodata continuously updates its features to enhance user experience.
If you're looking to elevate your TikTok game and gain valuable insights, I highly recommend giving Kalodata a try. It has certainly transformed the way I approach my content strategy!
#content strategy#engagement rates#analytics dashboard#TikTok#audience engagement#performance metrics
0 notes
Text
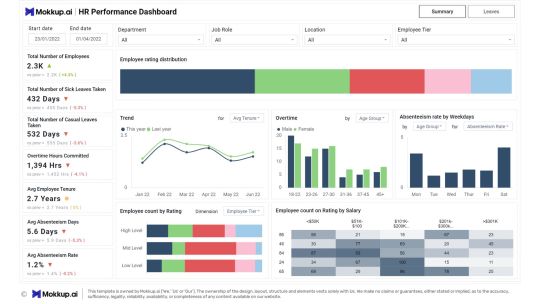
HR Performance dashboard done in under 30 mins on Mokkup.ai.
#dashboard simulator#dashboard#dashboards#data#visualization#datascience#data analytics#powerbi#tableau#hr#recruitment
1 note
·
View note
Text
Broadcasting Your Team's Pipeline

Regardless of whether your business provides products or services, finding a way to both evaluate and motivate your sales team can be challenging. Even those who have invested in modern CRM platforms such as Salesforce may still use legacy platforms and processes... by choice or without knowledge of a leading-edge solution which comes standard. If it's the latter, the good news is that making the change to an automated (and much more visually appealing) application is neither complex or time-consuming. In fact, it takes only the will to make the switch and after just days of migrating from classic-to-2.0 you may catch yourself saying 'how did we ever manage this the old way'. Taking Stock Be it a spreadsheet, cheat sheet or baking sheet, if you are consistent in your method when holding your recurring sales team sessions you're well ahead of the game as consistency is half the battle. Where the campaign is lost is in the vanishing hours of productivity during the preparation before your meetups or daily sprints in updating records or replacing last week's charts with the latest report. Though it may take effort in which to manually take stock and assemble your 'analytics', you've tackled the tough part. On the other hand, if your team sessions are in need of organization, initiating and agreeing on a process takes only a few steps and need only be tedious if you choose it to be. Salesforce, for example already has all of the tools you need by taking advantage of Custom Objects, Kanban and Agile/Scrum, allowing you to essentially run your meetings via the browser. Boring Repels Let's assume for the moment that your enterprise is using at least a basic process to run your sales targeting sessions. It might not be visually attractive, but it works. If you are presenting to your sales team audience the information within a tabular or spreadsheet-style, the message will be heard, but could be diluted within the numbers and letters. Worse still, if the source of the information presented in your spreadsheet is from an exported report from your CRM, you are creating more work with a mediocre experience.

So how do you get some rapid traction? Simple... use the data that you already have from your Opportunities IN Salesforce, not exported FROM Salesforce. You already know the power of reports and dashboards in your CRM... why not give 'em a prominent place at your next team's session? Productivity and Motivation Going further, some internal sales teams have used a 'display all' approach by using a sales Command Center dashboard and showcasing in on a monitor. This not only benefits the management, but also the individual sales hunters who may not always access their own performance metrics (which is as it should be as they are busy focusing on business). By broadcasting your team's goals and achievements, there is full transparency to how the group is performing, be it closed-won business or the month's pipeline. And it does't just need to include Sales, but also Service... basically any data element where you want to track performance, quotas / goals or segmentation of records is tailor-suited for this purpose. Should your team congregate in the same office, highlighting your dashboard on a monitor showcases the team's progress, and can also be a source of motivation. Utilizing this approach, you can also create contests, leaderboards and competitions tied to revenue goals which can be regularly updated on your large-screen monitor. When setting this up, be sure that your source account is always logged-in, which can be accomplished with a regular refresh cadence. This can be done by utilizing a browser extension such as Enhance Salesforce Dashboard which accomplishes this task, while auto-refreshing the dashboard ensuring that your data is regularly updated without the need to log back in each day (or hour). You have spent time and effort in educating your team on the use of Salesforce. Using this alternative in highlighting your analytics' live can give your team a sense of motivation and teamwork with less admin work.
__________________________________________________________________________________________ Title image by Newsweek | Analytics by BP Squadron
#sales#marketing#service#crm#salesforce#legacy#spreadsheet#analytics#dashboard#agile#kanban#scrum#sprint#motivation#command center#monitor#television#broadcast#pipeline
0 notes
Text
Graphy.app Data Visualization Made Easy (and Fast!)
Stop struggling with data! Graphy.app makes creating beautiful, impactful graphs a breeze. See how easy it is!" #datavisualization #graphs #dataanalysis #graphyapp #productivity #businesstools #analytics
Don't forget to like, comment, and subscribe for more AI content!
#impactful graphs a breeze. See how easy it is!"#datavisualization#graphs#dataanalysis#graphyapp#productivity#businesstools#analytics#Don't forget to like#comment#and subscribe for more AI content!#“data visualization”#“graph maker”#“create graphs”#“data analysis tools”#“chart maker”#“easy data visualization”#“online graph maker”#“ai graph generator”#“data visualization software”#“business graph maker”#“data reporting tools”#“interactive graph maker”#“data dashboard tools”#“graph creation online”#“data presentation tools”#“google sheets graph integration”#“notion graph integration”#“business intelligence tools”#“analytics software”
0 notes