#Weekly Gold Oil Analysis
Explore tagged Tumblr posts
Visit Tumblr Blog
Explore Tumblr blogs with no restrictions, modern design and the best experience.
Last Seen Tumblr Blogs


Fun Fact
Tumblr’s reach among the 26-to-35-year-olds in the US is 11%.
Text
#Posted inCommodity#GOLD#Natural Gas#SILVER (XAGUSD)#WTI#WTI CRUDE OIL#XauusdTags:Commodity#COMMODITY ANALYSIS#commoditytrading#economy#finance#Forex#forex trading#Gold (XAU/USD)#Gold (XAUUSD)#Gold (XAUUSD)UPCOMING WEEK PRICE FORECAST#GOLD ACCOUNT MANAGEMENT#Gold and#Natural Gas Forecast#investing#WEEKLY GOLD (XAUUSD) VIEW#Weekly Gold Analysis#Weekly Gold Oil Analysis#CrudeOil Weekly Forecast#Wti analysis#WTI Crude#WTI Crude Oil#Weekly Forecast#WTI CRUDE OIL TECHNICAL ANALYSIS
0 notes
Text
What to expect from the stock market this week

Last week, the review of the macro market indicators saw with October in the books and heading into the election and FOMC meeting, equity markets experienced a Halloween spooking. Elsewhere looked for Gold ($GLD) to continue its uptrend while Crude Oil ($USO) consolidated at the bottom of a broad range. The US Dollar Index ($DXY) looked to consolidate in its uptrend while US Treasuries ($TLT) pulled back in their consolidation. The Shanghai Composite ($ASHR) looked to continue the short term move higher while Emerging Markets ($EEM) pulled back in their uptrend.
The Volatility Index ($VXX) looked to remain at a neutral level, above the base established this year, and was likely to stay there at least until after the election. This might make for choppy light trading for equity markets to start next week. Their charts looked strong on the longer timeframe though. On the shorter timeframe both the $QQQ and $SPY had reset momentum measures lower and could reverse or turn bearish, likely a couple of days’ time would tell. The $IWM did not seem concerned about an election or Fed policy, churning sideways.
The week saw major movements happen following the election. It played out with Gold pulling back from its high Wednesday before a partial recovery while Crude Oil found some strength and moved higher in a choppy range. The US Dollar jumped to a 4 month high while Treasuries fell back to a 5½ month low Wednesday before a recovery. The Shanghai Composite continued the move to the upside while Emerging Markets chopped in a wide range.
Volatility crashed down to the low end of the range since August. This put a stiff breeze at the backs of equities and they started to move up Tuesday and then accelerated Wednesday through the end of the week. This resulted in the SPY and QQQ printing a new all-time highs Wednesday, Thursday and Friday and the IWM gapping up to a 1 year high. What does this mean for the coming week? Let’s look at some charts.

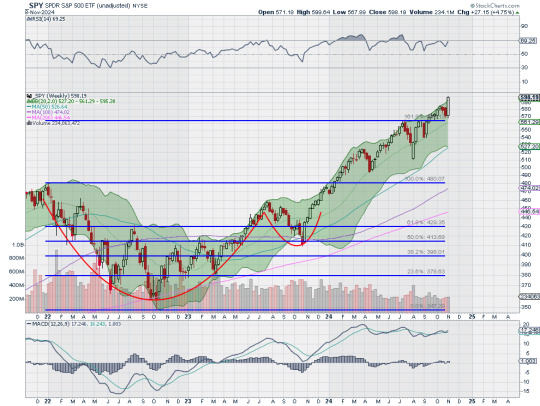
The SPY came into the week at the 50 day SMA on the daily chart in a pullback from the top. It had a gap left open from the end of the week. It held there on Monday and then started higher Tuesday, into the gap. It gapped up Wednesday to finish at a new all-time high and leaving an island below. It followed that up with new all-time highs Thursday and Friday. The Bollinger Bands® are open to the upside. The RSI is rising deep in the bullish zone with the MACD positive and rising.
The weekly chart shows a strong, long bullish candle rising from the 161.8% extension of the retracement of the 2022 drop. The 200% extension is now within view at 614 above. The RSI is rising near overbought territory in the bullish zone with the MACD drifting up and positive. There is no resistance above 599.60. Support lower sits at 585 and 580 then 574.50 and 571.50 before 565.50 and 556.50. Uptrend.
With the Presidential Election and November FOMC meeting in the rearview mirror, equity markets showed jubilation as they vaulted higher. Elsewhere look for Gold to in its uptrend while Crude Oil consolidates in a broad range. The US Dollar Index continues to move to the upside while US Treasuries consolidate in their pullback. The Shanghai Composite looks to continue the move higher while Emerging Markets chop in their short term uptrend.
The Volatility Index looks to remain low and drifting lower following the election making it easier for equity markets to continue higher. Their charts look strong on both timeframes, especially the SPY and QQQ. The IWM has now joined the party, a stone’s throw away from making its first new all-time high in 2 years. Use this information as you prepare for the coming week and trad’em well.
Join the Premium Users and you can view the Full Version with 20 detailed charts and analysis: Macro Week in Review/Preview November 8, 2024
44 notes
·
View notes
Text

The Yearly Oil Price Playbook: Why Most Traders Miss the Big Moves (and How You Won’t) Imagine staring at your chart on December 31st, sipping cheap champagne and wondering how you missed that juicy 1,500-pip swing in USD/CAD that started back in March—all because you ignored oil prices. Ouch. That’s not just a missed trade; that’s the Forex equivalent of showing up to a costume party in regular clothes. But hey, here’s the good news: you’re about to dive into the yearly oil price narrative that seasoned traders follow religiously—while most retail traders dismiss it like a gym membership in February. Crude Truth: Oil Prices Drive Currencies (More Than Most Realize) Oil isn’t just black gold; it’s liquid leverage. Many traders forget that oil prices aren’t just a commodities play—they’re a currency whisperer. Currencies like the Canadian Dollar (CAD) and Norwegian Krone (NOK) practically blush when oil flirts above $90 a barrel. Yearly oil price patterns often map perfectly to strength or weakness in oil-sensitive currencies. Miss the oil narrative, and you’re basically trying to trade with half a chart. "Ignoring oil trends while trading CAD is like ignoring gravity while skydiving." — Linda Raschke, veteran trader The Hidden Formula Most Pros Use Here’s how top traders think about oil annually: - Q1 Spike Theory: Winter demand (and political tension season) often lifts oil prices. - Q2 Supply Glut Dip: Inventories build, demand softens—hello, pullback. - Q3 Recovery: Hurricane season, travel spikes, and OPEC drama push prices. - Q4 Showdown: Year-end positioning, tax-loss harvesting, and real-world geopolitics create fireworks. 2024 Example: Oil bottomed in February and peaked in late September. If you aligned your USD/CAD swing trades with this narrative, you rode the wave like a pro surfer with a Bloomberg terminal. Why Most Traders Miss It (And How to Avoid Their Mistake) Most retail traders treat oil like it’s someone else’s problem. "I trade EUR/USD," they say. Cool. But do you realize how many global inflation narratives are triggered by oil spikes? Or how central banks adjust rate expectations based on energy shocks? According to the EIA, a $10 increase in oil prices can shave off 0.2% of global GDP. That’s enough to panic a central bank faster than you can say "rate hike." Common Pitfalls: - Trading CAD/JPY without checking oil inventory data. - Ignoring seasonal patterns. - Not using long-term charts to see where oil is headed annually. Quick Fix Checklist: Yearly Oil Price Levels: The Secret Support and Resistance Zones Here’s where it gets ninja. Top institutional traders map yearly oil levels into their FX analysis. You’ll hear them talk about the $62 "institutional floor" or the $94 "liquidity magnet." How to Use This: - Map last 3 years of yearly highs/lows. - Calculate average yearly price. - Drop those lines on your chart. - Trade FX pairs off those levels like it’s your job (because it is). Pro Tip: Combine this with Fibonacci extension zones and you’ll be spotting pivots like a clairvoyant economist. The Counterintuitive Insight: Oil Volatility Matters More Than Direction Here’s the truth bomb: most traders obsess over where oil is headed. Smart traders care more about how fast it gets there. A study by the Bank for International Settlements (BIS) found that oil volatility explains nearly 40% of CAD/USD fluctuations during high-tension years. So instead of asking, "Is oil bullish?" ask: "Is oil getting erratic?" Why This Matters: - High oil volatility = wider Forex ranges. - You can catch mean-reversion plays like USD/CAD snapbacks. - It affects bond yields and interest rate projections. Track it using OVX (Oil Volatility Index). If it spikes, rethink your stops. That’s not a trade; that’s a tripwire. Step-by-Step: How to Trade Forex Using Yearly Oil Trends Here’s the ninja flow: - Plot Oil’s Annual Trend: Use weekly candles. Identify quarterly inflection points. - Pair It with the Right Currency: CAD, NOK, MXN. - Look for Divergences: If oil is rising and CAD is falling, something’s off. - Confirm with Fundamentals: Rate decisions, CPI, or OPEC minutes. - Trigger Entry Using TA: Use RSI, MACD, or trendlines to fine-tune entries. Bonus: The Forgotten Trick That Saved Me in 2022 Quick story: Back in 2022, oil was tanking mid-year. Everyone was shorting CAD. But I spotted a sharp spike in OVX and a divergence with WTI futures. Took a contrarian long on CAD/CHF with a tight SL. Result? +370 pips in 3 days. Moral of the story: Sometimes the best trades are the ones that feel like they came from the upside-down. But they make sense when you understand the underlying mechanics. Your Yearly Oil Price Toolkit Want to stay ahead of the curve? Don’t trade blind. Use these StarseedFX resources: - Daily Forex News – Real-time market movers and updates. - Free Trading Journal – Track how oil influences your trades. - Smart Trading Tool – Auto-calculate exposure when oil volatility spikes. - Forex Courses – Learn how oil and currency cycles intersect. - Join Our Community – Get alerts when oil enters high-probability reversal zones. Let’s Wrap It Up (With No Clichés, Promise) If you want to dominate the Forex game, stop treating oil like background noise. It’s not. It’s the secret DJ remixing your entire playlist. Remember: - Yearly oil trends shape entire currency trajectories. - Volatility, not just direction, drives trades. - Institutional oil levels act like magnets on FX charts. You now have the keys. Just don’t leave them in the ignition while oil prices go for a joyride. —————– Image Credits: Cover image at the top is AI-generated Read the full article
0 notes
Text
Weekly Market Outlook: Gold, EURUSD, Oil
Key Trends in Gold, EUR/USD, and Crude Oil
Financial markets have been experiencing heightened volatility, driven by a mix of economic data releases, central bank policies, and geopolitical developments. Investors are closely monitoring the direction of the U.S. dollar, interest rate expectations, and commodity supply-demand dynamics, all of which are influencing asset prices.
Gold, a traditional safe-haven asset, has seen sharp price swings as traders react to shifting inflation expectations and Federal Reserve policy signals. Meanwhile, the EUR/USD pair has strengthened, driven by eurozone economic resilience and speculation about the Fed’s next moves.
In the commodities market, crude oil has also witnessed a turbulent trading environment, with supply-side concerns from OPEC+ and inventory fluctuations in the U.S. playing a key role. This commentary provides an in-depth technical and fundamental analysis of these assets, offering insights into potential future movements and key levels to watch. All times mentioned in this report are in BST.
Gold (XAU/USD): Volatility and Consolidation
Gold has witnessed significant fluctuations, rallying to a high near $2,935 before facing a steep decline to $2,887. This sharp drop reflects profit-taking and shifting sentiment regarding global macroeconomic conditions.
The recent recovery has stabilized prices around $2,896, indicating potential consolidation. From a technical perspective, the $2,902 - $2,905 range remains a key short-term resistance zone. A decisive breakout above this level could pave the way for a retest of $2,920 - $2,935.
However, a failure to hold above $2,885 may expose downside risks towards $2,875 and potentially lower.

XAUUSD H1
Fundamentally, the strength of the U.S. dollar and treasury yields continues to influence gold's price action. A stronger USD could weigh on gold, while a dovish Fed outlook may provide support.
The CME FedWatch Tool suggests shifting expectations regarding interest rate cuts, which could influence gold prices. Inflation data and central bank policies remain key drivers, as persistent inflation would likely boost gold’s appeal as a hedge. Additionally, geopolitical risks could play a significant role in increasing demand for safe-haven assets like gold, particularly in times of uncertainty.
EUR/USD: Bullish Momentum with Resistance Ahead
The EUR/USD pair has demonstrated strong bullish momentum, surging from 1.038 to a recent high of 1.051 before meeting resistance. The euro's strength has been supported by improving Eurozone economic data and shifts in U.S. rate expectations.
Technically, the pair is consolidating around 1.0488, with key resistance at 1.0510. A breakout above these levels could open the door for a move towards 1.055, while a break below 1.046 might trigger a pullback towards 1.042 - 1.038.

EURUSD H1
Fundamentally, the EUR/USD pair's direction remains heavily influenced by U.S. dollar dynamics and Eurozone economic performance. A weaker USD has fuelled the rally, but upcoming U.S. economic data releases could shift momentum.
The divergence in monetary policy outlooks between the European Central Bank (ECB) and Federal Reserve will likely play a crucial role in determining the next move. Strong economic data from the Eurozone could push the euro higher, while weaker figures may expose it to downside risks. Additionally, inflation trends and labour market conditions in both regions will be closely watched for clues about future central bank decisions.
Crude Oil (WTI): Recovery After Sharp Decline
WTI crude oil has exhibited increased volatility, with prices dropping from $72.50 to a low of $70.20 before bouncing back to $71.06. This recovery suggests that buyers are stepping in at key support levels, but the upside remains limited by resistance near $71.30 - $71.50. Technically, if bullish momentum continues, oil could push towards $72.00 - $72.50.
Conversely, if sellers regain control, prices may revisit $70.50 - $70.20, with a potential downside extension to $69.80.

USOILRoll H1
Fundamentally, oil prices remain sensitive to both supply-side and demand-side factors. OPEC+ production decisions continue to impact price movements, with any signals of production cuts likely to provide support.
U.S. inventory levels, as reported in weekly Energy Information Administration (EIA) data, will be crucial for determining short-term price direction. Rising inventories could pressure prices lower, while signs of supply tightness may push oil higher.
Additionally, broader macroeconomic trends and global demand expectations will play a pivotal role in shaping crude oil’s trajectory, as a stronger economic recovery could boost demand, while concerns about slowing global growth may weigh on prices.
Key Technical Levels to Watch
· Gold (XAU/USD): Resistance at $2,905, $2,920, and $2,935. A breakout above $2,935 could signal further bullish momentum, particularly if economic uncertainty drives safe-haven demand. Support sits at $2,885, $2,875, and $2,860. A drop below $2,875 may indicate increased selling pressure, potentially pushing gold toward lower support levels.
· Crude Oil (WTI): Resistance at $71.30, $72.00, and $72.50. A sustained move above $72.00 could indicate renewed buying interest, driven by supply-side constraints or improved demand outlooks. Support levels are at $70.50, $70.20, and $69.80. A break below $70.20 might expose crude to further losses, with $69.80 serving as a critical support level.
· EUR/USD: Resistance at 1.0510, 1.0530, and 1.0550. A break above 1.0530 could pave the way for further gains, particularly if ECB policy rhetoric turns more hawkish. Support is found at 1.0460, 1.0420, and 1.0380. A move below 1.0420 would reinforce bearish momentum, opening the door for a test of lower support levels.
Forward-Looking Considerations:
· Gold (XAU/USD): A break above $2,920 could push prices towards $2,935, supported by geopolitical tensions or dovish Fed commentary. Failure to hold above $2,885 could indicate increased bearish momentum, potentially driving prices toward $2,875 and beyond.
· EUR/USD: The pair’s next move will depend on upcoming inflation data and ECB rhetoric. A stronger euro could target 1.0550, but renewed USD strength could push the pair back toward 1.0420.
· Crude Oil: WTI’s ability to break past $72.50 depends on supply constraints and demand outlooks, while a failure to hold $70.20 may accelerate selling pressure toward $69.80. Traders should monitor OPEC+ announcements and U.S. inventory reports closely.
Traders should stay vigilant, as upcoming economic data releases and central bank commentary will be key drivers of market volatility and asset price movements.
Disclaimer:
The information contained in this market commentary is of general nature only and does not take into account your objectives, financial situation or needs. You are strongly recommended to seek independent financial advice before making any investment decisions.
Trading margin forex and CFDs carries a high level of risk and may not be suitable for all investors. Investors could experience losses in excess of total deposits. You do not have ownership of the underlying assets. AC Capital Market (V) Ltd is the product issuer and distributor. Please read and consider our Product Disclosure Statement and Terms and Conditions, and fully understand the risks involved before deciding to acquire any of the financial products provided by us.
The content of this market commentary is owned by AC Capital Market (V) Ltd. Any illegal reproduction of this content will result in immediate legal action.
0 notes
Text
Bitcoin’s Surge Towards $108K: The New Gold Standard in Crypto?
Key Points
Bitcoin’s price is predicted to reach $108K as its value surpasses that of gold.
Bitcoin ETFs are expected to surpass gold amid rising institutional interest.
Bitcoin has hit a new all-time high, with the total market cap of the cryptocurrency peaking at $3.67 trillion. As buying pressure continues to increase, experts anticipate further growth into uncharted price levels.
Meanwhile, other cryptocurrencies, such as Ethereum, are also gaining momentum, with Ethereum’s price exceeding $4,000. As the bullish pressure mounts, the price gap between Bitcoin and gold continues to widen.
Bitcoin’s Worth Surpasses Gold
With Bitcoin recording a new all-time high, the Bitcoin-to-gold ratio has also reached a new peak. The ratio currently stands at 40.04, indicating that nearly 40 ounces of gold are required to purchase a single Bitcoin.
Independent chart trader, Peter Dant, highlighted the new all-time high for the Bitcoin-to-gold ratio in a recent tweet. The significant rally and short-term surge have resulted in a price increase of over 10% in the past five days.
Dant’s chart analysis suggests that the Bitcoin-to-gold ratio could potentially reach 89.33 in the future. This implies that a single Bitcoin could be worth 89 ounces of gold, underscoring its rising dominance over traditional assets.
Bitcoin ETFs Outperform Gold
HODL 15 Capital recently shared that BlackRock’s iShares Bitcoin ETF (IBIT) has become the second-best-performing US ETF. This milestone further validates institutional interest in Bitcoin as an asset class.
With assets under management (AUM) worth $54.983 billion, IBIT has surpassed the iShares Gold Trust, which manages $34.205 billion. Second only to SPDR Gold Shares (GLD), with an AUM of $75.535 billion, IBIT has grown by an impressive 117.5% year-to-date. This reflects Bitcoin’s emergence as a preferred investment over traditional gold-backed ETFs.
The total net assets under the 12 US spot Bitcoin ETFs have reached $114.97 billion, with a weekly net inflow of $2.17 billion. This continuous inflow highlights the increasing confidence in Bitcoin ETFs among institutional investors.
In a recent interview, former President Donald Trump announced plans to create a Bitcoin strategic reserve, comparing it to the US oil reserve. This initiative is part of a broader effort to position Bitcoin as a strategic asset.
Bitcoin’s Price Predicted to Reach $108K
Bitcoin’s price trend in the 4-hour chart shows a growing rally within a rising channel pattern. Despite a bearish reversal from the overhead trendline, Bitcoin’s price is still struggling for a breakout rally.
At present, Bitcoin’s price is forming a bearish 4-hour candle after nine consecutive bullish candles. Despite the short-term supply surge near the trendline, the positive trend in the MACD and signal reveals underlying strength.
Moreover, continued support from the ETFs could fuel the bull run. In such a case, a breakout rally could reach the R1 pivot resistance level at $108,301. On the other hand, the crucial support level at $101,275 remains strong.
0 notes
Text
Goldbach x ICT Trader and the author of the Golden Bullet Trading Strategy Join exclusive mentorship program to: Learn my Goldbach Golden Bullet trading strategy for Forex and Index Futures (EURUSD, GBPUSD, NASDAQ, S&P500, DOW, Crypto, Gold, Silver, Oil) Access my training course covering Goldbach trading, mindset, and risk management. See my weekly analysis videos allowing you to determine the bias and gameplan for the coming week Study my detailed trade breakdown videos so you can learn to trade like me.
0 notes
Link
Welcome to our weekly market analysis from forexcracked.com! Here, we cover the major forex pairs, important commodities like gold, silver, and oil, and major cryptocurrencies like BTC and ETH. This analysis focuses mainly on price action trading. Before we continue with the analysis, if you don't know much about trading, charts, candlesticks, risk management, or strategies, or if you want to improve your knowledge, consider reading our free forex course. Upcoming Events for This Week These events include macroeconomic reports, economic indicators, and, generally, what's going on in the world. Only the most important events are considered here. You can check the forexfactory.com for all the economic events and yahoo finance for news. 22/7/2024 There are no important events scheduled for thjs day. 23/7/2024 There are no important events scheduled for this day. 24/7/2024 09:45 ET, the Bank of Canada will announce its monetary policy update. Currently, the country's interest rate stands at 4.75%, with expectations for a potential cut to 4.5% in this meeting. This event could cause high volatility for CAD pairs. 10:30 ET, the Bank of Canada will hold a press conference. During the Q&A session, we might receive hints about future interest rate changes, which could affect CAD pairs. 25/7/2024 8:30 ET, the US will release its Advance GDP quarter-over-quarter report. This data, reported in an annualized format (quarterly change multiplied by four), includes three versions released a month apart: Advance, Preliminary, and Final. The Advance release is the earliest and typically has the most impact. 26/7/2024 8:30 ET, the US will release its PCE Price Index month-over-month, a key inflation gauge used by the Fed. This event often brings volatility to USD pairs. Forex Market Analysis EURUSD: EURUSD is currently in an uptrend, pulling back from the resistance at 1.09600 and resting near the support level of 1.08750. If the price breaks below this support, further declines to the next support level are anticipated. Conversely, a bounce from this support and a move above the resistance would indicate the uptrend is intact and continuing its course. USDJPY: USDJPY has broken its significant support and is now in a downtrend. On the hourly chart, there was consolidation before another drop. The next support is around the 155 level, where we might see a pause or a bounce. If this level is breached, further downside towards 152 could be expected. Conversely, a breakout above resistance would indicate potential upward momentum in the trend. GBPUSD: GBPUSD is in an uptrend, currently retracing from the resistance level at 1.30000 and hovering near the support at 1.29000. If the correction concludes and the price resumes its upward movement, we anticipate a reversal around this support with a break above the resistance. However, if the price breaks below this support, it could indicate either a continuation of the correction or a shift to a downtrend, leading to potential further declines. USDCHF: USDCHF is currently in a downtrend, having retraced from support near 0.88200 and approaching resistance at 0.89000. If the price breaks above this resistance, further upward movement towards the next resistance levels can be anticipated. However, given the bearish trend overall, we might see the price decline from this resistance and return towards 0.88200. USDCAD: USDCAD has broken a significant support, indicating a downtrend. However, after reaching a support level, the price has retraced and is now at the previously broken support, which is now acting as resistance. If the breakout holds true and USDCAD remains in a downtrend, we expect the price to decline from this resistance level. On the other hand, if the price breaks above this resistance and continues upward, it suggests a potential reversal in the trend to an uptrend. AUDUSD: AUDUSD reached resistance around 0.68000 and has since begun to decline. It broke through the support near 0.67000 and is now heading towards the 0.05800 level. Keep an eye out for any potential breakouts. NZDUSD: Similar to AUDUSD, NZDUSD has broken below the support at 0.60500 and is now heading towards 0.59000. There's a support level around 0.59500 where the price may pause or pull back; if not, it could continue its downward movement. Keep an eye out for any potential breakouts. Commodities Market Analysis GOLD: Gold reached a peak around 2480 before beginning to decline, breaking support levels on its way down. Currently, it has found support around the 2400 level and is consolidating. If the price breaks below this support, we anticipate further declines. Alternatively, a reversal could occur around this support, pushing the price higher. Keep an eye out for signals of both reversal and breakout. SILVER: Looking at silver, it's currently at a support level of 28.500. If the price breaks below this level, we might see further declines. Conversely, the price could also rebound from this level and begin to rise. Keep an eye out for signals indicating both a potential reversal and breakout. CRUDE OIL: Oil is currently in a downtrend. After a correction, it encountered resistance around 88.000 and has resumed its downward movement. The price is currently just above a support level of 81. If the price breaks below this level, we anticipate further declines toward the 78 range. However, there's also a possibility of a pullback, with a chance of a breakout. Be prepared for both scenarios. Cryptocurrency Market Analysis BTC: BTC, after dropping and causing uncertainty, has finally resumed its upward momentum. Currently, the price is above 67K, and we anticipate it to continue rising further. ETH: ETH is currently near its support level of 3500, with the next resistance around 3680. We anticipate the price to rise toward this resistance level. If it breaks above, we expect further upward movement. Conversely, if it breaks below, the price may continue in that direction. BNB: BNB is also showing similar momentum, as cryptocurrencies are correlated. BNB is approaching resistance around 630. Conclusion & Disclaimer This analysis article isn't about telling you when to buy or sell. It's about teaching you how to approach the market effectively. Every day, I follow the same routine before I start trading. Here, I briefly explained the technical aspects of what's happening and what actions I take in these situations. Your goal is to understand what I do so you can follow the same process on your own. The market can change its behavior without notice, so it's best to analyze it every day. The ForexCracked version covers all the important assets in details for the week in one article. Meanwhile, the xlearn version focuses more on daily analysis for day traders. If you want to follow daily analysis for Forex, US Stocks & Cryptocurrencies check out this section on xlearnonline.com Please provide your feedback in the comment section below on how we can further improve our market analysis. Thank you. It's crucial to acknowledge the inherent unpredictability of financial markets. While we strive to offer informed perspectives on upcoming events and trends affecting various instruments, it's important for readers to conduct their own analysis and exercise prudent judgment. Encouragement of Independent Analysis We strongly encourage readers to supplement the information presented here with their own research and analysis. Market dynamics can swiftly change due to a multitude of factors, and individual circumstances may vary. By conducting independent analysis, readers can tailor their strategies to align with their unique goals and risk tolerance. No Certainty in Market Predictions It's vital to recognize that nobody possesses the ability to predict market movements with absolute certainty consistently. Market analysis serves as a tool to assess probabilities and identify potential opportunities, but it's essential to remain cognizant of the inherent uncertainty in financial markets. Aligning with High Probability Rather than aiming for infallible predictions, our goal is to align with high-probability scenarios based on available information and analysis. This approach acknowledges the dynamic nature of markets while seeking to capitalize on opportunities with favorable risk-reward profiles. Proceed with Caution Lastly, while market analysis can offer valuable insights, it's imperative to approach trading and investment decisions with caution. Markets can be volatile, and unforeseen events may impact asset prices unexpectedly. Exercise prudent risk management and consider seeking advice from qualified financial professionals before making any significant financial decisions. Remember, the journey of financial analysis and investment is a continuous learning process, and embracing a disciplined approach can contribute to long-term success in navigating the complexities of global markets. THANK YOU & HAPPY TRADING FROM FOREXCRACKED!!! 😍😍💸🤘 Get Premium EA and indicators ,lessons strategies free everyday ✅💸 Link in Bio 💸#forex #forexea #forexexpert #forexexpertadvisor #forexexpertadvisorsfree #forexcracked #freeforexsignals #freeforexearobot #forexrobot #forextrading #forexeducation #forextraders #forextrade #freeforex #forexindicator #forexstrategies
0 notes
Text
Gold and silver prices have experienced slight increases recently as Market charts show a bullish trend. Investors are keeping a close eye on these precious metals as they navigate economic uncertainties. Click to Claim Latest Airdrop for FREE Claim in 15 seconds Scroll Down to End of This Post const downloadBtn = document.getElementById('download-btn'); const timerBtn = document.getElementById('timer-btn'); const downloadLinkBtn = document.getElementById('download-link-btn'); downloadBtn.addEventListener('click', () => downloadBtn.style.display = 'none'; timerBtn.style.display = 'block'; let timeLeft = 15; const timerInterval = setInterval(() => if (timeLeft === 0) clearInterval(timerInterval); timerBtn.style.display = 'none'; downloadLinkBtn.style.display = 'inline-block'; // Add your download functionality here console.log('Download started!'); else timerBtn.textContent = `Claim in $timeLeft seconds`; timeLeft--; , 1000); ); Win Up To 93% Of Your Trades With The World's #1 Most Profitable Trading Indicators [ad_1] Gold and silver prices are showing a slight increase in early U.S. trading on Friday. Silver is nearing its three-year high achieved in April, attracting speculators towards long positions in both precious metals. The June gold price is up $6.10 at $2,391.60, while July silver is up $0.089 at $29.965. Stock indexes in Asia and Europe mostly saw gains overnight, with U.S. stock indexes expected to open slightly higher after hitting record highs on Thursday. The Euro zone's April consumer price index rose by 2.4% year-on-year, meeting Market expectations. China has taken steps to support its struggling property sector, including a 300 billion yuan relending facility for affordable housing. This news led to a rally in China property stocks. Additionally, China saw positive economic data with a 6.7% year-on-year increase in April industrial output. Comex copper futures hit a record high above $5.00 a pound this week, fueling talk of a potential "short squeeze." Market reports suggest that copper prices have outpaced demand, leading to supply disruptions and speculation in base metals trading. In the Market today, the U.S. dollar index is up, while Nymex crude oil prices are slightly lower at around $79.00 a barrel. The 10-year U.S. Treasury note yield stands at 4.38%. Economic data to be released includes leading economic indicators. Technically, gold futures show a strong near-term bullish trend, with the next upside target at $2,448.80. Silver futures also exhibit bullish momentum, targeting a close above $30.19. Traders can expect continued Market analysis and forecasting in the upcoming "Markets Front Burner" weekly email report. Please note that the views expressed in this article are the author's own and may not reflect those of Kitco Metals Inc. Accuracy of information is not guaranteed, and this article is for informational purposes only. Trading decisions should be made based on individual analysis and risk assessment. Win Up To 93% Of Your Trades With The World's #1 Most Profitable Trading Indicators [ad_2] 1. What is the current price trend for gold and silver? Both gold and silver are experiencing modest price gains as charts show a bullish trend. 2. Should I consider investing in gold and silver right now? The charts suggest that now could be a good time to consider investing in gold and silver. 3. Will the price of gold and silver continue to rise? While nothing is certain, the bullish charts indicate that the price of gold and silver may continue to increase. 4. How can I buy gold and silver? You can buy gold and silver from reputable dealers, online platforms, or through exchange-traded funds (ETFs). 5. Are there any risks associated with investing in gold and silver? Like any investment, there are risks involved in investing in gold and silver, so it's important
to do your research and consider speaking with a financial advisor before making any decisions. Win Up To 93% Of Your Trades With The World's #1 Most Profitable Trading Indicators [ad_1] Win Up To 93% Of Your Trades With The World's #1 Most Profitable Trading Indicators Claim Airdrop now Searching FREE Airdrops 20 seconds Sorry There is No FREE Airdrops Available now. Please visit Later function claimAirdrop() document.getElementById('claim-button').style.display = 'none'; document.getElementById('timer-container').style.display = 'block'; let countdownTimer = 20; const countdownInterval = setInterval(function() document.getElementById('countdown').textContent = countdownTimer; countdownTimer--; if (countdownTimer < 0) clearInterval(countdownInterval); document.getElementById('timer-container').style.display = 'none'; document.getElementById('sorry-button').style.display = 'block'; , 1000);
0 notes
Text
On October 6, Greg Cipolaro, Global Head of Research at NYDIG, a subsidiary of Stone Ridge that “delivers Bitcoin products across industries, from banking and insurance to fintech and nonprofits,” published NYDIG’s latest weekly research report. Bitcoin’s Resilient Performance: NYDIG’s Observations Cipolaro reports that Bitcoin’s price fell by 11.1% during the quarter. Despite this decline, it has managed to maintain its status as the top-performing asset for the year, with a 63.3% year-to-date increase. Cipolaro notes that Bitcoin has been trading within a narrow range of $25K to $31K, resisting any significant price movements even amid various macroeconomic changes and legal developments. The Broader Asset Landscape: NYDIG’s Take Cipolaro points out that Bitcoin wasn’t the only asset to experience a downturn in Q3. Nearly every other asset class, including stocks, bonds, gold, and real estate, also declined. Factors such as high inflation, rising rates, and recession worries contributed to these trends. However, commodities were an exception, with oil prices rising due to production cuts by OPEC+ countries. Year-to-Date Asset Performance: NYDIG’s Analysis Despite the quarterly performance, Cipolaro emphasizes that Bitcoin continues to outperform other asset classes year-to-date. While stock market indices have dipped from their July highs, they are still up for the year. Bonds have faced challenges due to higher interest rates and inflation, with some gaining and most losing. Long-term US Treasuries have been the poorest performers, impacted by duration risk and credit warnings. The SEC and Bitcoin ETFs: NYDIG’s Perspective Cipolaro observes that the SEC has been delaying decisions on Bitcoin ETFs, even fast-tracking some postponements. This has occurred despite the legal win for Grayscale, which has put the SEC’s stance on spot ETFs under scrutiny. Legal Battles: Grayscale vs. SEC Through NYDIG’s Lens Cipolaro highlights the legal confrontation between Grayscale and the SEC, noting that the DC Circuit Court of Appeals ruled in favor of Grayscale. The SEC has until 13 October to appeal, and their next move is uncertain. Ethereum-Backed ETFs: A NYDIG Viewpoint Cipolaro reports that Ethereum futures-backed ETFs have been approved but have performed poorly, accumulating only $16.8 million in AUM. This performance raises questions about the viability of futures-based crypto ETFs. SEC’s Legal Challenges with Ripple and Others: NYDIG’s Insights Cipolaro discusses the SEC’s setbacks in its case against Ripple and notes that the outcome remains uncertain. He also mentions that the SEC’s legal actions against Binance and Coinbase are still in their early stages. Crypto-Related Equities: NYDIG’s Market Analysis Cipolaro states that crypto-related public equities struggled during the quarter. Crypto companies saw a 1.6% increase, primarily driven by Coinbase’s quarterly performance, while Bitcoin miners experienced a 22.4% decline. Featured Image via Pixabay
0 notes
Text
RT @TradersCom: Our Traders Market Weekly Analysis: NVidia, #AI and The Debt Celling Week That Was – What Lies Ahead? #PMI #Fed #Turkey #Korea #DXY #DebtCeiling $KRE Earnings $NVDA $LOW $BBY $COST $PANW $AZO Free Charts+ #stocks #VIX #Forex #oil #natgas #SPX #BTC📷 #gold https://t.co/xcw29IIMBZ
RT @TradersCom: Our Traders Market Weekly Analysis: NVidia, #AI and The Debt Celling Week That Was – What Lies Ahead? #PMI #Fed #Turkey #Korea #DXY #DebtCeiling $KRE Earnings $NVDA $LOW $BBY $COST $PANW $AZO Free Charts+ #stocks #VIX #Forex #oil #natgas #SPX #BTC📷 #gold https://t.co/xcw29IIMBZ — Patrick Rooney (@patrickrooney) May 23, 2023 https://platform.twitter.com/widgets.js from Twitter…
View On WordPress
0 notes
Text
What to expect from the stock market this week
Last week, the review of the macro market indicators saw with the inflation reports behind us, equity markets showed strength with the SPY ending at an all-time high. Elsewhere looked for Gold ($GLD) to continue its uptrend while Crude Oil ($USO) consolidated in a broad range. The US Dollar Index ($DXY) continued to move to the upside while US Treasuries ($TLT) consolidated in their downtrend. The Shanghai Composite ($ASHR) looked to reverse lower while Emerging Markets ($EEM) consolidate the start of an uptrend.
The Volatility Index ($VXX) looked to remain low making the path easier for equity markets to the upside. Their charts looked strong, especially the $SPY and $QQQ on the longer timeframe. On the shorter timeframe both the QQQ and SPY were now ready to resume the move higher. The $IWM looked a bit less powerful but was holding near resistance, a good show of relative strength for the small caps.
The week played out with Gold chugging higher and ending at a new all-time high while Crude Oil fell back in the broad consolidation. The US Dollar met resistance at a lower high at the end of the week while Treasuries printed a Dead Cat Bounce after finding support Monday. The Shanghai Composite continued lower toward the September month end gap while Emerging Markets turned consolidation into a falling wedge.
Volatility drifted down to the lowest close of the month. This gave equities some breathing room and they rose to to start the week with the SPY printing a new all-time high Monday. All gave back some gains midweek before recovering to finish the week strong. This left the SPY back at the high, the QQQ near the October high and the IWM holding at nearly 3 year highs. What does this mean for the coming week? Let’s look at some charts.
SPY Daily, $SPY

The SPY came into the week at a new all-time high. It started off on the right foot making another one on Monday but ended out of the Bollinger Bands® on the daily chart. That led to a pullback on Tuesday and small reversal higher on Wednesday. Thursday broke higher as well with a gap up at the open, but it did not hold and then another gap up Friday held with the SPY ending at a new all-time high. The RSI is rising in the bullish zone with the MACD positive and climbing as those Bollinger Bands point higher.
The weekly chart shows a 6th consecutive move higher as it makes some separation from the 161.8% extension of the retracement of the 2022 drop. The RSI is making a higher high, negating a possible momentum divergence with the MACD crossed up and rising. There is resistance at 585 above. Support comes at 580 and 574.50 then 571.50 and 565.50 before 561.50 and 556.50. Uptrend.
SPY Weekly, $SPY

With the October Options Expiration in the books, equity markets showed some strength battling against a narrative of slower Fed cuts. Elsewhere look for Gold to continue its uptrend while Crude Oil drops in consolidation. The US Dollar Index may reverse the short term uptrend while US Treasuries pullback in consolidation. The Shanghai Composite looks to drop back from its spike while Emerging Markets stall in their move higher.
The Volatility Index looks to remain low making the path easier for equity markets to the upside. Their charts look strong, especially on the longer timeframe. On the shorter timeframe the SPY is leading the way higher with the QQQ slowly battling back to its high and the IWM poking its head up perhaps to make another attempt at a run higher. Use this information as you prepare for the coming week and trad’em well.
Join the Premium Users and you can view the Full Version with 20 detailed charts and analysis: Macro Week in Review/Preview October 18, 2024
48 notes
·
View notes
Text
e Untapped Potential of the Australian Dollar vs. Canadian Dollar: Position Trading Secrets for Weeks to Months The Australian Dollar (AUD) and Canadian Dollar (CAD) often fly under the radar, overshadowed by the flashy EUR/USD and GBP/USD pairs. But smart traders know that these commodity-linked currencies hold hidden gems for position trading (weeks to months)—if you know where to look. Most traders focus on short-term moves, glued to their screens like a caffeinated squirrel on a stockpile of energy drinks. But what if you could position yourself for bigger, longer-term moves—the kind that can rack up serious pips while you sleep? That’s where the AUD/CAD pair shines. Let’s break down how you can outsmart the market, leverage key fundamentals, and execute position trades that last for weeks or even months. Why AUD/CAD? The Overlooked Opportunity Most traders ignore AUD/CAD, assuming it lacks volatility. But that’s a myth. This pair is a sleeper hit, driven by powerful macroeconomic forces, including: - Commodity Prices & Trade Relationships – Both Australia and Canada are commodity powerhouses. AUD is tied to iron ore and gold, while CAD is oil-dependent. Their price movements often create tradeable divergences. - Interest Rate Differentials – The Reserve Bank of Australia (RBA) and the Bank of Canada (BoC) frequently take opposite stances on monetary policy, creating powerful trends. - Risk Sentiment & Global Growth – AUD tends to outperform in risk-on environments, while CAD benefits from strong oil prices. Understanding the shifts can help you time your trades. The Hidden Formula Only Experts Use Position traders need a framework that blends fundamentals, technicals, and macroeconomics. Here’s the step-by-step approach: 1. Fundamental Analysis: Predicting Long-Term Trends - Watch the RBA vs. BoC – Track interest rate policies and statements. - Follow commodity price cycles – Iron ore vs. crude oil trends give insight into relative strength. - Monitor economic indicators – Inflation, employment, and trade balance reports set the stage for long-term moves. - Pay attention to global risk sentiment – When equity markets surge, AUD usually gains. When oil rallies, CAD strengthens. 2. Technical Mastery: Catching the Right Entry & Exit - Use the 200-day moving average – A simple but effective trend filter. - Look for weekly chart patterns – Flag formations, breakouts, and trend channels work well for position trading. - Fibonacci retracements on the weekly timeframe – Identify key levels where big institutions step in. - Relative Strength Index (RSI) on a 14-week basis – Look for overbought/oversold signals. 3. Seasonal Patterns & Historical Data AUD/CAD follows seasonal tendencies, such as: - January to March – AUD often gains due to strong iron ore exports. - Summer months (June-August) – CAD strengthens alongside oil price spikes. - Year-end adjustments – Many institutions rebalance, creating price distortions. Ninja Tactics: How to Time Your Entries Like a Pro - The Carry Trade Factor – If AUD offers a higher yield than CAD, it attracts long-term buyers. Watch rate differentials. - Smart Scaling – Build positions gradually instead of all-in bets. Use ATR (Average True Range) to determine volatility-based entry sizes. - Sentiment Extremes – When the Commitment of Traders (COT) report shows extreme net positioning in AUD or CAD, a reversal could be near. Case Study: The 2023 AUD/CAD Trend Reversal In early 2023, AUD/CAD traded near 0.9100, after months of CAD outperformance. But smart traders noticed: - RBA signaling rate hikes while BoC paused. - Iron ore prices rebounding, strengthening AUD. - COT positioning at extreme short levels on AUD. The result? A powerful multi-month rally to 0.9600—a 500-pip move for patient position traders. Avoiding the Common Pitfalls - Ignoring Fundamentals – Position trading is not about staring at 5-minute charts. You need macroeconomic awareness. - Overleveraging – Since positions last weeks or months, use modest leverage to withstand fluctuations. - Skipping the Swap Rates – Holding a position long-term means paying (or earning) swaps. Check if they work in your favor. Final Thoughts: Is AUD/CAD Position Trading Right for You? If you prefer fast scalping, this isn’t your game. But if you enjoy capturing big-picture moves with less screen time, AUD/CAD is worth serious consideration. By blending fundamentals, technicals, and sentiment analysis, you can unlock profitable, multi-week trades without staring at charts 24/7. Want to sharpen your skills? Get exclusive insights, real-time economic indicators, and expert trading strategies at StarseedFX! —————– Image Credits: Cover image at the top is AI-generated Read the full article
0 notes
Text
Crude Oil Maintains the Gains as Markets Await US CPI. Will WTI go Higher?
Crude Oil, WTI, API, OPEC+, US Dollar, Gold, China Trade — Talking Points
Crude oil is claiming a recovery from a volatile run lower last week
APAC equities appear lacklustre with underwhelming Chinese economic data
Many asset classes have been relatively quiet ahead of US CPI. Will WTI rally?
WTI crude oil steadied again today just below US$ 73 bbl after recovering from last week’s sell-off that saw it trade at its lowest level since late 2021.
The American Petroleum Institute (API) will release its weekly statistical bulletin later today, ahead of the monthly OPEC+ oil market report that is due to be released on Thursday
Between those reports, US CPI on Wednesday remains the focus for the broader market.
Spot gold continues to trade above US$ 2,025 an ounce as markets recalibrate after last week’s hike by the Fed.
Treasury yields have eased a touch so far today after adding 7 or 8 basis points across the curve yesterday. The US Dollar is little moved with currency markets in slumber mode.
Wall Street finished barely moved despite lingering concerns around the debt ceiling and regional banking concerns.
APAC equity markets are mixed with Australian, Hong Kong, Korean and New Zealand indices slightly lower while Japan and mainland China have notched some gains.
China’s trade balance came in much stronger than forecast at US$ 90.2 billion for April rather than the US$ 71.25 billion anticipated.

China also announced a crackdown on foreign companies that it alleges have been spying.
It is shaping up to be a quiet day on the data front, but the Australian Federal Government budget will be delivered, where a surplus is anticipated for the first time in 15 years.
The full economic calendar can be viewed here.
WTI CRUDE OIL TECHNICAL ANALYSIS
WTI overcame breakpoint resistance in the 72.25–72.45 area overnight and that zone might now provide support.
Further support might be at the previous lows of 66.82, 66.12, 64.36, 63.64 and 62.43.

Chart created in TradingView
Written by Daniel McCarthy, Strategist for Daily FX
0 notes
Text
youtube
#Weekly Analysis!Gold Price Litecoin!SilverUSD Ethereum USD!Gold Price Technical Analysis!#The latest Financial update of the Cryptocurrency#Forex#and Commodities Prices. Technical analysis is the art of understanding market moves. In this video#you get crypto market Buy & Sell Trading Signals for Free.#Website Link - https://www.capitalstreetfx.com/en/#Facebook - https://www.facebook.com/CapitalStreetFX/#Telegram - https://www.t.me/CapitalStreetFx/#Instagram - https://www.instagram.com/capitalstreet_fx/#oil price forecast#weekly market review#weekly market recap#weekly market update#technical analysis for beginners#technical analysis#technical analysis of stocks#technical analysis course#market news live#market news#gold market news#gold price#gold price today#gold#gold news#gold forecast#silver price#silver price forecast#silver price analysis#coni#commodities news
1 note
·
View note
Text
Elliott Wave By Lara

Elliott Wave Analysis By Lara
Elliott Wave Analysis By Lara
Lara Iriarte CMT
Director & Chief Technical Analyst
Archives of Lara's Weekly Elliott Wave Gold Analyses. When you purchase a MotiveWave product via links on this website, you won't pay a penny more, but I'll get a small commission.

Lara’s Weekly: Elliott Wave and Technical Analysis of S&P500 and Gold and US Oil Charts – December 4, 2020. By Lara Gold, Lara's Weekly, S&P500, US Oil. S&P 500 An expected short-term pullback did not happen. Elliott Wave International is the world’s largest independent financial forecasting firm. We have guided our subscribers through major market and economic moves for over 40 years. The Elliott Wave Chart Site offers Elliott Wave Analysis and Forecasts for the DOW, Nasdaq, S&P 500,(SPX), Crude Oil, Natural Gas, Gold, Silver, HUI, EURO and the USD. Over years of Elliott Wave Forecasts and Analysis on the Web. The subscription price still remains the same, at $19.99 / month.
Lara is a Chartered Market Technician, a member of the CMT Association and a Registered Financial Advisor in New Zealand.
Lara is a long-time, successful financial markets analyst and entrepreneur. She has more than 10 years of experience providing Elliott Wave and Classic Technical Analysis of up to five markets a day.


As chief technical analyst for Elliott Wave Gold, Lara researches, analyses, and writes the Lara’s Weekly and Gold Plus reports.
Elliott Wave Analysis By Lara
Lara is also chief technical analyst for Elliott Wave Gold.
Lara’s is logical, objective, evidence focused, and her reports are clear and conscise.
Outside of analysing markets, Lara enjoys keeping active with surfing and traveling.
Cesar Iriarte
Elliott Wave Analysis By Lara
Publisher & Executive Editor
Cesar is a long-time, successful entrepreneur, publisher and professional investor and trader.
Cesar has more than 25 years of experience in the publishing industry, and as the executive editor for Elliott Wave Gold he manages and oversees the production and publishing of Lara’s Weekly and Gold Plus reports.
Cesar also leads Elliott Wave Gold’s long-term technology vision and manages Elliott Wave Gold’s publishing and information technology systems infrastructure.
He is also the publisher and executive editor for Elliott Wave Gold.
Cesar enjoys surfing and traveling, creating art and publishing books.

Jack Frost
Administration & Webmaster Assistant
Jack provides administration and webmaster assistance for Elliott Wave Gold and Elliott Wave Gold.
Jack is a qualified webmaster with CIW Web Design Professional and CIW E-Commerce Specialist certificates.
Jack is currently studying for a Bachelor degree in Audio Engineering at the Southern Institute of Technology in New Zealand.
1 note
·
View note
Link
Welcome to our weekly market analysis from forexcracked.com! Here, we cover the major forex pairs, important commodities like gold, silver, and oil, and major cryptocurrencies like BTC and ETH. This analysis focuses mainly on price action trading. Before we continue with the analysis, if you don't know much about trading, charts, candlesticks, risk management, or strategies, or if you want to improve your knowledge, consider reading our free forex course. Upcoming Events for This Week These events include macroeconomic reports, economic indicators, and, generally, what's going on in the world. Only the most important events are considered here. You can check the forexfactory.com for all the economic events and yahoo finance for news. 15/7/2024 12:00 ET: Fed Chair Powell Speaks. As the head of the central bank, which sets short-term interest rates, he has the most influence on the nation's currency value. This event will impact USD pairs. 16/7/2024 8:30 ET: Canada releases its CPI data, an important measure of inflation. This will cause volatility in CAD pairs. At the same time, the US is releasing its Retail Sales Report, which shows the change in the total value of sales at the retail level. This report will impact USD pairs. 18:45 ET: New Zealand releases its CPI data, which will impact NZD pairs. 17/7/2024 2:00 ET: England releases its CPI data, which will impact GBP pairs. 21:30 ET: Australia releases its Unemployment Rate report, giving an idea about the current state of their economy. This will impact AUD pairs. 18/7/2024 2:00 ET: England releases its unemployment claims report, which may cause volatility in GBP pairs. 8:15 ET: The Eurozone releases its Monetary Policy Statement, which will cause volatility in EUR pairs. 19/7/2024 2:00 ET: England releases its Retail Sales report, which may cause volatility in GBP pairs. 8:30 ET: Canada releases its Retail Sales report, which may cause some volatility in CAD pairs. Forex Market Analysis EURUSD: Looking at EURUSD, it’s trending up and currently at a resistance level of 1.09000, with the next resistance around 1.09500. Looking at the 1-hour chart, you can see the price trading just above the resistance at 1.09000. If the uptrend continues, we can expect this momentum to keep going. We might see a pullback around 1.09500, but if that level is also broken, the price could head to the next resistance around 1.10000. USDJPY: Looking at USDJPY, it was trending up, but now it seems to have broken the major support level. We can expect a new trend to form. Looking at the 1-hour chart, the price pulled back from a support level at 157, went up, and is now back at that level, consolidating. If the price breaks below this support, we can expect it to drop to the next support level. However, the price could also rise from this support, so watch for both reversal and breakout signals. The trend is more likely to be bearish. GBPUSD: Looking at GBPUSD, it’s trending up, and the price is currently at resistance level 1.30000, with the next resistance around 1.32000. Looking at the 1-hour chart, you can see the price trading just below the 1.30000 resistance. If the price breaks above this level, it could continue up to the next resistance level. However, the price might also pull back from this level, so watch for both reversal and breakout signals. USDCHF: Looking at USDCHF, it’s trending down and is currently pulling back from resistance at 0.91000. Looking at the 1-hour chart, the price is trading between a support and resistance line. The trend direction will be determined once the price breaks one of these levels. Since the overall trend is down, the price is more likely to break below the support. Wait for the breakout to confirm the trend. USDCAD: Looking at USDCAD, it broke below the major support. Now, the price is in either a downward or sideways trend and is just above another support level. Looking at the 1-hour chart, the price is consolidating between support and resistance levels. Only a breakout will determine the future trend. Since the overall trend is bearish, the price is more likely to break support. Wait for the breakout to confirm the trend. AUDUSD: Looking at AUDUSD, it’s trending up, with the next resistance around 0.69000. Looking at the 1-hour chart, the price is at a resistance level. It might pull back from this level, or it could break above and continue up to the next resistance. Watch for both reversal and breakout patterns. NZDUSD: Looking at NZDUSD, the price is pulling back up from the 0.60500 level. Looking at the 1-hour chart, the price is around a resistance level. We can expect a pullback here, or the price could break above this level and pull back around the next resistance. If that resistance is also broken, the price could continue to go up. Commodities Market Analysis GOLD: Looking at gold, it’s consolidating and the price is near a major resistance level. Looking at the 1-hour chart, the price is trending up and is just below the resistance. We can expect a pullback around this resistance with the price dropping, or it could break above and continue going up. Watch for both breakout and reversal patterns. SILVER: Looking at silver, it’s pulling back up from a support level and is now around a resistance level. Since the price broke below the trendline, we can expect it to drop to the support level. However, it could also rise from this level. The major support is around 29.000, and the resistance is around 32.500. CRUDE OIL: Looking at crude oil, the trend is still uncertain, but in the medium term, it was going up. Looking at the 1-hour chart, the price is pulling back up from the support at 85. We can expect it to rise to the next resistance around 88.500, or it could break below this support and drop to the next support level. Watch for both breakout and reversal signals. Cryptocurrency Market Analysis BTC: Looking at BTC, it's trending down, and it recently pulled back from support at 54000. Looking at the 1-hour chart, the price is at a resistance level. If it breaks above this level, we can expect it to continue up to the next resistance level. However, the price could also drop from this level and break below the support, causing it to start falling. Watch for breakouts. ETH: Looking at ETH, it's trending down and recently pulled back from the major support level around 2800. Looking at the 1-hour chart, the price is trending up in the medium term and is currently at a resistance level. It might pull back from this level and start dropping, or it could break above the resistance and continue going up. Watch for breakouts. BNB: Looking at BNB, it's trending down and recently pulled back from the 440 support level. Looking at the 1-hour chart, the price is consolidating around the 540 resistance. A breakout will determine the future trend, so wait for the breakout to confirm it. The price will continue in the direction of the breakout. Conclusion & Disclaimer This analysis article isn't about telling you when to buy or sell. It's about teaching you how to approach the market effectively. Every day, I follow the same routine before I start trading. Here, I briefly explained the technical aspects of what's happening and what actions I take in these situations. Your goal is to understand what I do so you can follow the same process on your own. The market can change its behavior without notice, so it's best to analyze it every day. The ForexCracked version covers all the important assets in detail for the week in one article. Meanwhile, the xlearn version focuses more on daily analysis for day traders. If you want to follow daily analysis for Forex, US Stocks & Cryptocurrencies, check out this section on xlearnonline.com Please provide your feedback in the comment section below on how we can further improve our market analysis. Thank you. Acknowledging the inherent unpredictability of financial markets is crucial. While we strive to offer informed perspectives on upcoming events and trends affecting various instruments, readers should conduct their own analysis and exercise prudent judgment. Encouragement of Independent Analysis We strongly encourage readers to supplement the information presented here with their own research and analysis. Market dynamics can swiftly change due to a multitude of factors, and individual circumstances may vary. By conducting independent analysis, readers can tailor their strategies to align with their unique goals and risk tolerance. No Certainty in Market Predictions It's vital to recognize that nobody possesses the ability to predict market movements with absolute certainty consistently. Market analysis serves as a tool to assess probabilities and identify potential opportunities, but it's essential to remain cognizant of the inherent uncertainty in financial markets. Aligning with High Probability Rather than aiming for infallible predictions, our goal is to align with high-probability scenarios based on available information and analysis. This approach acknowledges the dynamic nature of markets while seeking to capitalize on opportunities with favorable risk-reward profiles. Proceed with Caution Lastly, while market analysis can offer valuable insights, it's imperative to approach trading and investment decisions with caution. Markets can be volatile, and unforeseen events may impact asset prices unexpectedly. Exercise prudent risk management and consider seeking advice from qualified financial professionals before making any significant financial decisions. Remember, the journey of financial analysis and investment is a continuous learning process, and embracing a disciplined approach can contribute to long-term success in navigating the complexities of global markets. THANK YOU & HAPPY TRADING FROM FOREXCRACKED!!! 😍😍💸🤘 Get Premium EA and indicators ,lessons strategies free everyday ✅💸 Link in Bio 💸#forex #forexea #forexexpert #forexexpertadvisor #forexexpertadvisorsfree #forexcracked #freeforexsignals #freeforexearobot #forexrobot #forextrading #forexeducation #forextraders #forextrade #freeforex #forexindicator #forexstrategies
0 notes