#ProfitAndLoss
Explore tagged Tumblr posts
Visit Tumblr Blog
Explore Tumblr blogs with no restrictions, modern design and the best experience.
Last Seen Tumblr Blogs


Fun Fact
When “GIF” was named word of the year in 2012, Oxford Dictionaries U.S.A. credited Tumblr for pushing the word.
Text
Income Statement vs. Cash Flow Statement: Understanding the Differences

Financial statements are the compass directing choices for investors, entrepreneurs, and legislators in India's vibrant commercial climate. Two important instruments that play different but related duties are the Cash Flow Statement and the Income Statement (Profit & Loss Account). The Income Statement shows profitability; the Cash Flow Statement checks liquidity. Understanding these assertions is non-negotiable for Indian companies negotiating GST complexity, Ind AS requirements, and strict Compliance under the Companies Act 2013.
Income Statement
It is generally one of the three principal financial statements, alongside the cash flow statement and the balance sheet. All publicly traded firms are required to create and disseminate this specific financial statement as part of their annual reports. A company's income statement is sometimes referred to as the statement of revenue and expense or the profit and loss statement. The statement primarily emphasizes the overall income and expenditures of a company within a specific accounting quarter. Thus, it aids in conveying a company's whole financial performance throughout a certain accounting period. Revenue is defined as the total money derived from a firm's operational and non-operating operations. However, revenues are distinct from receivables, as they are generated and documented on a company's income statement. Conversely, total expenses constitute the costs incurred during the firm's core and secondary operations.
Key Components of the Income Statement
Revenue (Sales/Turnover) – Total income earned from business operations.
Cost of Goods Sold (COGS) – Direct costs related to the production of goods/services.
Gross Profit – Revenue minus COGS.
Operating Expenses – Includes administrative, selling, and other business expenses.
Operating Profit (EBIT) – Earnings before interest and taxes.
Other Income & Expenses – Interest income, investment income, or one-time gains/losses.
Net Profit Before Tax (PBT) – Earnings before deducting taxes.
Tax Expenses – Corporate tax payable to the government.
Net Profit After Tax (PAT) – The final earnings available to shareholders.
Relevance of Income Statement in the Indian Context
The Income Statement forms the basis for corporate tax calculations under the Income Tax Act, 1961.
As per the Companies Act, 2013, businesses must prepare and report their financials as per Indian Accounting Standards (Ind AS) or Generally Accepted Accounting Principles in India (Indian GAAP).
Investors use net profit and earnings per share (EPS) from the Income Statement to evaluate stock performance.
Banks and financial institutions assess operating profits before granting loans.
Cash Flow Statement
It is a financial statement that provides comprehensive information on all cash inflows a firm receives from its ongoing operations and external investment sources. It encompasses all financial outflows over a designated period for firm operations and investments. Financial statements from a corporation provide investors and analysts with an overview of all transactions occurring within the entity, each of which contributes to its success. The cash flow statement is considered the most basic of all financial statements, since it delineates the cash created by the firm through three primary avenues: sales, acquisitions, and funding. Net cash flow is defined as the aggregate of all three components. The three distinct components of the cash flow statement assist investors in assessing the value of a company's shares or the organization overall.
Key Components of the Cash Flow Statement
Operating Cash Flows (CFO) – Cash generated from core business activities (e.g., cash sales, payments to suppliers, salaries, etc.).
Investing Cash Flows (CFI) – Cash spent or received from investments (e.g., purchase/sale of assets, investments in securities, etc.).
Financing Cash Flows (CFF) – Cash movements related to financing activities (e.g., issuing shares, taking loans, repaying debt, paying dividends, etc.).
Net Cash Flow – The total increase or decrease in cash over a period.
Relevance of Cash Flow Statement in the Indian Context
A company may report profits but still face cash shortages if its cash flows are weak.
Helps businesses manage cash cycles effectively, especially in industries like manufacturing and retail.
Indian banks scrutinize a firm’s cash flow position before extending credit lines.
Foreign and domestic investors assess free cash flows to determine a company’s financial stability.
Differences Between Income Statement and Cash Flow Statement
Aspect
Income Statement
Cash Flow Statement
Accounting Basis
Accrual Accounting (Records revenues & expenses when incurred)
Cash Accounting (Records actual cash transactions)
Purpose
Shows profitability
Shows cash liquidity
Key Metric
Net Profit (PAT)
Net Cash Flow (CFO, CFI, CFF)
Non-Cash Items
Includes depreciation, amortization, and accruals
Excludes non-cash items
Financial Health Indicator
Measures long-term profitability
Measures short-term liquidity
Focus
Revenue & expenses
Cash inflows & outflows
Why Do Profit and Cash Flow Differ?
A company may report high profits but still face cash shortages due to several reasons:
Due to credit sales Revenue may be booked, but cash is yet to be received.
Depreciation & amortization reduce net profit but have no cash impact.
Loan repayments reduce cash but are not part of the income statement.
Expenses incurred in cash may not yet reflect as COGS.
Which One Matters More?
Both statements are important, but their relevance depends on the stakeholder’s perspective:
Investors prefer the income statement to assess profitability and earnings growth.
Lenders & creditors focus more on the cash flow statement to ensure repayment capability.
Management uses both to make strategic decisions.
Questions to Understand your ability
Which accounting method does the Income Statement follow?
a) Cash Accounting b) Accrual Accounting c) Hybrid Accounting d) Deferred Accounting
Correct Answer: b) Accrual Accounting Reason: The Income Statement follows the accrual accounting method, where revenue and expenses are recorded when they are incurred, not when cash is received or paid.
What is the primary purpose of the Cash Flow Statement?
a) To show profitability b) To show cash liquidity c) To report tax expenses d) To calculate net profit
Correct Answer: b) To show cash liquidity Reason: The Cash Flow Statement focuses on showing cash inflows and outflows, which helps assess the company’s liquidity, unlike the Income Statement which focuses on profitability.
Which of the following is NOT included in the Income Statement?
a) Depreciation b) Interest income c) Purchase of machinery d) Tax expenses
Correct Answer: c) Purchase of machinery Reason: The purchase of machinery is part of the Cash Flow Statement under investing activities. The Income Statement includes items like depreciation, interest income, and tax expenses.
Why might a company show a high profit but face cash shortages?
a) Depreciation and amortization b) Loan repayments c) Credit sales d) All of the above
Correct Answer: d) All of the above Reason: A company may show a high profit but still face cash shortages because of factors like credit sales (where cash isn't received yet), depreciation (non-cash expense), and loan repayments (affecting cash flow but not profit).
Which statement is more relevant for lenders and creditors?
a) Income Statement b) Cash Flow Statement c) Balance Sheet d) Statement of Changes in Equity
Correct Answer: b) Cash Flow Statement Reason: Lenders and creditors are more concerned with a company’s ability to repay debts, which is directly related to cash flow, making the Cash Flow Statement more important to them.
Conclusion
Making wise financial decisions depends on a knowledge of the Income Statement and Cash Flow Statement. The Income Statement shows profitability; the Cash Flow Statement guarantees liquidity and financial stability. Maintaining healthy financial flows and following Ind AS is absolutely vital for companies doing business in India if they want to have sustainable development. Analyzing both statements taken together offers a whole picture of a company's financial situation regardless of your position—investment, business, or financial specialist.
0 notes
Text
0 notes
Text

#otd #startrek #deepspacenine #ProfitandLoss #sisko #dax #kiranerys #odo #bashir #obrian #quark #natimalang #garak #hogue #rekelen #gultoran #ds930 #startrek57 @TrekMovie @TrekCore @StarTrek @StarTrekOnPPlus
0 notes
Text
Profit and Loss Question | SBI PO Memory Based | By Amar Sir #shorts #sbipo: https://youtube.com/shorts/2vHNDRIEHoM?feature=share
#amarsir#profitandloss#sbipo#sbipopre#sbipo2023#youtube#amarsiryoutube#amarsiryt#ibps po#math#top 10 best ssc coaching delhi#school#maths#wordproblems#ssc cgl
0 notes
Text
Hallmark 1st Q Results: Share Price Drops to $3.83

Hallmark Financial Services, Inc. (“Hallmark”) (NASDAQ: HALL) today filed its Form 10-Q and announced financial results for the first quarter ended March 31, 2023. First Quarter 2023 2022 $ in millions: Net loss from continuing operations $ (39.2 ) $ (11.7 ) Net income from discontinued operations $ 0.1 $ 8.5 Net loss $ (39.1 ) $ (3.2 ) Operating loss (1) $ (5.0 ) $ (11.7 ) $ per diluted share (2): Net loss from continuing operations $ (21.59 ) $ (6.43 ) Net income from discontinued operations $ 0.06 $ 4.66 Net loss $ (21.53 ) $ (1.77 ) Operating loss (1) $ (2.74 ) $ (6.45 ) (1) See “Non-GAAP Financial Measures” below (2) Per share amounts have been restated to reflect one-for-ten reverse stock split
Highlights of results from the quarter:
- American Hallmark Insurance Company of Texas, Hallmark Insurance Company, Hallmark Specialty Insurance Company, Hallmark County Mutual Insurance Company and Hallmark National Insurance Company (collectively, the “Hallmark Insurers”) are parties to a Loss Portfolio Transfer Reinsurance Contract (the “LPT Contract”) and related agreements with DARAG Bermuda Ltd. (“DARAG Bermuda”) and DARAG Insurance (Guernsey) Limited (“DARAG Guernsey” and, collectively, the “Reinsurers”). The Reinsurers and the Hallmark Insurers agreed to submit to binding arbitration a dispute regarding the rights and obligations of the parties under the LPT Contract. The Company established a receivable of $58.9 million pending a resolution of the matter. An interim binding arbitration award was declared by the arbitration panel on May 4, 2023. In accordance with GAAP, the Company recognized in the current reporting period a write-off to bad debt expense of $32.9 million of the receivable established by the Company. As of March 31, 2023, our consolidated balance sheet included $4.0 million of account receivable from DARAG related to cost incurred in which we contend we have right of reimbursement. A definitive binding award is expected to be forthcoming in the near future which may increase or decrease our total write-off. - Net loss from continuing operations of $39.2 million, or $21.59 per share, in the first quarter of 2023 includes $26.0 million or $14.28 per share related to the DARAG write-off to bad debt expense, as compared to a net loss of $11.7 million, or $6.43 per share, for the same period of 2022. See Non-GAAP Financial Measures below. - Net income from discontinued operations of $0.1 million, or $0.06 per share, in the first quarter of 2023 as compared to net income from discontinued operations of $8.5 million, or $4.66 per share, for the same period of 2022. - Net loss of $39.1 million, or $21.53 per share, in the first quarter of 2023 includes $26.0 million or $14.28 per share related to the DARAG write-off to bad debt expense as compared to net loss of $3.2 million, or $1.77 per share, for the same period of 2022. See Non-GAAP Financial Measures below. - Net combined ratio of 215.7% for the three months ended March 31, 2023, compared to 136.9% for the same periods the prior year. - Underlying combined ratio (excluding net prior year development, catastrophe losses and write-off of DARAG receivable) of 107.5% for the three months ended March 31, 2023, compared to 109.8% for the same period the prior year. See Non-GAAP Financial Measures below. - Net investment income was $4.3 million during the three months ended March 31, 2023, as compared to $1.9 million during the same period in 2022. - As of March 31, 2023, the Company has $105.5 million in cash and cash equivalents. Our debt securities were $340.0 million as of March 31, 2023 as compared to $426.6 million as of December 31, 2022. Also, 91% of debt securities have maturities of five years or less and the average modified duration of 0.7 years. - The Company continues to maintain a full valuation allowance for income tax in fiscal 2023. - On May 14, 2023, the Company submitted notice to AM Best to withdraw from AM Best’s interactive rating process. We will be assigned a Non-Rating Designation of NR by AM Best, which are assigned to insurance companies that are not rated.
First Quarter 2023 Financial Review
First Quarter 2023 2022 ($ in thousands) Gross premiums written $ 57,172 $ 59,333 Net premiums written $ 42,381 $ 41,269 Net premiums earned $ 35,280 $ 39,315 Investment income, net of expenses $ 4,342 $ 1,859 Investment (losses) gains, net $ (640 ) $ 51 Net (loss) from continuing operations $ (39,246 ) $ (11,677 ) Net income from discontinued operations $ 104 $ 8,458 Net (loss) income $ (39,142 ) $ (3,219 ) Operating (loss) income (2) $ (4,973 ) $ (11,717 ) Net (loss) income per share - from continuing operations basic & diluted (1) $ (21.59 ) $ (6.43 ) Net income per share from discontinued operations - basic & diluted $ 0.06 $ 4.66 Net loss per share - basic & diluted $ (21.53 ) $ (1.77 ) Operating (loss) per share - basic & diluted (2) $ (2.74 ) $ (6.45 ) Book value per share $ 12.95 $ 93.47 (1) Per share amounts have been restated for a reverse stock split (2) See “Non-GAAP Financial Measures” below
Non-GAAP Financial Measures
The Company’s financial statements are prepared in accordance with United States generally accepted accounting principles (“GAAP”). However, the Company also presents and discusses certain non-GAAP financial measures that it believes are useful to investors as measures of operating performance. Management may also use such non-GAAP financial measures in evaluating the effectiveness of business strategies and for planning and budgeting purposes. However, these non-GAAP financial measures should not be viewed as an alternative or substitute for the results reflected in the Company’s GAAP financial statements. In addition, the Company’s definitions of these items may not be comparable to the definitions used by other companies. Operating income and operating income per share are calculated by excluding net investment gains and losses and asset impairments or valuation allowances from GAAP net income from continuing operations. Asset impairments and valuation allowances are unusual and infrequent charges for the Company. Management believes that operating income and operating income per share provide useful information to investors about the performance of and underlying trends in the Company’s core insurance operations. Net income from continuing operations and net income per share from continuing operations are the GAAP measures that are most directly comparable to operating earnings and operating earnings per share. A reconciliation of operating income and operating income per share to the most comparable GAAP financial measures is presented below. ($ in thousands) Income (Loss) from Continuing Operations Before Tax Less Tax Effect Net After Tax Weighted Average Shares Diluted Diluted Per Share First Quarter 2023 Reported GAAP measures $ (39,780 ) $ (534 ) $ (39,246 ) 1,818 $ (21.59 ) Excluded deferred tax valuation allowance $ - $ (7,798 ) $ 7,798 1,818 $ 4.29 Excluded write-off receivable from reinsurer $ 32,872 $ 6,903 $ 25,969 1,818 $ 14.28 Excluded investment (gains)/losses $ 640 $ 134 $ 506 1,818 $ 0.28 Operating loss $ (6,268 ) $ (1,295 ) $ (4,973 ) 1,818 $ (2.74 ) First Quarter 2022 Reported GAAP measures $ (14,857 ) $ (3,180 ) $ (11,677 ) 1,817 $ (6.43 ) Excluded investment (gains)/losses $ (51 ) $ (11 ) $ (40 ) 1,817 $ (0.02 ) Operating loss $ (14,908 ) $ (3,191 ) $ (11,717 ) 1,817 $ (6.45 ) Underlying combined ratio is calculated by excluding the impact of net favorable or unfavorable prior year loss development and catastrophe losses from the calculation of the net combined ratio. Management believes that the underlying combined ratio provides useful information to investors about the current performance of the Company's insurance operations absent historical developments and uncontrollable events. Combined ratio is the GAAP measure most comparable to underlying combined ratio. A reconciliation of the underlying combined ratio to the combined ratio is presented below. 1stQ 2023 1stQ 2022 Net combined ratio 215.7 % 136.9 % Impact on net combined ratio Net Unfavorable (Favorable) Prior Year Development 10.1 % 26.5 % Catastrophes, net of reinsurance 4.9 % 0.6 % Write-off receivable from reinsurer 93.2 % 0.0 % Underlying combined ratio 107.5 % 109.8 % A copy of our Form 10-Q is available on our website at www.hallmarkgrp.com or on the SEC website at www.sec.gov. Readers are urged to review the Form 10-Q for a more complete discussion of our financial performance.
About Hallmark
Hallmark is a property and casualty insurance holding company with a diversified portfolio of insurance products written on a national platform. With six insurance subsidiaries, Hallmark markets, underwrites and services commercial and personal insurance in select markets. Hallmark is headquartered in Dallas, Texas and its common stock is listed on NASDAQ under the symbol "HALL."
Balance Sheets, etc.
Hallmark Financial Services, Inc. and Subsidiaries Consolidated Balance Sheets ($ in thousands, except par value) Mar. 31 Dec. 31 ASSETS 2023 2022 Investments: Debt securities, available-for-sale, at fair value (amortized cost: $344,714 in 2023 and $434,119 in 2022; allowance for expected credit losses of $0 in 2023) $ 340,054 $ 426,597 Equity securities (cost: $24,281 in 2023 and $30,058 in 2022) 22,392 28,199 Total investments 362,446 454,796 Cash and cash equivalents 105,458 59,133 Restricted cash 9,108 29,486 Ceded unearned premiums 231,314 237,086 Premiums receivable 82,375 78,355 Accounts receivable 1,378 10,859 Receivable from reinsurer 3,953 58,882 Restricted funds withheld 11,129 0 Receivable for securities 11,563 945 Reinsurance recoverable (net of allowance for expected credit losses of $200 in 2023) 621,229 578,424 Deferred policy acquisition costs 2,896 8 Federal income tax recoverable 2,598 2,668 Prepaid pension assets 201 163 Prepaid expenses 2,227 1,508 Other assets 22,390 24,389 Total Assets $ 1,470,265 $ 1,536,702 LIABILITIES AND STOCKHOLDERS' EQUITY Liabilities: Senior unsecured notes due 2029 (less unamortized debt issuance costs of $623 in 2023 and $648 in 2022) $ 49,377 $ 49,352 Subordinated debt securities (less unamortized debt issuance costs of $679 in 2023 and $691 in 2022) 56,023 56,011 Reserves for unpaid losses and loss adjustment expenses 835,903 880,869 Unearned premiums 294,019 292,691 Reinsurance payable 143,529 128,950 Payable for securities 979 - Accounts payable and other liabilities 66,900 68,535 Total Liabilities 1,446,730 1,476,408 Commitments and contingencies Stockholders' equity: Common stock, $1.00 par value, authorized 3,333,333 shares; issued 2,087,283 shares in 2023 and 2022 2,087 2,087 Additional paid-in capital 124,837 124,740 (Accumulated deficit) retained earnings (72,549 ) (33,407 ) Accumulated other comprehensive loss (6,206 ) (8,492 ) Treasury stock (268,801 shares in 2023 and 2022), at cost (24,634 ) (24,634 ) Total Stockholders Equity 23,535 60,294 Total Liabilities & Stockholders Equity $ 1,470,265 $ 1,536,702 Hallmark Financial Services, Inc. and Subsidiaries Consolidated Statements of Operations Three Months Ended ($ in thousands, except per share amounts) March 31, 2023 2022 Gross premiums written $ 57,172 $ 59,333 Ceded premiums written (14,791 ) (18,064 ) Net premiums written 42,381 41,269 Change in unearned premiums (7,101 ) (1,954 ) Net premiums earned 35,280 39,315 Investment income, net of expenses 4,342 1,859 Investment (losses) gains, net (640 ) 51 Finance charges 779 983 Other income 70 15 Total revenues 39,831 42,223 Losses and loss adjustment expenses 29,764 39,382 Operating expenses 47,949 16,427 Interest expense 1,898 1,264 Amortization of intangible assets 0 7 Total expenses 79,611 57,080 (Loss) income from continuing operations before tax (39,780 ) (14,857 ) Income tax expense (benefit) from continuing operations (534 ) (3,180 ) Net (loss) income from continuing operations $ (39,246 ) $ (11,677 ) Discontinued operations: Total pretax income from discontinued operations $ 104 $ 10,738 Income tax (benefit) expense on discontinued operations - 2,280 Income from discontinued operations, net of tax $ 104 $ 8,458 Net (loss) income $ (39,142 ) $ (3,219 ) Net (loss) basic income per share: Net loss from continuing operations $ (21.59 ) $ (6.43 ) Net income from discontinued operations 0.06 4.66 Basic net (loss) income per share $ (21.53 ) $ (1.77 ) Net (loss) diluted income per share: Net loss from continuing operations $ (21.59 ) $ (6.43 ) Net income from discontinued operations 0.06 4.66 Diluted net (loss) income per share $ (21.53 ) $ (1.77 ) Hallmark Financial Services, Inc. and Subsidiaries Consolidated Segment Data Three Months Ended Mar. 31 Commercial Lines Segment Personal Lines Segment Runoff Specialty Segment Corporate Consolidated ($ in thousands, unaudited) 2023 2022 2023 2022 2023 2022 2023 2022 2023 2022 Gross premiums written $ 43,345 $ 38,071 $ 13,652 $ 16,832 $ 175 $ 4,430 $ - $ - $ 57,172 $ 59,333 Ceded premiums written (14,489 ) (17,743 ) (133 ) (76 ) (169 ) (245 ) 0 0 (14,791 ) (18,064 ) Net premiums written 28,856 20,328 13,519 16,756 6 4,185 0 0 42,381 41,269 Change in unearned premiums (7,246 ) (2,073 ) 138 (1,197 ) 7 1,316 0 0 (7,101 ) (1,954 ) Net premiums earned 21,610 18,255 13,657 15,559 13 5,501 0 0 35,280 39,315 Total revenues 21,626 18,280 14,436 16,532 14 5,501 3,755 1,910 39,831 42,223 Losses and loss adjustment expenses 15,617 12,912 11,169 12,579 2,978 13,891 0 0 29,764 39,382 Pre-tax income (loss) 826 (636 ) (1,775 ) (1,313 ) (37,195 ) (10,038 ) (1,636 ) (2,870 ) (39,780 ) (14,857 ) Net loss ratio (1) 72.3 % 70.7 % 81.8 % 80.8 % N/A (2) 252.5 % 84.4 % 100.2 % Net expense ratio (1) 25.4 % 33.9 % 33.2 % 29.0 % N/A (2) 31.5 % 131.3 % 36.7 % Net combined ratio (1) 97.7 % 104.6 % 115.0 % 109. Read the full article
0 notes
Text
Profit and Loss Assignment:2


Que 1: What is the cost price of an article if the profit on selling it for Rs. 425 is equal to the loss on selling it for Rs. 355?
(a) 410
(b) 380
(c) 400
(d) 390
Solution: CP-355=425-CP
CP=390
Option (d) is correct
Que 2: If the cost price of 10 articles is equal to the selling price of 15 articles, what is the percentage of profit or loss incurred on the transaction?
(a) 25.5%
(b) 35%
(c) 10%
(d) 33.33%
Solution: CP×10=SP×15
CP: SP=3:2
Loss=33.33%
Option (d) is correct
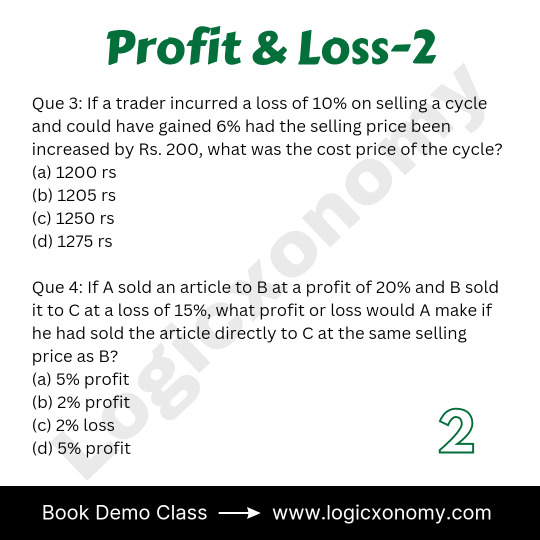
Que 3: If a trader incurred a loss of 10% on selling a cycle and could have gained 6% had the selling price been increased by Rs. 200, what was the cost price of the cycle?
(a) 1200 rs
(b) 1205 rs
(c) 1250 rs
(d) 1275 rs
Solution: 90%+200=106%
16%=200
1%=25/2
100%=1250
Option (c) is correct
Que 4: If A sold an article to B at a profit of 20% and B sold it to C at a loss of 15%, what profit or loss would A make if he had sold the article directly to C at the same selling price as B?
(a) 5% profit
(b) 2% profit
(c) 2% loss
(d) 5% profit
Solution: A: B=5: 6
B: C=20: 17
A: B: C= 100: 120: 102
A makes 2% profit
Option (b) is correct
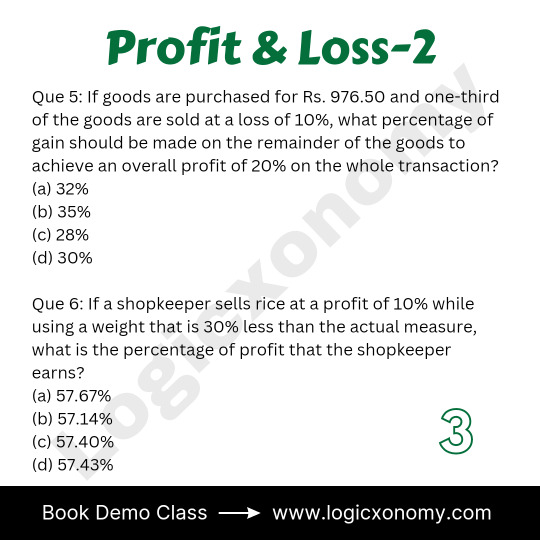
Que 6: If a shopkeeper sells rice at a profit of 10% while using a weight that is 30% less than the actual measure, what is the percentage of profit that the shopkeeper earns?
(a) 57.67%
(b) 57.14%
(c) 57.40%
(d) 57.43%
Solution: SP= Price per unit× No. of Units
Weight⇒ 10: 7
SP⇒ 10: 11
Price= 10/10: 11/7= 7: 11
Percentage Profit= 400/7= 57(1/7)=57.14%
Option (b) is correct
— — — — — — — — — — — — — —
Click the given link for details
Telegram Channel: Logicxonomy
0 notes
Text
Kurt Wehrle tells about Profit and Loss Management
Kurt Wehrle said, an income statement is essential to assess the health of your business; its creation is the first step towards proper profit and loss management. Creating an income statement is the first important step in managing income and loss, and along with your balance sheet and cash flow statement, your income statement is one of the three most important financial documents in your repertoire. Kurt Wehrle said, the income statement (P&L), or profit and loss statement, or profit and loss statement, is a financial statement that contains a summary of a company's income, expenses, and profit/loss for a certain period of time. Like the financial statement, the income statement provides you with detailed information about both the income and expenses of your business. An income statement is a financial statement that summarizes your company's income, costs, and expenses incurred during a specific period (such as a month, quarter, or year), as well as net income. Kurt Wehrle added Profit and loss statements are used to track the total income and general expenses of a company over a period of time, usually prepared on a monthly or quarterly basis. These records provide information about a company's ability or inability to make a profit by increasing revenue, cutting costs, or both. For non-profit organizations, income and expenses are usually tracked on a financial statement called a statement of assets (sometimes called a statement of financial assets or a statement of support).

1 note
·
View note
Photo

#otd #startrek #deepspacenine #ProfitandLoss #sisko #dax #kiranerys #odo #bashir #obrian #quark #natimalang #garak #hogue #rekelen #gultoran #ds930 #startrek56 @startrekonpplus @startrek https://www.instagram.com/p/CqBES2eOawT/?igshid=NGJjMDIxMWI=
#otd#startrek#deepspacenine#profitandloss#sisko#dax#kiranerys#odo#bashir#obrian#quark#natimalang#garak#hogue#rekelen#gultoran#ds930#startrek56
1 note
·
View note
Photo
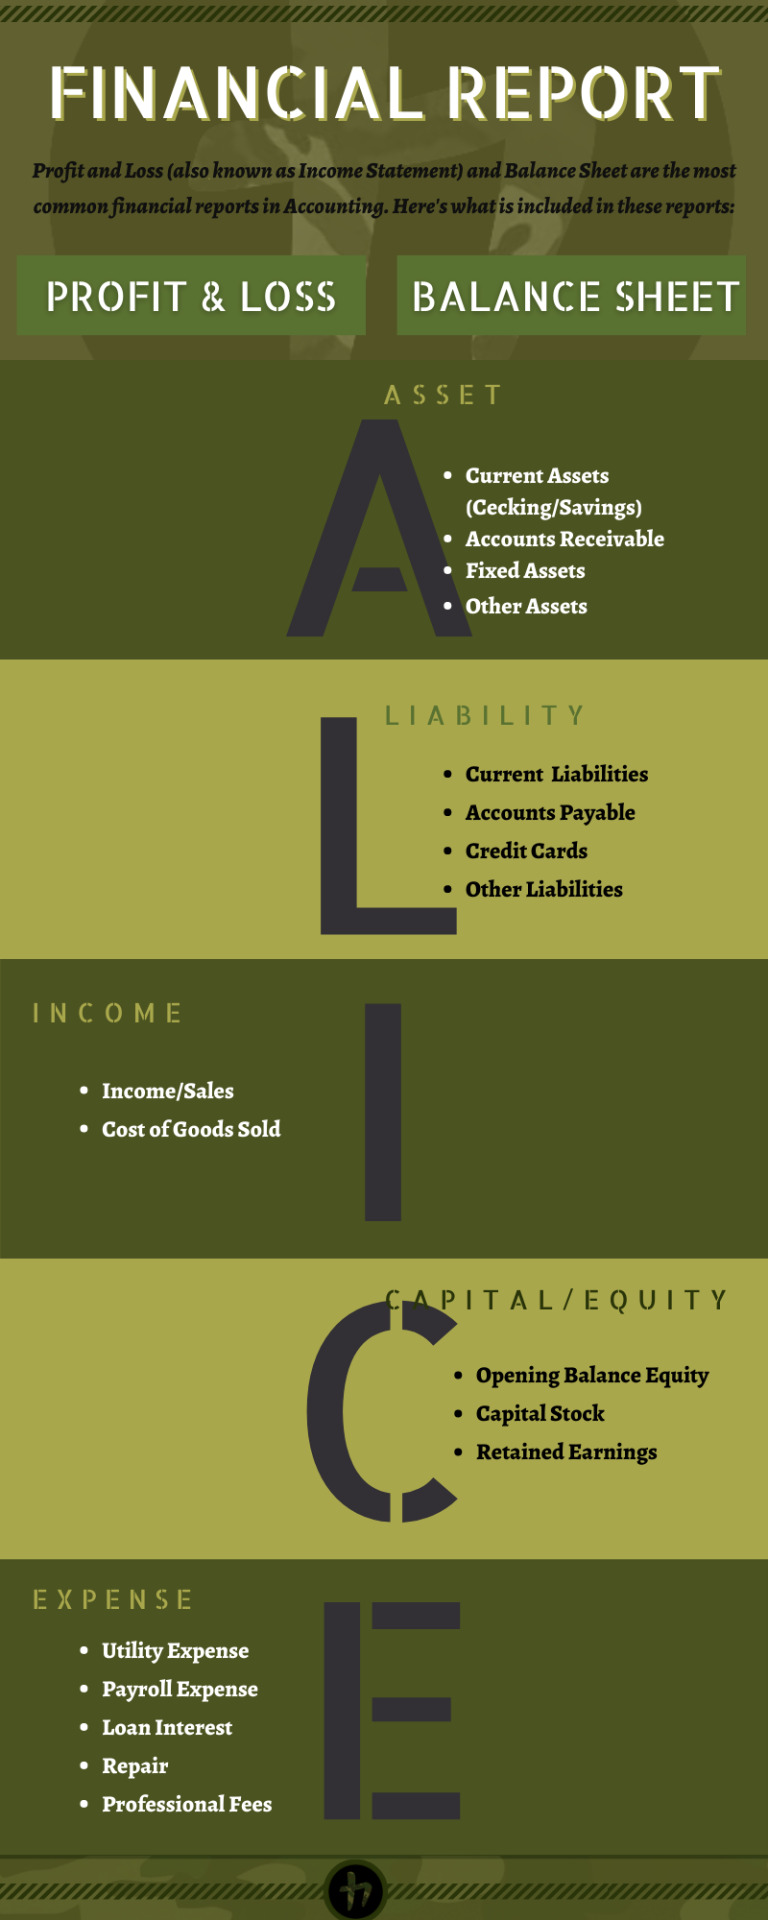
Here’s a guide to your financial report.
https://hernansenation.wordpress.com
#Financial Report#ProfitandLoss#IncomeStatement#BalanceSheet#Accountant#Accounting#QuickBooksOnlline#Xero QBO
0 notes
Photo

How do you start your mornings? I like my coffee first thing. Helps me get my day going ☕️⠀⠀⠀⠀⠀⠀⠀⠀⠀ ⠀⠀⠀⠀⠀⠀⠀⠀⠀ #coffee #noworkieunlesscoffee #morningflow #profitandloss #oversight #balancesheets #houstonbookkeeper #cypressbookkeeper #katybookkeeper #businessowner #momboss #wife #businesswithsarah ⠀⠀⠀⠀⠀⠀⠀⠀⠀ ⠀⠀⠀⠀⠀⠀⠀⠀⠀ Sent via @planoly #planoly https://www.instagram.com/p/B_NHbBcnZ4U/?igshid=lyiwhnd75cch
#coffee#noworkieunlesscoffee#morningflow#profitandloss#oversight#balancesheets#houstonbookkeeper#cypressbookkeeper#katybookkeeper#businessowner#momboss#wife#businesswithsarah#planoly
0 notes
Text
youtube
A short note on all profit and loss statements
0 notes
Video
instagram
Business tip by @accountingbysal 💜 Have you asked yourself this question before? Here is why you need to know. If you want to cut back on costs and #boostrevenue, this will help you understand where you should be focusing your resources—and where you should potentially cut back. Where to find this information: Monthly #profitandloss statement under #revenue. #accountingbysal #quickbooksonline #bookkeeping #cloudaccounting #qbo https://www.instagram.com/p/B4TWJCUlx1i/?igshid=7qn9ofd5pcvz
#boostrevenue#profitandloss#revenue#accountingbysal#quickbooksonline#bookkeeping#cloudaccounting#qbo
0 notes
Text
Profit and Loss Statement for Startups: Free and Premium Tools

A great idea and an endless drive do not make a startup successful, especially if you ignore the mundane accounting tasks. Profit and loss statement (P&L) should be among the first files you generate along with a budget and a costs worksheet. Let’s recap why this statement is vital for startup survival and go over two quick and easy ways to generate the file. We’ll provide a free template and recommend a popular web app to handle your finances.
What is P&L and Why Does Your Startup Need It?
Among the variety of accounting files, profit and loss statement is often overlooked despite its vital role. P&L report shows your business profitability over a period of time (month, quarter, year). The final line of the statement returns net earnings or losses after interest and taxes. Using this one line, you can evaluate how good or bad the business is faring. If the number is in the negative, your expenses exceed the revenue, and without quick intervention, you can go broke soon.
Startup P&L statement is not for your eyes only. It can help to secure funding for your small business from investors or to get a bank loan. If your net earnings are increasing over a few months, your chances of getting funded are good.
Another way to use the profit and loss statement is for planning and forecasting. Use your business plan to generate a predictive P&L report, adding the expected revenue and expenses to calculate the net earnings. If you don’t like what you see, your business plan and strategy require more work. The same goes for comparing your forecast with reality after the first month. If the numbers do not fit your forecast, review your expenses to decrease them or look for new revenue streams to increase profits.
Free P&L Statement Template
To keep track of your business expenses and profits, create a spreadsheet with dates, revenue streams, and expense types as your column headers. Whenever you close a sale or transfer utility or Internet payment, add the number to the table, choosing the right date and column. At the end of the month, sum the numbers in columns and transfer them to a new list that will hold your monthly profit-and-loss statement.
As you can see from our template, the spreadsheet has several blocks:
Revenue streams indicate the sources of your business income;
Cost of goods or services sold shows the prime cost of your products;
Expenses are categorized and include all types of charges, from advertising to utilities;
Interest and taxes are deducted from your income to calculate the net earnings after taxes.
Using a free spreadsheet P&L statement template makes your bookkeeping quick and easy. Instead of calculating the losses and profits manually and dealing with a shoebox full of receipts, you can just input the data. The table processor will automatically calculate your gross profit, net earnings before and after interest and taxes.
Once you have accumulated enough monthly data, you can build charts and diagrams to help you visualize the progress of your business. If you are successful and keep the startup afloat for years, you will need an annual P&L statement. It looks the same, but instead of months, the columns represent years.
A simple spreadsheet P&L statement is easy to create and use. However, for it to be effective, you must remember to add relevant data daily, as soon as the payment occurs. For this reason, we recommend using a cloud-based spreadsheet processor, such as Google Sheets, that you can access from your smartphone or tablet.
Business Accounting Software
There are multiple web and mobile accounting apps capable of generating P&L statements for small and medium businesses, such as FreshBooks, QuickBooks, Xero, Zoho Books, and more. These solutions share similar features and pricing, and an ever-increasing competition on the market drives their rates down while improving functionality.
For example, FreshBooks is superior to an Excel P&L statement, as it:
Integrates with your business bank accounts and automatically processes data on sales and expenses, adding them to a P&L statement;
Stores and organizes cash transaction receipts for both profits and losses without the need to deal with a mound of papers;
Automatically calculates net earning before and after taxes, so you know exactly how profitable your startup is;
Visualizes the numbers in an easy-to-read format so you can assess the situation at a glance;
Provides multiple accounting features, including invoicing, time tracking, tax reporting and more, all invaluable for a startup.
Despite all the extra features and benefits, budgeting and accounting apps are rarely free. The prices start at around $10 per month and go up depending on the variety and number of features and subscription plan options. Adding the cost of a monthly plan to the budget might not be the best option if your startup does not have many clients yet. Instead, try to fill out the monthly spreadsheet P&L template to get a better understanding of the statement and keep a close eye on the expenses and profits. Once your small business is off the ground, you can graduate to an accounting app subscription plan or even develop a proprietary customized app to suit your business needs.
Let us know what you think about this quick overview of free and premium P&L statement software. If you want us to compare other business apps, leave a comment below and subscribe to FreshCode blog to get a fresh batch of IT insights in your Inbox.
Original article Profit and Loss Statement for Startups: Free and Premium Tools published at freshcodeit.com.
0 notes
Photo

#profitAndLoss #profitAndLossStatement #accounting (at Madison Avenue Presbyterian Church)
0 notes