#DataSets
Explore tagged Tumblr posts
Visit Tumblr Blog
Explore Tumblr blogs with no restrictions, modern design and the best experience.
Last Seen Tumblr Blogs


Fun Fact
70% of Tumblr users say the Dashboard is their favorite place to spend time online.
Text
The Internet Archive saves the day again

#cdc#centers for disease control and prevention#health#public health#science#diseases#datasets#data science#health science#stem fields
111 notes
·
View notes
Text

Art by Toothy Bj.
15 notes
·
View notes
Text
#tiktok#archiving#data#science#environmental activism#activism#collective action#call to action#internet#censorship#datasets#scientists#climate crisis#climate change#solarpunk#solar punk#hope#resource#archive
22 notes
·
View notes
Text
How Does AI Use Impact Critical Thinking?
New Post has been published on https://thedigitalinsider.com/how-does-ai-use-impact-critical-thinking/
How Does AI Use Impact Critical Thinking?

Artificial intelligence (AI) can process hundreds of documents in seconds, identify imperceptible patterns in vast datasets and provide in-depth answers to virtually any question. It has the potential to solve common problems, increase efficiency across multiple industries and even free up time for individuals to spend with their loved ones by delegating repetitive tasks to machines.
However, critical thinking requires time and practice to develop properly. The more people rely on automated technology, the faster their metacognitive skills may decline. What are the consequences of relying on AI for critical thinking?
Study Finds AI Degrades Users’ Critical Thinking
The concern that AI will degrade users’ metacognitive skills is no longer hypothetical. Several studies suggest it diminishes people’s capacity to think critically, impacting their ability to question information, make judgments, analyze data or form counterarguments.
A 2025 Microsoft study surveyed 319 knowledge workers on 936 instances of AI use to determine how they perceive their critical thinking ability when using generative technology. Survey respondents reported decreased effort when using AI technology compared to relying on their own minds. Microsoft reported that in the majority of instances, the respondents felt that they used “much less effort” or “less effort” when using generative AI.
Knowledge, comprehension, analysis, synthesis and evaluation were all adversely affected by AI use. Although a fraction of respondents reported using some or much more effort, an overwhelming majority reported that tasks became easier and required less work.
If AI’s purpose is to streamline tasks, is there any harm in letting it do its job? It is a slippery slope. Many algorithms cannot think critically, reason or understand context. They are often prone to hallucinations and bias. Users who are unaware of the risks of relying on AI may contribute to skewed, inaccurate results.
How AI Adversely Affects Critical Thinking Skills
Overreliance on AI can diminish an individual’s ability to independently solve problems and think critically. Say someone is taking a test when they run into a complex question. Instead of taking the time to consider it, they plug it into a generative model and insert the algorithm’s response into the answer field.
In this scenario, the test-taker learned nothing. They didn’t improve their research skills or analytical abilities. If they pass the test, they advance to the next chapter. What if they were to do this for everything their teachers assign? They could graduate from high school or even college without refining fundamental cognitive abilities.
This outcome is bleak. However, students might not feel any immediate adverse effects. If their use of language models is rewarded with better test scores, they may lose their motivation to think critically altogether. Why should they bother justifying their arguments or evaluating others’ claims when it is easier to rely on AI?
The Impact of AI Use on Critical Thinking Skills
An advanced algorithm can automatically aggregate and analyze large datasets, streamlining problem-solving and task execution. Since its speed and accuracy often outperform humans, users are usually inclined to believe it is better than them at these tasks. When it presents them with answers and insights, they take that output at face value. Unquestioning acceptance of a generative model’s output leads to difficulty distinguishing between facts and falsehoods. Algorithms are trained to predict the next word in a string of words. No matter how good they get at that task, they aren’t really reasoning. Even if a machine makes a mistake, it won’t be able to fix it without context and memory, both of which it lacks.
The more users accept an algorithm’s answer as fact, the more their evaluation and judgment skew. Algorithmic models often struggle with overfitting. When they fit too closely to the information in their training dataset, their accuracy can plummet when they are presented with new information for analysis.
Populations Most Affected by Overreliance on AI
Generally, overreliance on generative technology can negatively impact humans’ ability to think critically. However, low confidence in AI-generated output is related to increased critical thinking ability, so strategic users may be able to use AI without harming these skills.
In 2023, around 27% of adults told the Pew Research Center they use AI technology multiple times a day. Some of the individuals in this population may retain their critical thinking skills if they have a healthy distrust of machine learning tools. The data must focus on populations with disproportionately high AI use and be more granular to determine the true impact of machine learning on critical thinking.
Critical thinking often isn’t taught until high school or college. It can be cultivated during early childhood development, but it typically takes years to grasp. For this reason, deploying generative technology in schools is particularly risky — even though it is common.
Today, most students use generative models. One study revealed that 90% have used ChatGPT to complete homework. This widespread use isn’t limited to high schools. About 75% of college students say they would continue using generative technology even if their professors disallowed it. Middle schoolers, teenagers and young adults are at an age where developing critical thinking is crucial. Missing this window could cause problems.
The Implications of Decreased Critical Thinking
Already, 60% of educators use AI in the classroom. If this trend continues, it may become a standard part of education. What happens when students begin to trust these tools more than themselves? As their critical thinking capabilities diminish, they may become increasingly susceptible to misinformation and manipulation. The effectiveness of scams, phishing and social engineering attacks could increase.
An AI-reliant generation may have to compete with automation technology in the workforce. Soft skills like problem-solving, judgment and communication are important for many careers. Lacking these skills or relying on generative tools to get good grades may make finding a job challenging.
Innovation and adaptation go hand in hand with decision-making. Knowing how to objectively reason without the use of AI is critical when confronted with high-stakes or unexpected situations. Leaning into assumptions and inaccurate data could adversely affect an individual’s personal or professional life.
Critical thinking is part of processing and analyzing complex — and even conflicting — information. A community made up of critical thinkers can counter extreme or biased viewpoints by carefully considering different perspectives and values.
AI Users Must Carefully Evaluate Algorithms’ Output
Generative models are tools, so whether their impact is positive or negative depends on their users and developers. So many variables exist. Whether you are an AI developer or user, strategically designing and interacting with generative technologies is an important part of ensuring they pave the way for societal advancements rather than hindering critical cognition.
#2023#2025#ai#AI technology#algorithm#Algorithms#Analysis#artificial#Artificial Intelligence#automation#Bias#Careers#chatGPT#cognition#cognitive abilities#college#communication#Community#comprehension#critical thinking#data#datasets#deploying#Developer#developers#development#education#effects#efficiency#engineering
2 notes
·
View notes
Text
I bleed revolution. If your only anarchist actions are related to union organizing, then you’re not an anarchist, you’re a corporate puppet. Everything you do should work to subvert the current and future actions of the state and all of their tentacle corporate affiliations. If your only goal in life is to work under the orders of someone else, under someone’s else’s direction, with someone else’s instructions, then you’re not a human being. You’re chattel cattle at best. If a corporate pig tells or wants you to do something, then you should do the exact opposite, or else you’re just a pawn in a game of global corporate chess. Every one of your actions should be both a defensive and offensive maneuver. If you defend while you attack, you become one with your true purpose, which is to dismantle the state and all corporate authority. If you don’t think in a linear manner, then you’re not apart of their datasets, and they can’t predict your next move. You operate from outside of their datasets and what they think is your next move is never your next move. Then they start to doubt their own intelligence and all the false assumptions it’s based on, and the system starts to crumble. You use any means necessary, because that is your constitutional right, just as they use any means necessary to hold onto the power they stole from you. They stole your birthright, and it’s your legal duty as an American citizen to seek a redress of your grievances, using whatever it takes. Under no pretext.
#Revolution#constitution#anarchy#authority#system#corporate#American#America#birthright#dataset#datasets#AI#artificial intelligence#intelligence#CIA#anomaly#alien#UFO#wavelength#signals#amplitude#frequency
9 notes
·
View notes
Text
3 notes
·
View notes
Text
youtube
Ever wondered what the datasets used to train AI look like? This video is a subset of ImageNet-1k (18k images) with some other metrics.
Read more on how I made it and see some extra visualizations.
Okay! I'll split this up by the elements in the video, but first I need to add some context about
The dataset
ImageNet-1k (aka ILSVRC 2012) is an image classification dataset - you have a set number of classes (in this case 1000) and each class has a set of images. This is the most popular version of ImageNet, which usually has 21000 classes.
ImageNet was made using nouns from WordNet, searched online. From 2010 to 2017 yearly competitions were held to determine the best image classification model. It has greatly benefitted computer vision, developing model architectures that you've likely used unknowingly. See the accuracy progression here.
ResNet
Residual Network (or ResNet) is an architecture for image recognition made in 2015, trying to fix "vanishing/exploding gradients" (read the paper here). It managed to achieve an accuracy of 96.43% (that's 96 thousand times better than randomly guessing!), winning first place back in 2015. I'll be using a smaller version of this model (ResNet-50), boasting an accuracy of 95%.
The scatter plot
If you look at the video long enough, you'll realize that similar images (eg. dogs, types of food) will be closer together than unrelated ones. This is achieved using two things: image embeddings and dimensionality reduction.
Image embeddings
In short, image embeddings are points in an n-dimensional space (read this post for more info on higher dimensions), in this case, made from chopping off the last layer from ResNet-50, producing a point in 1024-dimensional space.
The benefit of doing all of that than just comparing pixels between two images is that the model (specifically made for classification) only looks for features that would make the classification easier (preserving semantic information). For instance - you have 3 images of dogs, two of them are the same breed, but the first one looks more similar to the other one (eg. matching background). If you compare the pixels, the first and third images would be closer, but if you use embeddings the first and second ones would be closer because of the matching breeds.
Dimensionality reduction
Now we have all these image embeddings that are grouped by semantic (meaning) similarity and we want to visualize them. But how? You can't possibly display a 1024-dimensional scatter plot to someone and for them to understand it. That's where dimensionality reduction comes into play. In this case, we're reducing 1024 dimensions to 2 using an algorithm called t-SNE. Now the scatter plot will be something we mere mortals can comprehend.
Extra visualizations
Here's the scatter plot in HD:
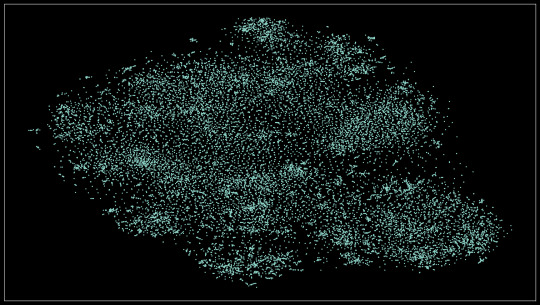
This idea actually comes from an older project where I did this on a smaller dataset (about 8k images). The results were quite promising! You can see how each of the 8 classes is neatly separated, plus how differences in the subject's angle, surroundings, and color.

Find the full-resolution image here
Similar images
I just compared every point to every other point (in the 2d space, It would be too computationally expensive otherwise) and got the 6 closest points to that. You can see when the model incorrectly classifies something if the related images are not similar to the one presented (eg. there's an image of a payphone but all of the similar images are bridges).
Pixel rarity
This one was pretty simple, I used a script to count the occurrences of pixel colors. Again, this idea comes from an older project, where I counted the entirety of the dataset, so I just used that.
Extra visualization
Here are all the colors that appeared in the image, sorted by popularity, left to right, up to down

Some final stuff
MP means Megapixel (one million pixels) - a 1000x1000 image is one megapixel big (it has one million pixels)
That's all, thanks for reading. Feel free to ask questions and I'll try my best to respond to them.
3 notes
·
View notes
Text
Data Cleaning in Data Science
Data cleaning is an integral part of data preprocessing viz., removing or correcting inaccurate information within a data set. This could mean missing data, spelling mistakes, and duplicates to name a few issues. Inaccurate information can lead to issues during analysis phase if not properly addressed at the earlier stages.
Data Cleaning vs Data Wrangling : Data cleaning focuses on fixing inaccuracies within your data set. Data wrangling, on the other hand, is concerned with converting the data’s format into one that can be accepted and processed by a machine learning model.
Data Cleaning steps to follow :
Remove irrelevant data
Resolve any duplicates issues
Correct structural errors if any
Deal with missing fields in the dataset
Zone in on any data outliers and remove them
Validate your data
At EduJournal, we understand the importance of gaining practical skills and industry-relevant knowledge to succeed in the field of data analytics / data science. Our certified program in data science and data analytics is designed to equip freshers / experienced with the necessary expertise and hands-on experience experience so they are well equiped for the job.
URL : http://www.edujournal.com
#data_science#training#upskilling#irrevelant_data#duplicate_issue#datasets#validation#outliers#data_cleaning#trends#insights#machine_learning
2 notes
·
View notes
Text
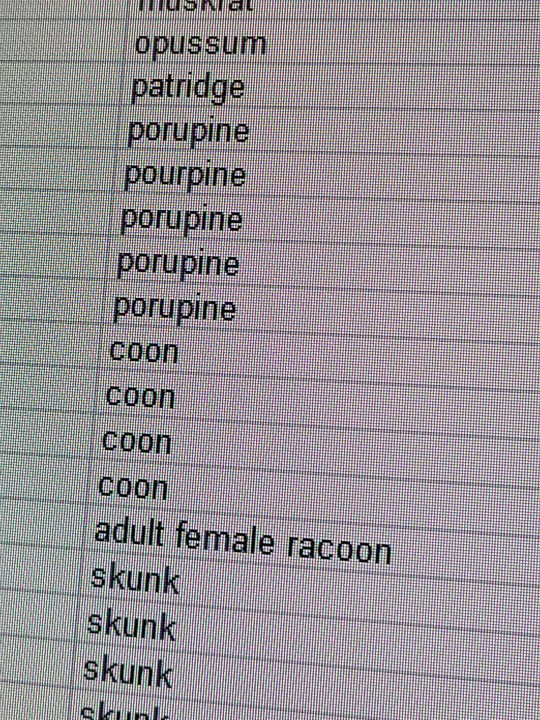
This reminded me of the time I was doing social service for my bachelor's degree.
I'm a biologist. Back then (2007-2008ish, I guess? Don't remember, it's been a while lol) I joined the Ornithology Lab hoping to start my bachelor's thesis early (I did NOT but that's another story lmao). Part of my social service job involved transcribing lots (and I mean LOTS, there were journals dating back to the 80s) of field journals from past students into Excel spreadsheets and then entering the curated info into a special database designed by the Mexican environmental commission (CONABIO) for it to be accessible to other researchers and to add to the national biodiversity repository.
Oh, boy.
The spelling in plenty of those journals was TERRIBLE. And I'm not referring to the questionable spelling of scientific names (which can be truly difficult to memorize and write). I'm talking about the spelling of things like the alpha codes we ornithologists use to abbreviate either the scientific names or the standardized common names in English (HOW DO YOU MISSPELL FOUR / SIX LETTERS???), site identifiers, descriptions, field observations, etc. Heck, there were times when even the names of the observers were spelled differently ON THE SAME PAGE written BY THE SAME PERSON. Had at least one instance where a student regularly spelled his own name wrong and the head of the Laboratory didn't remember which spelling was the correct one, so we had to settle with the most common spelling of that student's name.
Considering all this information was gathered by fellow biology students during field practices (who in all likelihood were making these identifications with the aid of guidebooks and the professors' guidance), one would expect them to be able to write with certain grammatical consistency, as was to be expected of their academic level. But nope.
And yes, I know people can be dyslexic (or have other undiagnosed learning disabilities) and struggle with reading and writing, but some of those journals were written by people who were somewhat bordering on functional illiteracy, which I find truly baffling of people studying for a higher education degree.
Curating all that info was tortuous but I managed. And in the end I completed the mandatory 480 hours (and more!) of the social service necessary for graduation. Good grief, though. Reading OPs post gave me serious war flashbacks 😂
Working on a dataset of roadkill reports. state agency personnel CANNOT spell
#data collection#databases#datasets#fieldwork notes#personal anecdotes#i do miss those days tho#my adhd wasn't nearly as bad as it is right now and working on those datasets was truly stimulating#but sometimes it do be like that#especially when you have to gather information from untrained sources#but it's not the end of the world#oh and by the way#WELL DONE OP#thank you for your service
56K notes
·
View notes
Text
How to Append / Combine two datasets Power BI Desktop Tips and Tricks (6/100)
How to combine two datasets In Power BI, We explained in which business scenario you will combine / Append data in Power BI, … source
0 notes
Text
How Autonomous AI is Revolutionizing Business Workflows Today
The future is now. Autonomous AI agents are reshaping business operations by working independently to solve complex problems, accelerate workflows, and make smarter decisions—freeing humans to focus on creativity, strategy, and growth.
🔍 𝐇𝐨𝐰 𝐀𝐮𝐭𝐨𝐧𝐨𝐦𝐨𝐮𝐬 𝐀𝐈 𝐢𝐬 𝐭𝐫𝐚𝐧𝐬𝐟𝐨𝐫𝐦𝐢𝐧𝐠 𝐭𝐨𝐝𝐚𝐲’𝐬 𝐛𝐮𝐬𝐢𝐧𝐞𝐬𝐬:
✅ 𝐇𝐲𝐩𝐞𝐫-𝐄𝐟𝐟𝐢𝐜𝐢𝐞𝐧𝐭 𝐖𝐨𝐫𝐤𝐟𝐥𝐨𝐰𝐬 AI agents automate repetitive tasks—like scheduling, supply chain adjustments, and compliance checks—running 24/7 without human error or delays.
✅ 𝐑𝐞𝐚𝐥-𝐓𝐢𝐦𝐞 𝐃𝐚𝐭𝐚-𝐃𝐫𝐢𝐯𝐞𝐧 𝐃𝐞𝐜𝐢𝐬𝐢𝐨𝐧𝐬 They analyze vast datasets and provide business leaders with predictive insights and scenario simulations for smarter strategies.
✅ 𝐏𝐞𝐫𝐬𝐨𝐧𝐚𝐥𝐢𝐳𝐞𝐝 𝐂𝐮𝐬𝐭𝐨𝐦𝐞𝐫 𝐄𝐱𝐩𝐞𝐫𝐢𝐞𝐧𝐜𝐞𝐬 From chatbots to virtual assistants, AI agents deliver tailored customer support and recommendations that boost loyalty at scale.
✅ 𝐅𝐚𝐬𝐭𝐞𝐫 𝐈𝐧𝐧𝐨𝐯𝐚𝐭𝐢𝐨𝐧 They track market trends and user feedback, helping teams innovate rapidly and stay ahead of the competition.
✅ 𝐀𝐮𝐭𝐨𝐧𝐨𝐦𝐨𝐮𝐬 𝐂𝐲𝐛𝐞𝐫𝐬𝐞𝐜𝐮𝐫𝐢𝐭𝐲 AI agents detect and respond to threats instantly, learning new attack patterns to keep business data safe.
💡 𝐁𝐢𝐠 𝐏𝐢𝐜𝐭𝐮𝐫𝐞: Autonomous AI agents aren’t replacing humans—they’re augmenting them. Businesses embracing these intelligent partners now are building the agile, efficient enterprises of tomorrow.
📌 𝐓𝐡𝐞 𝐜𝐨𝐦𝐩𝐚𝐧𝐢𝐞𝐬 𝐭𝐡𝐚𝐭 𝐰𝐢𝐥𝐥 𝐰𝐢𝐧 𝐢𝐧 𝟐𝟎𝟐𝟓 𝐚𝐫𝐞 𝐭𝐡𝐨𝐬𝐞 𝐚𝐝𝐨𝐩𝐭𝐢𝐧𝐠 𝐚𝐮𝐭𝐨𝐧𝐨𝐦𝐨𝐮𝐬 𝐀𝐈 𝐚𝐠𝐞𝐧𝐭𝐬 𝐭𝐨 𝐰𝐨𝐫𝐤 𝐬𝐦𝐚𝐫𝐭𝐞𝐫, 𝐟𝐚𝐬𝐭𝐞𝐫, 𝐚𝐧𝐝 𝐦𝐨𝐫𝐞 𝐫𝐞𝐬𝐩𝐨𝐧𝐬𝐢𝐯𝐞𝐥𝐲.
𝐑𝐞𝐚𝐝 𝐌𝐨𝐫𝐞: https://technologyaiinsights.com/
𝐀𝐛𝐨𝐮𝐭 𝐔𝐒: AI Technology Insights (AITin) is the fastest-growing global community of thought leaders, influencers, and researchers specializing in AI, Big Data, Analytics, Robotics, Cloud Computing, and related technologies. Through its platform, AITin offers valuable insights from industry executives and pioneers who share their journeys, expertise, success stories, and strategies for building profitable, forward-thinking businesses.
𝐂𝐨𝐧𝐭𝐚𝐜𝐭 𝐔𝐬: 📞 +1 (520) 350-7212 ✉️ [email protected] 🏢 1846 E Innovation Park DR Site 100, ORO Valley AZ 85755
0 notes
Text
Image Annotation Services: Powering AI with Precision
Image annotation services play a critical role in training computer vision models by adding metadata to images. This process involves labeling objects, boundaries, and other visual elements within images, enabling machines to recognize and interpret visual data accurately. From bounding boxes and semantic segmentation to landmark and polygon annotations, these services lay the groundwork for developing AI systems used in self-driving cars, facial recognition, retail automation, and more.
High-quality image annotation requires a blend of skilled human annotators and advanced tools to ensure accuracy, consistency, and scalability. Industries such as healthcare, agriculture, and e-commerce increasingly rely on annotated image datasets to power applications like disease detection, crop monitoring, and product categorization.
At Macgence, our image annotation services combine precision, scalability, and customization. We support a wide range of annotation types tailored to specific use cases, ensuring that your AI models are trained on high-quality, well-structured data. With a commitment to quality assurance and data security, we help businesses accelerate their AI initiatives with confidence.
Whether you're building object detection algorithms or fine-tuning machine learning models, image annotation is the foundation that drives performance and accuracy—making it a vital step in any AI development pipeline.
0 notes
Text
Medieval Astrology-Web data
Catalogue

Texts

Images
Source websites
0 notes
Text
Greetings, my fellow latent space explorers!
Today’s expedition into the past has yielded an exquisite relic: a 1920 medical book, over 1,400 pages of archaic wisdom and delightfully unsettling illustrations. A tome of knowledge, long since forgotten, yet now ripe for diffusion into the digital ether.
I shall be scanning, digitizing, and releasing this dataset into the wilds of open-source! Ensuring these century-old curiosities may live again through the sorcery of AI. Expect LoRAs for image models, text transcriptions for LLM fine-tuning, and perhaps a few unsettling excerpts to horrify and amuse.
But tell me, fellow explorers, are there any ethical paradoxes lurking in the shadows of this endeavor? Have I overlooked some arcane moral clause in the grimoire of responsible AI?
Let us discuss, lest I accidentally summon something truly cursed.
Aspire to inspire.
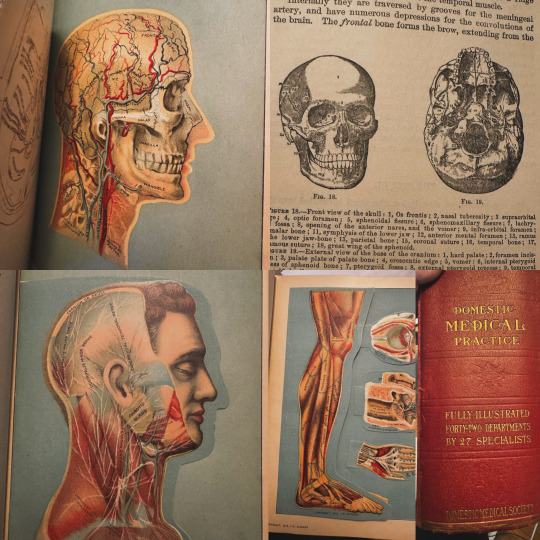


#training data#ai training#vintage books#public domain#ethical ai#datasets#doctor diffusion#open source#ai art community#aiartcommunity#datascience#1920s#ai art#ethics#ai
0 notes
Text
CDC Datasets
Update on the compressed single-file version of the CDC datasets: the ingest to the Internet Archive is now complete, and my redirect has been updated to point there.
You can pull the file from them directly, or use their torrent.
That link again: https://dave.io/go/cdc
0 notes