#$UVXY
Explore tagged Tumblr posts
Visit Tumblr Blog
Explore Tumblr blogs with no restrictions, modern design and the best experience.
Last Seen Tumblr Blogs


Fun Fact
Tumblr’s website traffic is steadily declining.
Text
UVXY: Bullish For The Month Of June
UVXY: Bullish For The Month Of June
0 notes
Text
VIX Death Cross Historically Bullish for S&P 500 over Next 2 Weeks
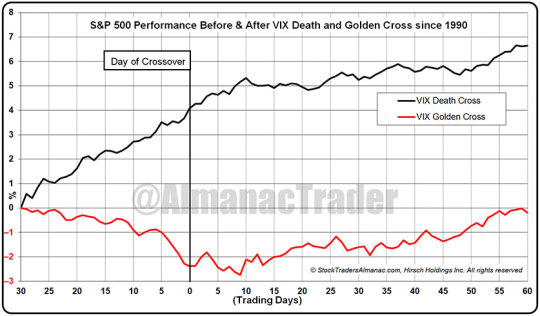
On Friday December 9, a Death Cross appeared on a chart of CBOE Volatility Index (VIX). A Death Cross occurs when the 50 day moving average crosses below the 200-day moving average. When this happens to an individual stock or major index like S&P 500 it is normally considered bearish. But since the VIX is designed to measure near-term market volatility the lower it goes the better the S&P 500 usually performs. Thus, a VIX Death Cross can be a bullish indication.
Going back to 1990, including the most recent cross, there have been 36 VIX Death Crosses. The S&P 500’s average performance 30 trading days before and 60 trading days after the past 35 VIX Death Crosses have been plotted in the following chart. In the 30 trading days prior to the VIX Death Cross, S&P 500 rose an average of 4.1%. This solid advance is what played a large role in the VIX Death Cross as a rising market is normally accompanied by falling volatility and a declining VIX. After the Death Cross, S&P 500 continued to climb another 2.5% over the next 60 trading days.
Also included on the chart are the 35 VIX Golden Crosses. A Golden Cross is just the opposite of a Death Cross, the 50-day moving average crosses above the 200-day moving average as VIX is rising. A VIX Golden Cross is not a good event for S&P 500 as it has typically declined an average 2.4% before the VIX Golden Cross and failed to return to breakeven 60 trading days later.
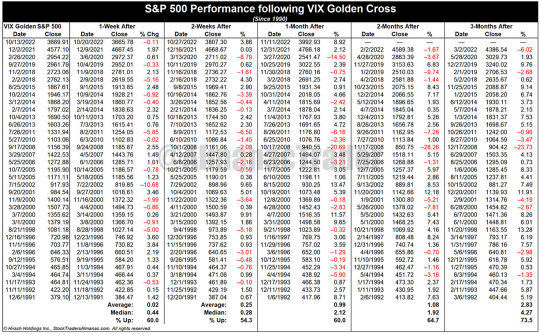
In following tables, we present the S&P 500 performance after past VIX Death Crosses and VIX Golden Crosses across various timeframes. Based upon average performance the near-term, 1-and 2-week S&P 500 performance following a VIX Death Cross is better than a VIX Golden Cross, but by 1-month later and beyond the results are less clear. This would suggest that the current VIX Death Cross is likely bullish in the near-term, but not a great indication much beyond 2-weeks.
Click here for VIX Death Cross Table...

Click here for VIX Golden Cross Table...
4 notes
·
View notes
Text
Volatility Floored

The following post was initially issued to TLS members on May 11, 2018.
The VIX may struggle to move much lower than current levels — and may signal limitations to further stock market gains.
Some folks argue that technical analysis cannot be applied — and therefore should not be attempted — on volatility markets. We actually used to be in that camp but, given the evidence we’ve observed over time, we have changed our tune. We think support and resistance levels, particularly via trendlines, have been readily identifiable on many occasion. And one pretty significant signal in that regard may be in the works at the moment.
Since its high in 2015 (coinciding with the S&P 500 low), we’ve seen a discernible downtrend in the VIX (S&P 500 Volatility Index). Not only that, but the intermittent VIX peaks over that time serve to form a nearly pristine Down trendline on the chart. Now, it seems that the likelihood of such a clean trendline forming at random is nearly inconceivable. However, we’ll let pundits and philosophers opine on the topic of TA and volatility charts. We are operating under the assumption that recent action is notrandom — and that such analysis can assist us, at times, in our stock market decision-making. One of those times, again, may be now.
As the chart shows, the VIX did finally break above its post-2015 Down trendline in late January/early February of this year. After its subsequent spike into early February, the VIX settled back down. Where did it find support? Right on the top of the broken post-2015 Down trendline on March 9. While it was bouncing firmly off of that support, stocks were, at the same time, stalling out, eventually turning back down to test its February correction lows.
Following the VIX’s bump up in volatility into April, it has settled back down again. And presently, as stocks have bounced again, we find the VIX once again nearing a test of that broken post-2015 Down trendline.

As it did in March, the trendline may provide nearby support for the VIX. If successful, that may also serve as a signal that further upside in stocks may be tough to come by in the near-term.
Obviously, only prices will tell the story, but one reason we look at other indicators, e.g., breadth, sentiment, etc., is because price is not predictive. Other metrics can help us anticipate what prices are likely to do going forward. And at the present time, potential VIX support may again be signaling a possible roadblock, or pause, in the current stock market bounce. At a minimum, that would have us holding off on chasing stock prices higher. They certainly may end up moving higher, but the risk/reward prospects of buying stocks right here would not appear to be too favorable.
If you’re interested in the “all-access” version of our charts and research, please check out our new site, The Lyons Share. You can follow our investment process and posture every day — including insights into what we’re looking to buy and sell and when. Plus, our SPRING SALE (25% OFF!!) is going on now so it’s a great time to sign up! Thanks for reading!
_____________
Disclaimer: JLFMI’s actual investment decisions are based on our proprietary models. The conclusions based on the study in this letter may or may not be consistent with JLFMI’s actual investment posture at any given time. Additionally, the commentary provided here is for informational purposes only and should not be taken as a recommendation to invest in any specific securities or according to any specific methodologies. Proper due diligence should be performed before investing in any investment vehicle. There is a risk of loss involved in all investments.
1 note
·
View note
Text
vix options trading hours Tennessee Again, you almost have to treat these like binary trades as well.

Post Outline
vix options trading hours Tennessee (For the record, I don't usually trade biotech's because of all these wild card factors)Putting it all TogetherRelative sizing is one of the toughest things to get right as an investor or trader.
options trading school in india Tennessee Each contract on a stock will have an expiration month, a strike price and a premium - which is the cost to buy or short the option.
weekly options trading advisory Tennessee So where did our option investor go wrong?
options trading school franchise in india Tennessee One great takeaway from reading books is that you can also learn more about the hidden trading factors you don't see everyday like investor psychology or market psychology.
options trading practice program Tennessee I size the trade to represent my max risk and play the odds.
best learn options trading course Tennessee This piece will mostly focus on the buy side on the market and the trading strategies used.
trading spy options Tennessee 00 (the value of the spread minus the premium collected multiplied by the number of contracts times the multiplier).
the ultimate guide to the world of options trading Tennessee Investors can put themselves at a terrible disadvantage simply by sizing their positions incorrectly.
vix options trading hours Tennessee Choose an Option Trade That You Love and Master ItA great way to improve your options trading is by mastering a bread and butter trade.
option and stock bid/ask spreads widen. Always play out a worse-case scenario in your head and try to calculate what the damage could be. For example, the value of the spread when the investor got out was $0. 93. but good luck getting out that price. most likely they would have had to pay up to exit the trade. Sometimes the theoretical or mid-market price of an option. is just that.
For example, the value of the spread when the investor got out was $0. 93. but good luck getting out that price.
youtube
Critical Thoughts:
options auto trading newsletter Tennessee
how to make money trading options Tennessee
options swing trading picks Tennessee
trading options greg harmon pdf Tennessee
listed equity options stop trading at Tennessee on 8/4/14 the 30-day option volatility went down to 132.
UVXY is the PROSHARES Ultra VIX Short-Term Futures ETF. It attempts to replicate, net of expenses, twice the return of the S&P 500 VIX Short-Term Futures index for a single day. On 7/31/14, UVXY was trading at $31. 70. Let's assume on that day an option investor sold 20 $36/$39 call spreads (expiring 8/8/14). collecting a premium of $0. 57 or a total $1140 (minus fees and commissions). Their goal is to get out of the position when the premium of the spread reaches $0.
best binary options trading program Tennessee Even if you think you've got time on your options.
If you notice, it's the same analysis for both types of trades.
best course for futures and options trading Tennessee You are bearish when you buy or are long put options.
Trading The Option - The market either declined, which raised the premium or the market rose and you are just looking to get out before losing all of your premium. Conclusion BasicsTrading Options carries nice leverage because you do not have to buy or short the stock itself, which requires more capital. They carry 100% risk of premiums invested. There is an expiration time frame to take action after you buy options. Trading Options should be done slowly and with stocks you are familiar with. I hope you learned some of the basics of options buy side trading, investing and how to trade them. Look for more of our articles. American Investment Training. Why Size Matters - Especially In Options TradingIn my previous article I wrote about how style drifting could kill your trading account. It's a must read in my opinion. Today, I want to talk to you about another major blunder new (and even experienced) investors make. Like style drifting, it can do a lot of damage to one's account. What am I referring to?Investors can put themselves at a terrible disadvantage simply by sizing their positions incorrectly. This usually occurs when their position is too big relative to the risk and account size. The key to getting the relative sizing correctly is understanding the risks associated with the position. Let me walk you through a likely trade scenario an investor not familiar with relative sizing might make. For example, let's say on 7/31/14 an investor looking to take advantage of a short term move. sold call spreads in UVXY. UVXY is the PROSHARES Ultra VIX Short-Term Futures ETF. It attempts to replicate, net of expenses, twice the return of the S&P 500 VIX Short-Term Futures index for a single day. On 7/31/14, UVXY was trading at $31. 70. Let's assume on that day an option investor sold 20 $36/$39 call spreads (expiring 8/8/14). collecting a premium of $0. 57 or a total $1140 (minus fees and commissions). Their goal is to get out of the position when the premium of the spread reaches $0.
trading weekly options on friday Tennessee 1%Pretty wild.
UVXY is the PROSHARES Ultra VIX Short-Term Futures ETF. It attempts to replicate, net of expenses, twice the return of the S&P 500 VIX Short-Term Futures index for a single day. On 7/31/14, UVXY was trading at $31. 70. Let's assume on that day an option investor sold 20 $36/$39 call spreads (expiring 8/8/14).
best options trading course reddit Tennessee 63%.
57 or a total $1140 (minus fees and commissions).
sk options trading Tennessee Trading The Option - The market either declined, which raised the premium or the market rose and you are just looking to get out before losing all of your premium.
Read Books on Options TradingTechnically, they don't have to be all about options trading since there is overlap in every investment book. The goal is to learn different approaches to trading the market. You'll learn about things you have not known about before and you'll even be able to refine your original trading strategy. One great takeaway from reading books is that you can also learn more about the hidden trading factors you don't see everyday like investor psychology or market psychology. Did you know that these psychologies are the reason why technical analysis exist?3. Streamline Your Technical AnalysisIf you are looking at 6+ more technical indicators and use multiple technical analyses concepts against other technical analyses concepts, then you're probably doing yourself a disservice. Simply learn and use the basics like MACD, support/resistance, trending channels, divergence/convergence, and moving averages. 4. Continue to Paper TradeJust because you are trading real money it doesn't mean you need to stop learning and trying out different strategies. You have to continue playing the market from all angles. If you are a market conformist (you tend to go with the trend), you can try a contrarian strategy.
earnings options trading course Tennessee option and stock bid/ask spreads widen.
60 x the multiplier of 100 shares = $4,860However, the option investor is only willing to risk $1,000 on the position on a $50,000 portfolio.
Important Techniques:
stock options trading course Tennessee
best options trading service Tennessee
best options trading platforms Tennessee
options swing trading picks Tennessee

2 notes
·
View notes
Text
When Your Uber Driver Tells You To Sell Naked Put Options…
I’ve written some here about the “short vol” trade, it’s various forms, how it’s grown in popularity and how it potentially poses a systemic risk to the markets. Earlier today I shared a related story on @twitter and got a very interesting response:
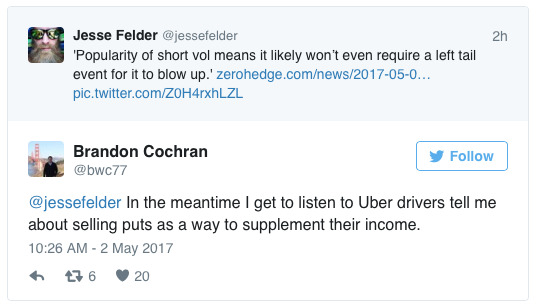
It immediately made me think of Bernard Baruch’s famous description of the days leading up to the 1929 crash:
Taxi drivers told you what to buy. The shoeshine boy could give you a summary of the day’s financial news as he worked with rag and polish. An old beggar who regularly patrolled the street in front of my office now gave me tips and, I suppose, spent the money I and others gave him in the market. My cook had a brokerage account and followed the ticker closely. Her paper profits were quickly blown away in the gale of 1929.
What’s different today is taxi/uber drivers aren’t just buying stocks on leverage, they’re essentially selling insurance against a decline in the stock market. The trouble is, “The more people write financial insurance, the more likely it is that a disaster will happen,” as Victor Haghani, a partner at Long-Term Capital Management, puts it. And by the time the trade has become so popular that your uber driver is talking about it a “disaster” might already be unavoidable.
5 notes
·
View notes
Link
156 notes
·
View notes
Text
Lead-Lag Relationship Between VIX ETPs and VIX Futures
VIX ETPs, such as the VXX, are exchange-traded products designed to track the performance of the CBOE Volatility Index (VIX). The VIX is a measure of the expected volatility of the S&P 500 index over the next 30 days, and it is often referred to as the "fear index" because it tends to rise during periods of market stress and uncertainty. VIX ETPs enable investors to gain exposure to the spot VIX without having to trade futures contracts or options, which can be complex and require a high level of expertise.
Similarly, VIX futures also allow investors to trade the VIX index. They are listed on the CBOE Futures Exchange and can be used by investors for hedging against market volatility or for speculating on market movements. Like other futures contracts, VIX futures are settled in cash on the expiration date, and their value can fluctuate significantly based on market conditions and investor sentiment.
Reference [1] examined the lead-lag relationship between VIX ETPs, VIX futures, and the spot VIX. The authors pointed out,
Studies of high-frequency lead-lag relations reveal that all the 1x long, 1x inverse and 2x leveraged ETPs studied all lead VIX, regardless of whether markets are in contango or backwardation. As with VIX Futures, VIX ETPs also predict VIX. The lead-lag relations with VIX Futures are less obvious, similar to the findings of Bollenet al. (2017). However, we find that term structure of volatility has a significant impact on lead-lag relations between VIX Futures and ETPs. When the market is in backwardation, VIX ETPs tend to lead Futures more often, and particularly VXX and UVXY which lead in the majority of such days. Moreover, the duration of lead-lag relations can be 1–2 min when ETPs lead and lead-lag relations are statistically significant, suggesting that arbitrage opportunities might be possible.
In short, VIX ETPs, like VIX futures, also lead the spot VIX. The relationship between VIX ETPs and futures, on the other hand, is less obvious. VIX ETPs lead VIX futures only when the market is in backwardation.
Even though the authors suggested that VIX ETP-futures arbitrage is possible, we note that the opportunity is short-lived. Therefore, one would need to invest heavily in infrastructure to be able to exploit it.
Let us know what you think in the comments below or in the discussion forum.
References
[1] Michael O'Neill, GulasekaranRajaguru, Causality of price movements in VIX exchange-traded products and VIX futures contracts, Journal of Accounting Literature, April 2023
Post Source Here: Lead-Lag Relationship Between VIX ETPs and VIX Futures
from Harbourfront Technologies - Feed https://harbourfronts.com/lead-lag-relationship-vix-etps-vix-futures/
0 notes
Text
VIX and Volatility Have Historically Increased August through October
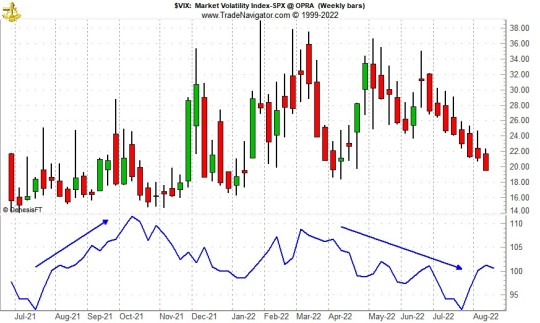
Historically speaking, the CBOE Volatility Index (VIX) tends to reach its seasonal low in late-July or early August and slowly begin climbing towards its seasonal high, usually in the month of October. This may be due to the fact that the two worst performing months of the year, August and September (by average performance) precede it. VIX’s seasonal pattern can be seen in the following chart.
October’s volatility peak is also visible when closing daily percent changes are analyzed. October has hosted the most daily moves in excess of 1%, 2%, 3%, 5%, 7% and even 10% since 1930. Do not fret over the ten times S&P 500 has moved more than 10% in a single day. Six of the ten occurrences were way back in the 1930’s. Only four have occurred more recently and out of those, two were actually positive days (10/13/2008 +11.58% and 10/28/2008 +10.79%). Only three of the ten days with moves in excess of 10% were negative days: 3/18/1935 –10.06%, 10/19/1987 –20.47% and 3/16/2020 –11.98%.
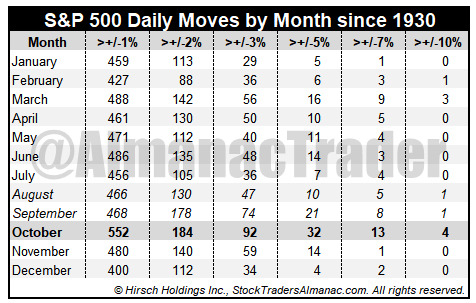
Putting all but the +/-1% moves table data into a bar chart adds a quick confirmation of October’s heightened volatility versus all other months. Volatility’s trend can also be observed as the frequency of sizable daily moves tends to decline from March through July then an increase in August lasting until October.

3 notes
·
View notes
Text
VXX, UVXY and LABU among weekly ETF movers
VXX, UVXY and LABU among weekly ETF movers Source link
View On WordPress
0 notes
Text
1/23/23 TRENDS
$HLBZ $MULN $PHIL $GNS $VERB $GROM $KYNC $RGBP $WISA $BOMO $DPLS $CFRX $NSAV $APRN $SBFM $OZSC $INBS $NUWE $NLST $BRYYF $META $UBQU $BOXD $PALI $SPY $HMBL $VPER $AMZN $SYTA $AMV $XELA $SNMP $BOIL $TSLA $THMO $UVXY $MARA $LOCL $ICNM $SGML $ANPC $FERN $AVXL $AXSM $CETYD $ARDX $MGOL $GVSI $WDLF $TCRX Check out our Free Penny Stock Screener HERE. http://dlvr.it/ShLNYy
0 notes
Text
RT @GenesisVol: Right there with you fren... my long BITO calls 😅 ouch... UVXY downside working though... And I still think VIX and /VX have major downside https://t.co/J5R6JU8bwA
RT @GenesisVol: Right there with you fren… my long BITO calls 😅 ouch… UVXY downside working though… And I still think VIX and /VX have major downside https://t.co/J5R6JU8bwA
RT @GenesisVol: Right there with you fren… my long BITO calls 😅 ouch… UVXY downside working though… And I still think VIX and /VX have major downside https://t.co/J5R6JU8bwA — Patrick Rooney (@patrickrooney) Aug 4, 2022 https://platform.twitter.com/widgets.js from Twitter https://twitter.com/patrickrooney
View On WordPress
1 note
·
View note
Text
2017: A Record Smooth Ride For Stocks

As measured by the VIX, stocks have never enjoyed a less volatile year than 2017.
In this week’s posts, we’ll be looking back at the key developments and characteristics that defined the past year in financial markets. And undoubtedly the most notable phenomenon of 2017 was the extremely smooth ride enjoyed by U.S. stocks — unprecedented, in fact. One way to measure just how smooth (or volatile) the market was is by looking at the readings of stock volatility expectations, in this case the S&P 500 Volatility Index, aka, the VIX. And based on VIX readings, 2017 was the least volatile year ever in the stock market.
Specifically, the average daily closing price of the VIX in 2017 was 11.10 (through 12/26/17). That is the lowest of any year — by more than one and a half points — since the VIX inception in 1986 (by comparison, the “average yearly average” is over 20).

Furthermore, as the chart states, the maximum level reached by the VIX in 2017 was 17.28. That is the lowest maximum level attained in any year since inception — and 60% lower than the “average yearly max”. Obviously 2017 was an extraordinary year in its lack of stock volatility.
That’s interesting, but it’s also history at this point. What does it mean, if anything, for 2018? Are stocks now due for some serious volatility reversion?
Well, certainly stock market bulls cannot reasonably expect the unprecedentedly smooth ride to continue forever. Volatility levels were so far below historic norms that some increase should materialize in this next year. However, there is no reason that the relative low-volatility environment cannot persist further. There is no law suggesting that an imminent spike in volatility is likely. In fact, in our view, at this point it is more likely that the low volatility will continue in the near to intermediate-term.
Eventually, storm clouds will gather and the stock market seas will get choppy again. But for now, it is smooth sailing for investors.
Wondering when volatility will return? Check out our “all-access” service, The Lyons Share. When we begin to see the signs of a potential volatility uptick, or elevated risk in the stock market, TLS members will be the first to know. Also, sign up by January 1 and save 20% off an Annual Membership during our Holiday Sale. Considering the sale price — and the unlikelihood that this unprecedentedly smooth investment ride can continue — there has never been a better time to reap the benefits of this service. Thanks for reading!
_____________
Disclaimer: JLFMI’s actual investment decisions are based on our proprietary models. The conclusions based on the study in this letter may or may not be consistent with JLFMI’s actual investment posture at any given time. Additionally, the commentary provided here is for informational purposes only and should not be taken as a recommendation to invest in any specific securities or according to any specific methodologies. Proper due diligence should be performed before investing in any investment vehicle. There is a risk of loss involved in all investments.
1 note
·
View note
Text
Maio foi um mês marcado por alta volatilidade nas bolsas de valores do mundo todo, brasileiros compraram ações de grandes companhias e se desfizeram de penny stocks. O movimento vai de encontro ao momento do mercado, que tem preferido nomes de maior qualidade e com alta lucratividade a teses mais especulativas. Além disso, nomes maiores, ainda que não lucrativos, podem oferecer valuations mais atrativos nesse momento de aversão a risco. Levantamento realizado pela fintech Stake, plataforma que conecta pessoas de diferentes países ao mercado de ações americano, mostra que os investidores brasileiros compraram ações da Tesla, Apple, Amazon e Coca-Cola; e venderam penny stocks como da Hycroft Mining, Eve Holding, Swvl Holdings e Chimerix. As duas exceções foram as ações do Nubank - promovida a penny stock devido à derrocada após o IPO - e da Molecular Data Inc, companhia de e-commerce de produtos químicos na China, que contou com grande volume de compras de investidores brasileiros no mês de maio. Em relação aos ETFs mais negociados, vimos grandes volumes de compra no Direxion Daily Brazil Bull 2x Shares ETF, que investe no Ibovespa em dólares com alavancagem de 2x e se valorizou 14,12% no mês de maio. Também houve muitas compras de investidores no ProShares UltraPro Short QQQ ETF, que aposta na queda da Nasdaq com alavancagem de 3x. Fora isso, o investidor brasileiro segue apostando na alta do S&P 500 através do IVV, VOO e SPY, adquirindo ativos de proteção como o UVXY e VXX, procurando dividendos através do Global X SuperDividend ETF e investindo em imóveis via o Vanguard Real Estate ETF, a despeito de um dos piores meses para o setor imobiliário americano em anos. Confira a lista de ativos mais negociados por investidores brasileiros na Stake no mês de maio abaixo: Ranking de Maio Ações ETFs 1º Hycroft Mining Holding Corporation - HYMC ProShares Ultra VIX Short-Term Futures ETF - UVXY 2º Tesla, Inc. - TSLA Direxion Daily Brazil Bull 2x Shares ETF - BRZU 3º Apple Inc. - AAPL Vanguard S&P 500 ETF - VOO 4º Nu Holdings Ltd. - NU ProShares UltraPro Short QQQ ETF - SQQQ 5º Eve Holding, Inc. - EVEX Vanguard Real Estate ETF - VNQ 6º Amazon.com, Inc. - AMZN iShares Core S&P 500 ETF - IVV 7º Swvl Holdings Corp. - SWVL Invesco QQQ ETF - QQQ 8º Chimerix, Inc. - CMRX Global X SuperDividend ETF - SDIV 9º Molecular Data Inc. - MKD iPath Series B S&P 500 VIX Short-Term Futures ETN - VXX 10º The Coca-Cola Company- KO SPDR S&P 500 Trust ETF - SPY
0 notes
Text
best stocks for options trading 2022 Tennessee Even if you think you've got time on your options.

Table of Contents
best stocks for options trading 2022 Tennessee traders will buy 20 or 30 contracts under the same risk parameters.
home options trading course nitroflare Tennessee I'll explain my reason a little bit later.
trading options explained Tennessee Simply learn and use the basics like MACD, support/resistance, trending channels, divergence/convergence, and moving averages.
oex options trading Tennessee Document and Learn From Your Previous TradesEvery trade is a learning experience.
what is trading options Tennessee 00 (the value of the spread minus the premium collected multiplied by the number of contracts times the multiplier).
books on options trading Tennessee You are bearish on the shares or perhaps the sector that the company is in.
basic options trading Tennessee Successful traders DO NOT make random decisions.
billy williams options trading course Tennessee During periods of high volatility.
best stocks for options trading 2022 Tennessee This increase in premiums allows for the investor to trade the option in the market for a profit.
This also includes knowing everything related to them like expiration dates to where they are found on basic option tables.
Conclusion BasicsTrading Options carries nice leverage because you do not have to buy or short the stock itself, which requires more capital. They carry 100% risk of premiums invested. There is an expiration time frame to take action after you buy options. Trading Options should be done slowly and with stocks you are familiar with. I hope you learned some of the basics of options buy side trading, investing and how to trade them. Look for more of our articles.
youtube
Critical Techniques:
professional options trading course by online trading academy Tennessee
options trading tutorial Tennessee
trading naked put options Tennessee
the options course high profit and low stress trading methods Tennessee
delta options trading Tennessee 1 means One option contract representing 100 shares of PKT.
collecting a premium of $0. 57 or a total $1140 (minus fees and commissions). Their goal is to get out of the position when the premium of the spread reaches $0. 29. in which they would be buying back the spread for a profit of $560. Taking profits at 50% of the premium collected is a great level to exit.
the options course high profit and low stress trading methods Tennessee Learning to trade puts or understanding them starts with market direction and what you have paid for the option.
You see, it's important to have some kind of perspective and understanding of the stock or ETF you're trading.
trading options master course ebook pdf Tennessee Those who bought option premium will see the value of those options lose a lot of value because of the volatility crush.
I size the trade to represent my max risk and play the odds. For example, if I were to put on this trade and was risking $1,000 on the trade. I'd sell 4 call spreads which would have a max risk of $972. I'm not a proponent of stopping out of short premium trades. As you know, most options expire worthless. However, there are cases where outliers occur and short premium trades go ITM and end up being losers. By sizing my trades according to the amount I'm willing to lose. I'm not really stressed about any large overnight moves or morning gaps. You see, I've already outlined my line in the sand. In fact, this is one of the problems that I have noticed with those that use option strategies like iron condors. Now, I'm extremely disciplined about following my rules. I know that if option volatility isn't elevated (or rich). it doesn't make sense to add on more risk (to receive a greater premium) because that's how potentially big losses can occur. Some of my clients achieve a great deal of success after a few weeks of learning my simple rules-based approach. However, when some tell me their profits, relative to their account size. I won't hesitate to let them know if they're taking on too much risk and sizing poorly. Of course, some listen. but others will still size up to big.
risks of options trading Tennessee This means, they have a strategy to get into a trade, make adjustments, and exit positions based on SPECIFIC events.
This article will focus on stock options vs. foreign currencies, bonds or other securities you can trade options on. This piece will mostly focus on the buy side on the market and the trading strategies used. What is a Stock OptionAn option is the right to buy or sell a stock at the strike price. Each contract on a stock will have an expiration month, a strike price and a premium - which is the cost to buy or short the option. If the contract is not exercised before the option expires, you will lose your money invested in your trading account from that contract. It is important to learn that these instruments are riskier than owning the stocks themselves, because unlike actual shares of stock, options have a time limit. There are 2 types of contracts. Calls and Puts and How to trade them and the basics behind them. What is a Call Option and how to trade them?A call option contract gives the holder the right to buy 100 shares of the stock (per contract) at the fixed strike price, which does not change, regardless of the actual market price of the stock. An example of a call option contract would be:1 PKT Dec 40 Call with a premium of $500.
best online course for options trading Tennessee After a few trades, you'll begin to recognize key characteristics to why some trades win and why some trades lose.
Learn all the ins and outs of your practice by back-testing historical data, testing current conditions using paper trades, and reading about your favorite trade in books.
simple options trading for beginners Tennessee You see, I've already outlined my line in the sand.
43 x 20 = $48. 60 x the multiplier of 100 shares = $4,860However, the option investor is only willing to risk $1,000 on the position on a $50,000 portfolio. They will buy back the spread for a loss if it gets close to $1. 05. On 7/31/14, the UVXY exploded. moving up more than 16% and closed at $31. 70. The investor felt that this was a good time to sell some premium as the UVXY has a history of sharp moves up followed by sharp declines. Well, on 8/1/14, UVXY continued to climb higher as fears escalated both geopolitically and within the US equity market. It finished the day up nearly 10% and closed at $34. 73. The value of the spread closed at $0. 93. Although the investor was looking at a paper loss of $720, they decided to get out of the position. if UVXY gapped up on the following Monday, it would probably get past the amount they were willing to lose. (Note: UVXY is a product I wouldn't personally sell call spreads on.
options trading forum Tennessee I know that if option volatility isn't elevated (or rich).
10 expiring in an hour. those options that I bought back ended up closing deep ITM. Again, near-term options have the potential from being deep OTM to deep ITM very quickly (and vice-versa). Position sizing is critical for near term options. it doesn't matter if you're buying or selling premium. In many cases, if I do buy premium on an option expiring in a short time frame.
Key Concepts:
options pop trading alerts reviews Tennessee
best options trading Tennessee
options trading course for beginners reviews Tennessee
best options trading Tennessee

1 note
·
View note