Just an ordinary person here with big dreams. Will post art here and things to do with life.
Don't wanna be here? Send us removal request.
Photo
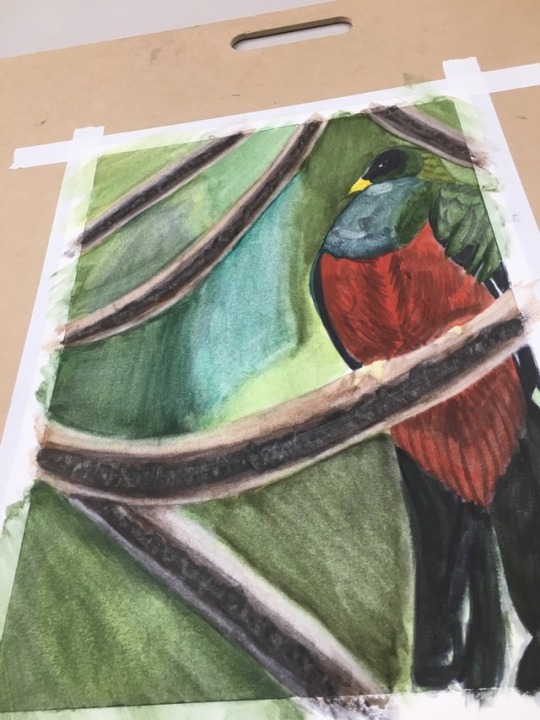
And here is my most recent completed work. It is a Quetzal which I did see in the Houston Zoo, but put in a outdoor environment. I would have done more with it, but it is on student grade paper.
1 note
·
View note
Photo
Actually, this is an inflated number. How search engines work, since this would be under the same guidelines, is it searches for those terms. So if you just search “Native American” you will also get inspired pieces and pieces simply describing what is on the painting, as was one case I found on the first page. I did the legwork for everybody.
Searching “Native American” yields 168,183 results as of April 16, 2018. This includes people who do not claim to be Native American.
Searching “Authentic Native American” yields 4,077 results as of April 16, 2018. These are the people claiming the items were made by a Native American. I do not know how many are false, as that would require a knowledge of provenance and provenience. Which just means I would need to know who owned it and where it was originally found or made.
So that leaves 164,106 who do not immediately claim that the items were made by a Native American. So, the Facebook post was a bit inaccurate.
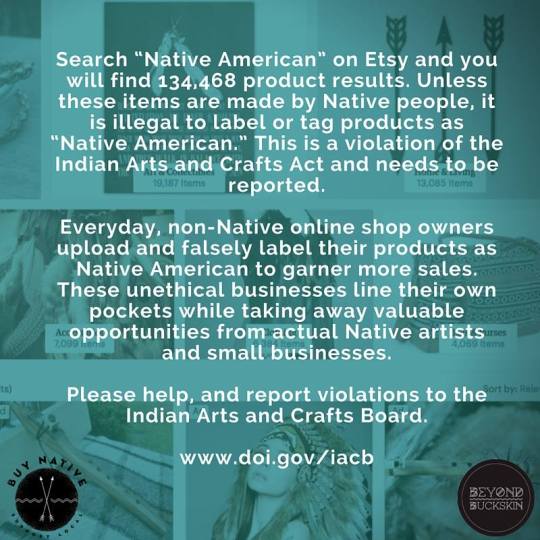
Found this on Facebook! BOOST!
Tell Etsy that #ThisIsNotNative
199K notes
·
View notes
Photo
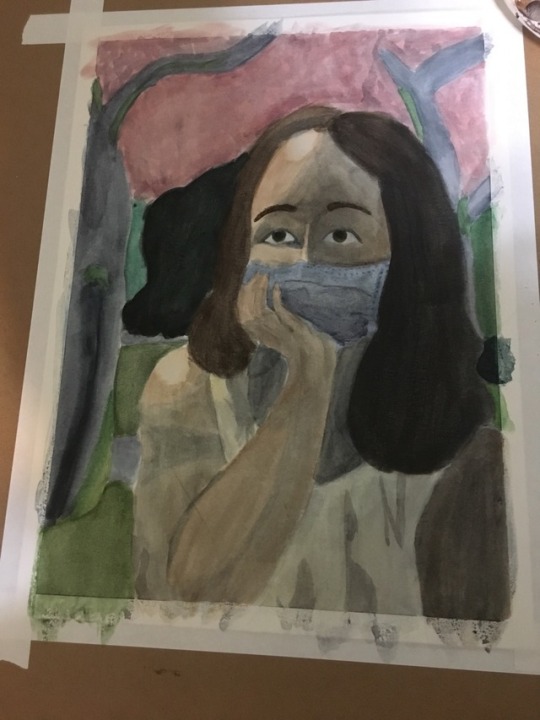
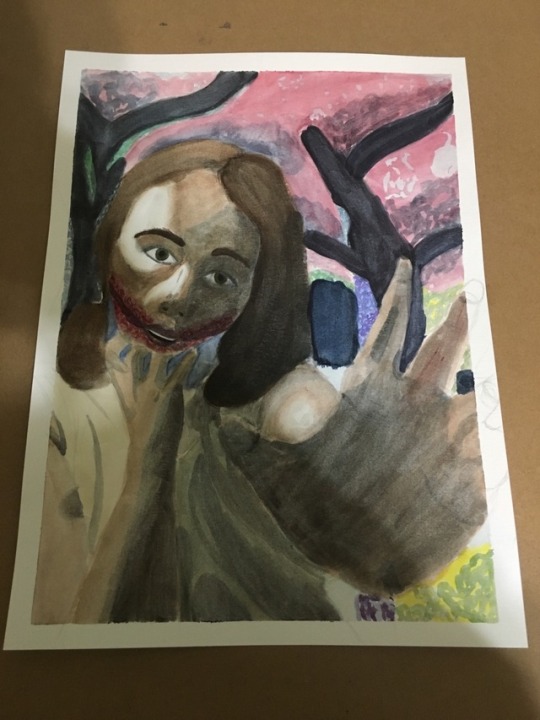
My next two watercolors were a bit on the challenging side. I was inspired by Kuchisake-Onna, or the slit mouthed woman. This time, I decided to start with shading. I also titled these. They are "Am I Pretty?" and "How About Now?" part of "You Are Average." I will be selling these soon, both these originals and prints.
2 notes
·
View notes
Photo
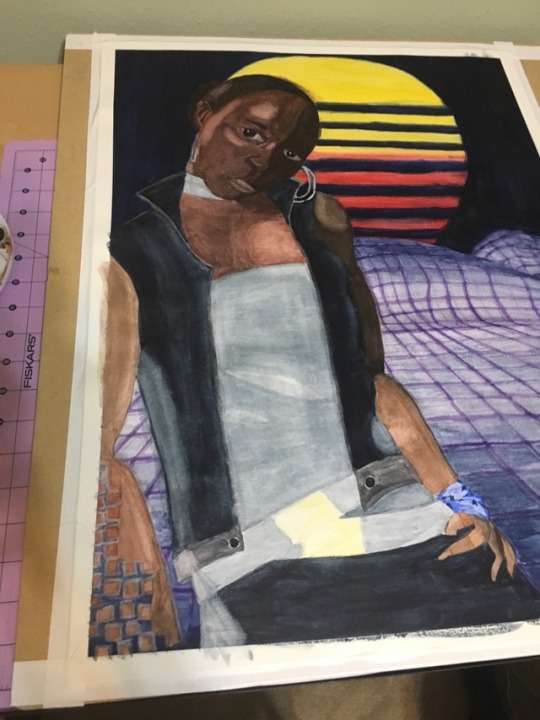
The third watercolor, and my first portrait. It is of my boy friend's mother, who likes the 80s. So, I used an 80s background and used Storm from that time period, since she liked the character.
0 notes
Photo
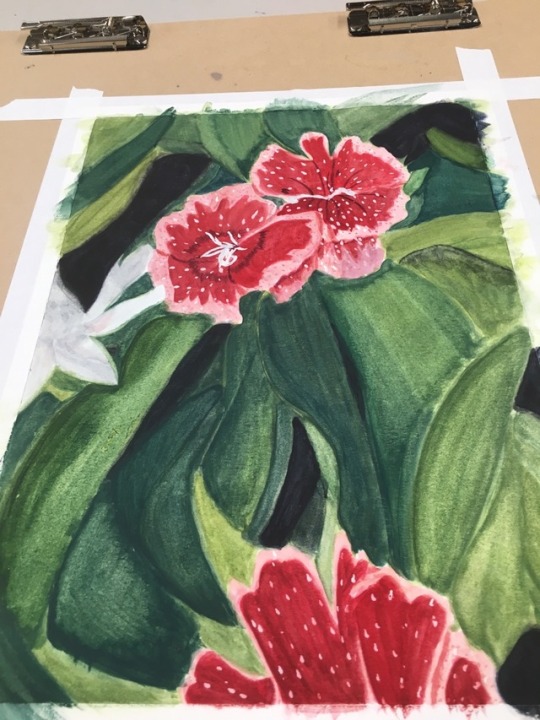
Here is my second one. It is of flowers my Mom and I found at a garden center. It is being given to my parents, too.
1 note
·
View note
Photo
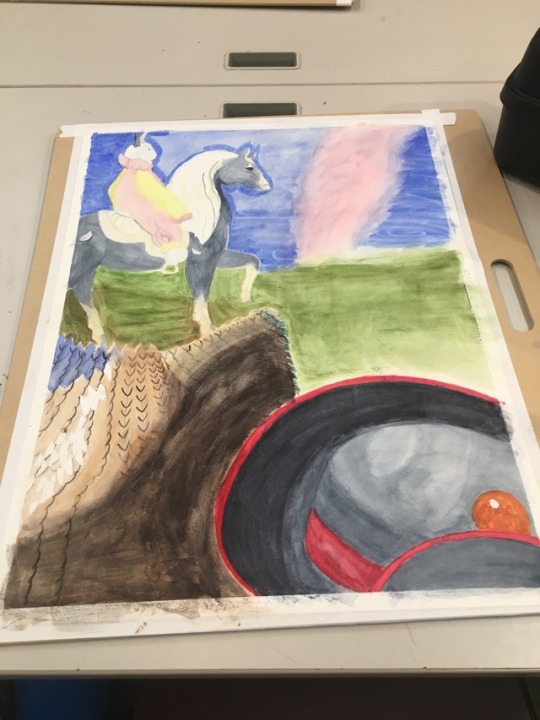
I've been getting into watercolor lately, and I'm currently in a class for it. It started back in January, so I'll be posting my progress so far and in the future. To start off with, we all did a still life. This is my result and, looking back at it, it was decent. But I will say that I've improved since then. Also, this is an older photo, a WIP in fact, since one cat decided to chew on the corner.
2 notes
·
View notes
Text
So, I got the results for AncestryDNA, and now I can post about them. What I found out, my ancestors were all from Europe, with the majority from Britain and Ireland.
Now for the specifics. I will be leaning more towards the 23andMe results than the AncestryDNA results, as they are far closer to reading the full DNA than the other, 99.9% vs 98% with two percentages unspecified. It is also more thorough with listing exactly where the DNA can be traced. However, most of the results were very close to one another, save for the Iberian Peninsula. So, my recommendation is 23andMe if you can afford it, but AncestryDNA is a good fall back if you can’t. Just don’t expect the two to be exactly the same. The results will be posted under the cut.
23andMe Results
93.9% Northwestern
35.9% Irish and British
27.6% French and German
5.6% Scandinavian
24.8% Broadly Northwestern Europe
2.5% Southern Europe
1.2% Italian
0.8% Iberian
0.6% Broadly Southern European
1.9% Eastern European
1.6% Broadly European
AncestryDNA Results
Europe West: 29%
Great Brittain: 26%
Irelnd/Scotland/Wales: 21%
Scandinavia: 15%
Iberian Peninsula: 4%
Europe East: 2%
European Jewish: <1%
Finland/Northwest Russia: <1%
6 notes
·
View notes
Text
So, I just got the results from 23 and Me. I won’t be going over the ancestry part, since I am still waiting on the Ancestry DNA results to compare with. However, I can say that there are some differences between what the DNA says and what I acutally look like. For example; it says I am more likely to have light colored eyes, but I have hazel eyes. They also found no health related variants, so no carrier status for any diseases. I also have fewer neanderthal variants in my dna than 83% of the other customers, it making up 4% of my dna.
Another thing I will note is how fast it was compared to the Ancestry DNA process. However, I can’t say precisely how fast they are when compared to each other, as the ancestry dna results are still pending.
0 notes
Text
A little promotion for El Gato Coffeehouse
So, I have always had cats in my life. However, the two cats I grew up with died within 6 months of each other. I loved them and there is no way to replace them. But my dad just seemed to go into a spiral of depression or something since Ollie died in December. He had degenerative nerve disease and we knew he wouldn't last long.
But this post is not about that. Well, not entirely. In Houston, there is a place called El Gato Coffeehouse, a cat cafe with connections to the humane society. So, yes, every cat there is adoptable. Tickets into it are $10 per adult, and you have to buy food and drink separately. You spend an hour there and you can adopt the same day. Adoptions are $75, and they allow you up to 30 days to adopt a second cat for free. So, we got two cats. We all fell for them and I will say that dad seems a lot happier. I will also say that this cat cafe is a wonderful idea and I wish more like this would spring up. And a dog one would be nice, too.
Now, here are the new members of the family:
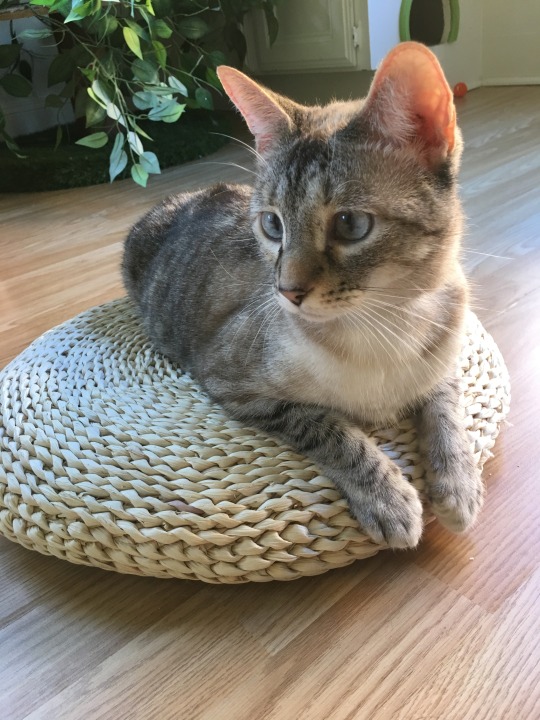
Here is Kinoki! She is a Siamese mix who is 3 years old. She prefers dark rooms, but will come out at night to say hello. She absolutely loves attention and one touch will get her purring and kneading, and continual petting will get her drooling. She is the one who decided that my bed was best. So I wake up to her on the morning. She will also stand on her hind legs to get pet.

This is Echo, formally Harvey, who is 3 months old. Unfortunately, I don't really have a good picture of her. I believe she is an American Shorthair. She also loves people, just not to the extent of drooling. She is also the most active in the morning and sunset. Her favorite toys are anything that crinkles. She isn't quite used to Kinoki, though.
We have them both down for a visit to the vet tomorrow. Echo has the sniffles, and we want to make sure everything is alright with them. It is always recommended to bring new cats to the vet 3 days after you get them.
1 note
·
View note
Text
There is a little experiment I’m doing based on the DNA ancestry companies that I know of. Now, here’s a little backstory before I continue. I told those who I was close to about my interest in 23 and Me, a company that does track ancestry through DNA. It won’t tell you who your ancestors were, but it will tell you where you come from. However, it is a little on the expensive side, and my parents got me an Ancestry DNA kit instead. All well and good, since I was more interested in the cultures I may have come from at the time. But my boyfriend got me the 23 and Me at the same time, and I received both on Christmas. So, I decided to do both.
I’m going to find any differences between the two. From what I’ve heard, 23 and Me was the more accurate of the two, so I will be more prone to believing it. Another difference that I have found in both registering and receiving the kits, 23 and Me was a bit more in depth. It helps researchers, if you give consent, and you can find out possible health risks with it. I say possible because it is not 100% accurate. Ancestry DNA, however, concentrates on where you come from and gives you the option to allow people sharing your DNA to contact you. 23 and Me automatically assumes you want to talk to those who share your DNA.
I will update this once I get the results, but, so far, I have no strong feelings one way or another. If you want to help genetic research, and can afford it, go with 23 and Me. If you’d rather just find your ancestry, then go with Ancestry DNA. Personally, I plan on having children in the future and, while I understand that the health section is not the most accurate, I do want to be prepared for the possibilities.
1 note
·
View note
Note
Good luck with your weight loss too :)
Thank you again! I'm currently at a plateau, but I should be able to get through it ^^
0 notes
Note
Your response to that not all men post nearly made me wet from how awesome it was
Thank you! I just got a bit upset that one person would use others' deaths as a means to justify bigotry. Took me a couple of days because I didn't want to sound too mad about it, since it was a statistical argument.
0 notes
Text
haliagreen7:
tardisesandtitans:
notable-spinster:
prophet-of-tesco:
tooiconic:
notable-spinster:
sure, not all men, but a lot of men, and we have no way of knowing which ones
“sure, not all black people, but a lot of black people, and we have no way of knowing which ones.”
This is exactly how you sound.
“sure, not all muslims, but a lot of muslims, and we have no way of knowing which ones.”
lettuce consult the fbi data:
Of the 1,864 women murdered in 2010, 91% were killed by men. (by contrast, of the 3,872 men murdered, only 9% were killed by women). Of all the women murdered (by either sex), over a third were killed by a husband or boyfriend. women have legitimate reason to fear men, even the ones they know.
Of the 3,327 white people murdered in 2010, only 13% were killed by black people. 3% were killed by other or unknown races. white people do not have a statistically legitimate reason to fear other races.
women’s fear of men is based in reality, not bigotry. white people’s fear of other races is based in bigotry, not reality.
This deserves much more than 294 notes
OH MY GOD THANK YOU
TLDR, since this is a long post of data; Based on the arrest statistics, almost all demographics found in the US, namely those of Race, Ethnicity, and Sex, had a less than 5% chance of having been arrested, and less than 1% chance of being arrested for a violent crime (including those of Rape and Non Accidental Murder). Thus, fear of any demographic based on such statistics would not be a good defense for any bigotry, be it racism or sexism.
Let us consider all the data. Here are my sources, and all are from 2015, since those are the most recent arrests I can find:
https://www.statista.com/statistics/183489/population-of-the-us-by-ethnicity-since-2000/
https://www.statista.com/statistics/241495/us-population-by-sex/
https://ucr.fbi.gov/crime-in-the-u.s/2015/crime-in-the-u.s.-2015/tables/table-42
https://ucr.fbi.gov/crime-in-the-u.s/2015/crime-in-the-u.s.-2015/tables/table-43
I will not be covering convictions at all, nor will I be focusing on who the crimes were committed against, since people tend to congregate according to race anyways. But, I will be focusing on arrests, since those have been presented. I will also list the estimated total population of Men, Women, and all Races and Ethnicities. They will be close to adding up, but they are not quite the same number.
Numerically, there was an estimated total of 320.9 Million people in the US.
Of that population, 158.23 Million men are estimated and 163.19 Million women are estimated. Also of that total, White (Including Hispanic and Latinx, since they were not separated in the data) had an estimated population of 247.78 Million, Black/African American had an estimated 42.63 Million, Asian had an estimated 17.98 Million, Native American/Alaskan Native had an estimated 4.01 Million, and Native Hawaiian/Other Pacific Islander had an estimated 0.76 Million. These numbers are important in these statistics, as I will calculate the percentages of each that commit Murder or Nonnegligent Manslaughter, Total Violent Crime (Including Rape, Robbery, and Aggravated Assault), and all other crimes (Including Drug Charges, Traffic Violations, Burglary, and Arson).
Now for the arrests made (No Convictions given, and some of these people were probably found to be innocent of all charges.)
Based on Sex:
Women had:
Murder/Nonnegligent Manslaughter: 984 (0.0006%)
Violent Crime Total: 78,829 (0.05%)
Other Crime Total: 2,159,506 (1.3%)
So, fear of women based on crime statistics would not be a good defense for bigotry, since less than 5% were arrested for any crimes and less than 1% were arrested for violent crimes.
Men had:
Murder & Nonnegligent Manslaughter: 7,549 (0.005%)
Violent Crime Total: 309,253 (0.2%)
Other Crime Total: 5,758,331 (3.6%)
So, fear of men based on crime statistics would not be a good defense for bigotry, since less than 5% were arrested for any crimes and less than 1% were arrested for violent crimes.
Based on Race:
White (Including Hispanic and Latinx) had:
Murder & Nonnegligent Manslaughter: 3,908 (0.002%)
Violent Crime Total: 232,180 (0.09%)
Other Crime Total: 5,521,032 (2.2%)
So, fear of White people (including Hispanic and Latinx) based on crime statistics would not be a good defense for bigotry, since less than 5% were arrested for any crimes and less than 1% were arrested for violent crimes.
Black/African American had:
Murder & Nonnegligent Manslaughter: 4,347 (0.01%)
Violent Crime Total: 140,543 (0.3%)
Other Crime Total: 2,056,597 (4.8%)
So, fear of Black/African American people based on crime statistics would not be a good defense for bigotry, since less than 5% were arrested for any crimes and less than 1% were arrested for violent crimes.
Asian had:
Murder & Nonnegligent Manslaughter: 126 (0.0007%)
Violent Crime Total: 5,696 (0.03%)
Other Crime Total: 95,368 (0.5%)
So, fear of Asian people based on crime statistics would not be a good defense for bigotry, since less than 1% were arrested at all.
Native American/Alaskan Native had:
Murder & Nonnegligent Manslaughter: 102 (0.003%)
Violent Crime Total: 6,801 (0.2%)
Other Crime Total: 167,219 (4.2%)
So, fear of Native American/Alaskan Native people based on crime statistics would not be a good defense for bigotry, since less than 5% were arrested for any crimes and less than 1% were arrested for violent crimes.
Native Hawaiian/Other Pacific Islander Had:
Murder & Nonnegligent Manslaughter: 25 (0.003%)
Violent Crime Total: 1,247 (0.2%)
Other Crime Total: 22,026 (2.9%)
So, fear of Native Hawaiian/Other Pacific Islanders based on crime statistics would not be a good defense for bigotry, since less than 5% were arrested for any crimes and less than 1% were arrested for violent crimes.
In conclusion: Fear of any demographic based on any crime statistics is not an excuse for bigotry, since total arrests performed were almost consistently less than 5% of their total populations, and most of those arrests performed were for nonviolent crimes, such as drug use and burglary. Violent crime arrests were consistently under 1% as well. It is saddening that those women were murdered, but their deaths will not be used as an excuse for your bigotry.
137K notes
·
View notes
Text
Weight Loss Update 1
Sorry about not doing an update on Sunday, but there were a few things I had to figure out before I posted anything. No pictures this time, but I will post this week’s pictures when I do my next update on the weight loss.
The main reason I did not post anything on Sunday was because both my mom and I hit an early plateau, meaning one of a few things:
1. We were simply getting more muscle weight, since we were exercising more often. 2. I was retaining water, due to hormones, which caused mom to also retain water. 3. We were still eating too many calories, regardless of what the people at the weight loss center said.
Honestly, I believe it was a mixture of all three. So, we cut down on the calories by altering the program just slightly. We reduced the amount of protein we ate by choosing to avoid the snack bars they gave us and sometimes reducing the protein servings. We also cut down on calories from fat, because you should only have 30% of the calories you intake be from fats. These are the results:
From last week to yesterday: I went from 148.5 to 146.5 pounds.
My bust size went down from 38.5 to 37.5 inches.
My waist size went from 35 to 33.5 inches.
My hip size went from 41 to 39.5 inches.
The sizes may be incorrect as the person who measured me seemed to be inexperienced. I’m sure the weight is correct, though.
My exercise routine will be under the cut, in case anyone is interested.
Mondays: CXWORX (30 minute workout focusing on the core muscles)
Tuesdays: Yoga for 30 Minutes
Wednesdays: CXWORX
Thursdays: Yoga for 30 Minutes
Fridays: BodyPump (Low Weight, High Rep Weight Lifting for 1 Hour)
Saturdays: Yoga for 30 Minutes
Sundays: BodyCombat (A Mixture of Martial Arts for 1 Hour)
Total Hours: 4.5 Hours
2 notes
·
View notes
Text
So... I’ve been going on a weight loss plan again. I kind of left off the last attempt because I felt demotivated and I just didn’t stick to it. But, now I’m doing a weight loss program with both of my parents. More information will be below the cut, for those interested.
Why did I decide to do it this time? Well, there are three reasons that I can distinctly tell you. The rest of my reasons have stemmed from those:
1. Cosplay. There are several cosplays I want to do that I want to lose weight for. I know, something very shallow, but it’s there.
2. The rest of my immediate family decided to go for it. This is a really important thing for me, as that was probably my biggest demotivator the first time.
3. I had a very close experience with death. I’ve been there for grandparents’ deaths, yes. But I only saw one of my grandpas once a year so, while I was affected, I wasn’t as affected. But, recently, we had to euthanize my cat of 17 years. She had been with me through elementary, middle school, high school, and even some college. If you want to read more, please go here. Otherwise, it made me think about mortality.
Now, I don’t recommend losing more than 2 pounds a week. However, the weight loss program I joined does make the client lose more than that. So keep that in mind. I’m going from 152 to 115-110. I started on Tuesday, and so far I’ve gone down to 149. I plan on making weekly updates, including pictures. So, there’s the update and here are the pictures:
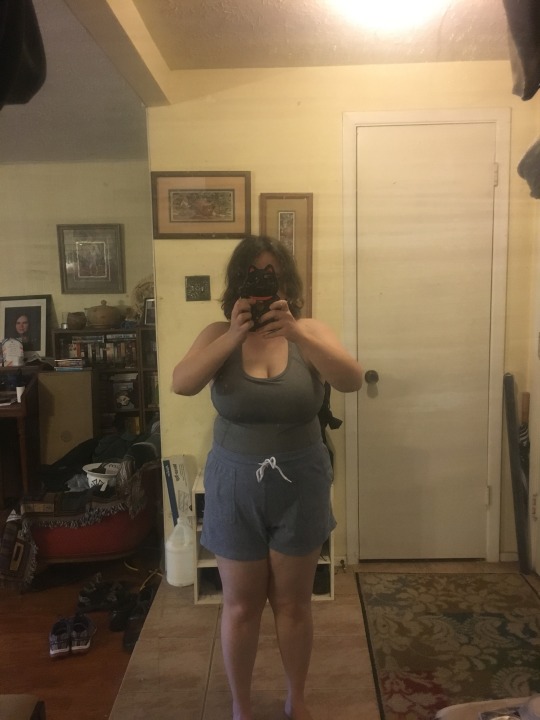
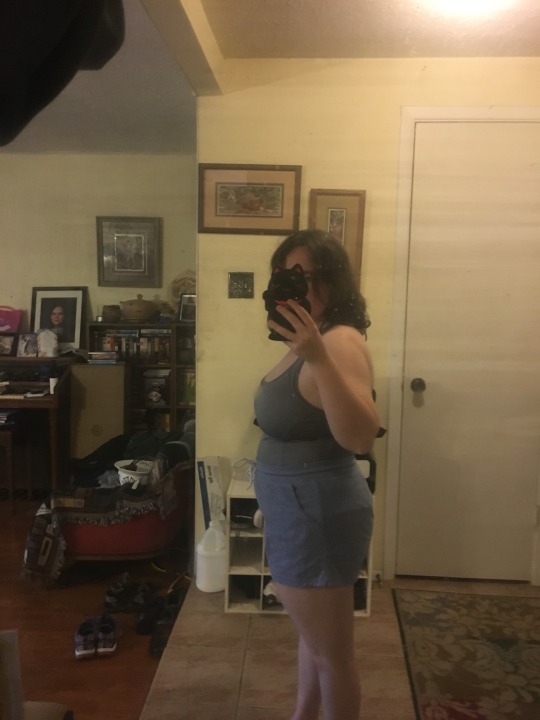
Yes, these are my weighing clothes. They’re the lightest clothes I have, so I can more easily find my weight with them. They’re also easier to see size difference in. If you want more information, go ahead and ask me ^^
0 notes
Text
I just gotta say something. And it’s about handicaps. I already responded to this user on Youtube, but their reaction to me pointing out the fact that you can’t always tell who’s handicapped just by looking at them. In the video, one wheelchair-bound man was yelling and cursing at two people because he believed the other man was not handicapped. Granted, I couldn’t tell whether or not he was handicapped either.
My biggest problems were:
1. Assuming that if a person has major respiratory problems, they won’t smoke. 2. Only people who are wheelchair bound can use the handicapped spot.
Now, to tackle the second point first, people who have mobility problems are legally entitled to use those spots. This includes people who use wheelchairs as well as people with heart failure, emphysema, and persons who for one reason or another have lost parts of or all of one lung. They can also be seen using the motorized shopping carts. I know of a retired athlete who lost the entirety of one lung and part of the other to cancer. He couldn’t walk more than 500 feet without having to take a break to catch his breath. He did not need to disclose this information to others, and often got chewed out because people thought he was perfectly capable of walking like a healthy person.
To answer the second question, some people with such breathing problems do still smoke. It’s a habit that’s hard to kick, and some people don’t want to stop it. Legally, you can’t force them to stop, either.
So, just to summarize it, don’t automatically assume the health of a person at first glance. Sure, it is easier for certain body types, such as overweight people run a higher risk of circulatory problems and underweight people run the risk of having internal problems as well. But some who appear healthy also have problems of their own.
0 notes
Photo
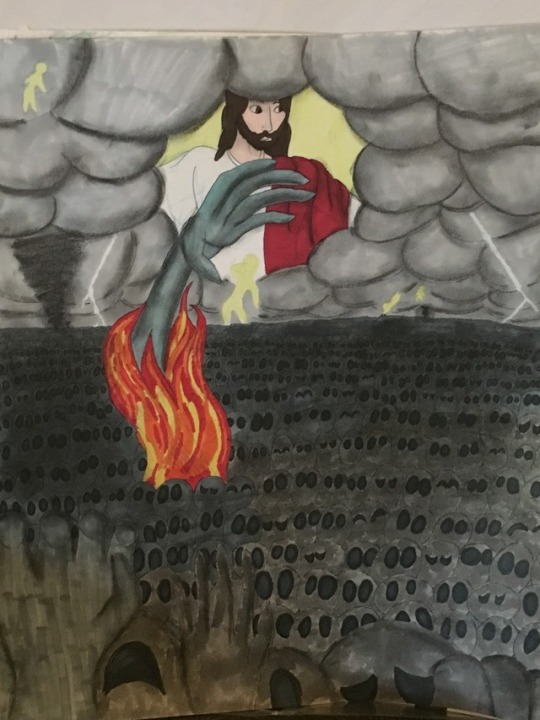
One of my favorite requests. The person requested the rapture, and I decided to play a little bit.
1 note
·
View note