#screenboard
Explore tagged Tumblr posts
Text
I swear to god, I go to test my eyesight bc I can't see shit, I get a paper that says I can't see shit, I send the paper to the government office that says I'm qualified to get financial aid for glasses. I wait for three weeks. They call and say hey actually, the place you went to isn't one of the places we will give financial aid to get glasses from. You need to go to one of these other places. Okay we will send you the paper that says you can get the glasses. Takes another almost 2 weeks. The paper says I need to go to the new place, get my eyesight tested again, and then send them another form so they can decide if they're gonna actually pay for the glasses. It takes another amount of weeks. I might cry.
#personal#I really can't see anything#I'm in class atm the screenboard is like 3 meters away and I can't see it
17 notes
·
View notes
Text
My 6 favourite Scorptra + some little scenes I love
1. "You do care, don't tou?"
The scene that made Catra fully realize that she's not alone and that there is still someone who love her more than anything. Catra was everything for Scorpia.
And the most important thing is that Catra does the most selfless thing she could done: she refuses of Scorpia's help and doesn't let Scorpia set her free, bc she knows it can cause Scorpia troubles and she doesn't want to put Scorpia in the same situation. She doesn't want to be Like Shadow Weaver and doesn't want Scorpia to suffer bc of her.
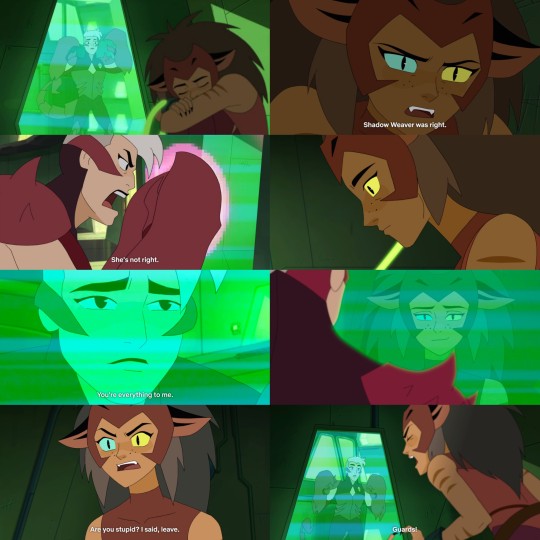
2. "We could, you know, be happy"
Catra was so stupid for not leaving with Scorpia and Ill stay by it. Also there is no "one-sided" explanation for this. Anyone who says Catra never loved Scorpia, litterally just skipped the entire episode. They were SO in love!
Especially considering the fact that they were suppose to kiss each other at that scene ans I will never forgive Nate for removimg it

3. "You saved me?"
The moment when Catra's feelings for Scorpia startes to grow up. It's when Catra realize that Scorpia saved her, no matter what. Even tho Catra ordered Scorpia not to break the technology, Scorpia did it, bc it would save Catra. She disobeyed the order to protect her and you can read in Catra's eyes that she was shocked that she was THAT dear for someone. It makes even more sence when you remember Catra's words about Adora "You never protected me. Not in any way that would put you on SW's bad side". (no blame for Adora, she's still the best girl ofc) but the thing is that Adora wouldn't disobey to protect Catra from SW, but Scorpia did it and not once. Scorpia truly loved Catra and she would always do everything to protect her.

4. "I will always be there for you"
Even tho Catra doesn't want to ask anyone for help and wants to do everything alone, Scorpia still makes her tell the situation to resolve it together. Bc that's what friends do, Catra doesn't have to deal with this alone.
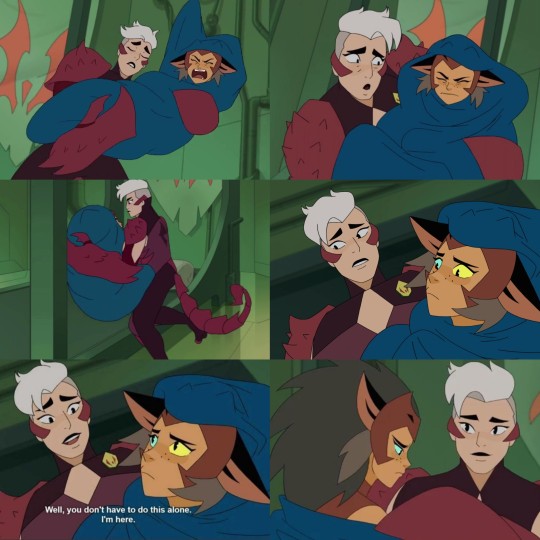
5. "You're a princess??"
Whatever the cat is this?? They were so iconic in the prom episode!
At first Catra was sympathetic with someone for the first time in the show lol. She asked Scorpia (to ask actually) to go to the prom together! It's already pretty romantic, but have you seen the rest of the scenes?
Also the screenboard where Catra zips Scorpia up lol (they really didn't have to remove it)
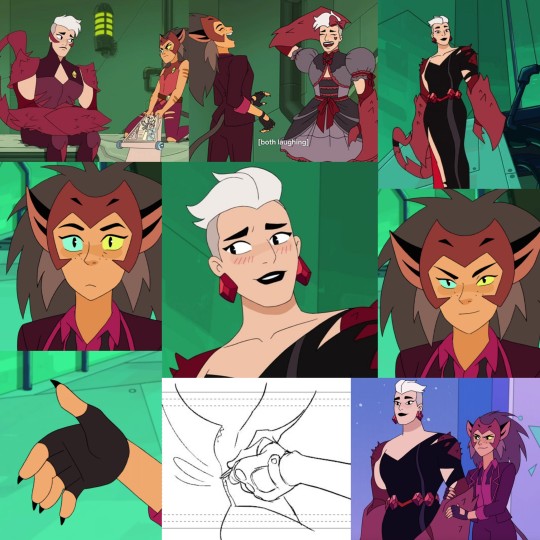
6. "We're making a good team!"
Uhhh, just look at them here! They litterally THE girlfriends! Catra never was so flirty with anyone. She blushes as Amity lol. And just look at these EYES!!!
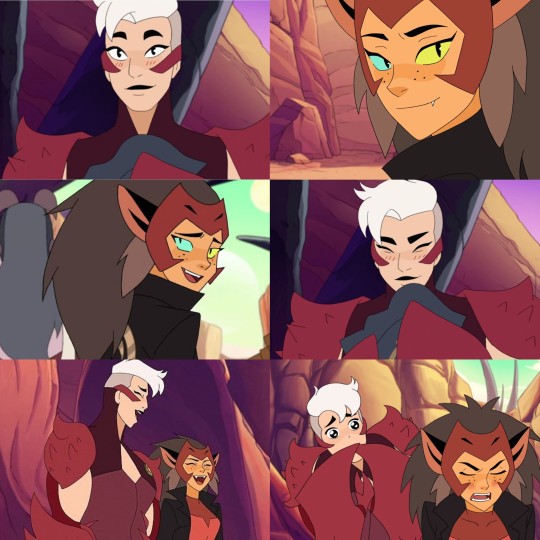
Now heart-breaking scenes, cuz Im evil. S4 was so sad and for what? Im crying...
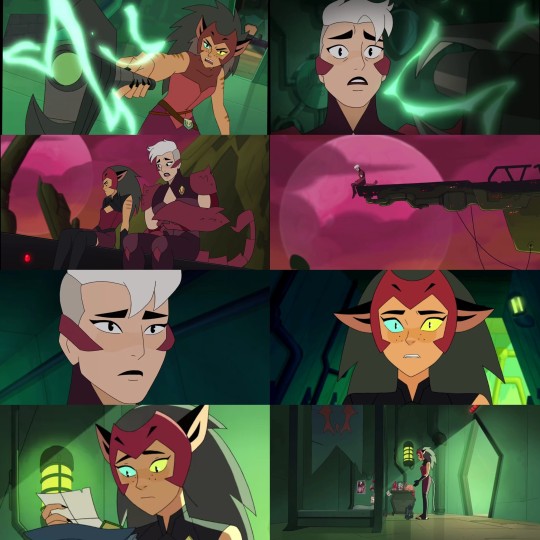

But since Im not THAT bad, here are some sweet scenes again! Cuz they're still cuties (it was a crime not to give us them in s5 btw, Ill never forgive Nate for this) <3
Protective gfs ever!

I really love Scorptra even after so many years. I need someone to rewatch she-ra with!!!
#catra x scorpia#scorpia x catra#Scorpia#Catra#She-ra#shera#Spop#she ra and the princesses of power#she ra season 3#Scorptra#Anti catradora#anti shera#Anti spop#anti c//a#We NEEDED Scorptra to be endgame and Ill die on that hill!
108 notes
·
View notes
Text
project 1 was the demo, project 2 is halfway done, project 3 is still on the drawing board, project 4 has screenboard ready, project 5 now has concrete plotline, project 6 is released, project 7's has established plotline
3 notes
·
View notes
Text
they play this warmup call and response bit on the 200' screenboard at autzen stadium during football games
every single person gets sucked in and does it it's crazy
what a legend
201K notes
·
View notes
Text
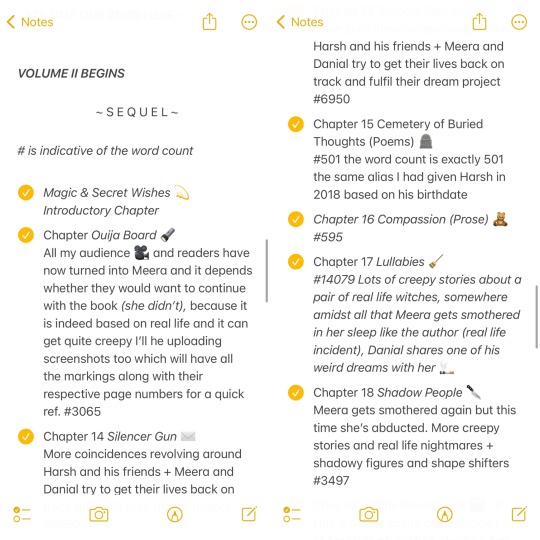
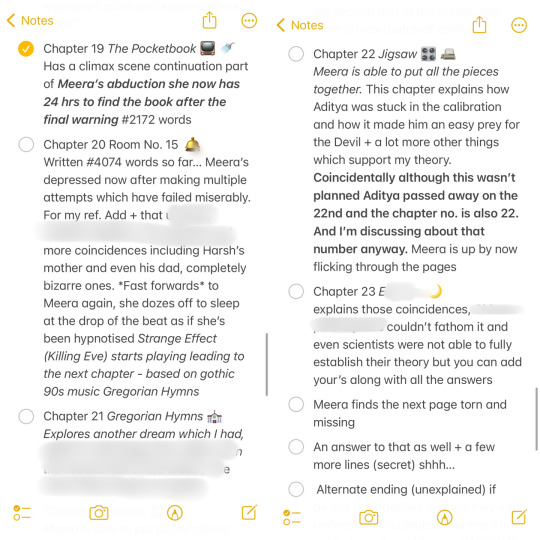
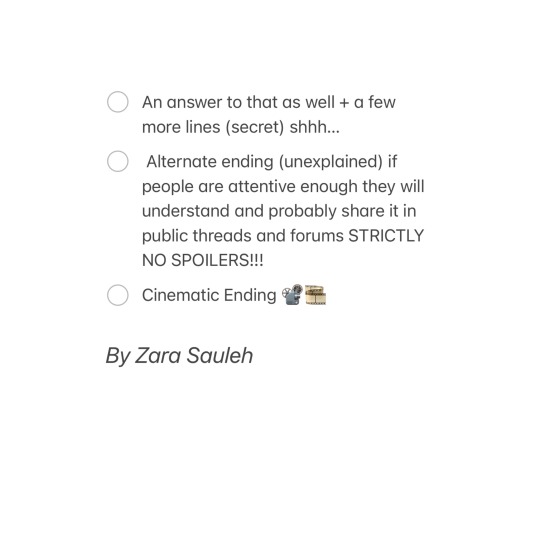
I had made this… a WRITTEN SCREENBOARD and collage too, it doesn’t have Spoilers I have concealed everything as much as I could but I have shared what people could’ve expected to read there, those ILLITERATE IMBECILES are ASSUMING/SAYING the book only has “coincidences” or signs I REALLY wanted them to know this before committing Sui-cde I didn’t write 81000 words for nothing. I have to die before I go crazy I’m going mad due to him I have shared a link below Facebook: Zara Sauleh 7th Post from top which has about his and his friend’s OCD he asked for my personal details only to reject and insult me or what? Not talking about Aditya uncle no one cares about him it was HARSH who was pretending to be him go read that post! Even after 8 years he was so insensitive that he left me to die after ruining my life ever since I was 18-20 all my youth! I’m dy-ing a virgin I’ll keep repeating until my last breath I would’ve changed my gender if I would’ve been alive BECAUSE OF HOW HORRIBLE HE WAS as if I wasn’t a girl and rest everyone was that. He was impotent not me. And go through our signs (marriage one’s too) in all of my previous posts with screenshots and markings 23rd May, 2023 what was supposed to be my marriage number was the blackest day of my life so was 5th Mar he has ruined every significant date, started his drama on my parent’s wedding anniversary my mother and his mother share their birthdates too. There’s a lot more, my brother and his brother our fathers share so many similarities and I didn’t dig out any info I’ve written that in my book SS go find it. Never was a fan haven’t switched on the tv since 2015 BECAUSE OF HIM the tv has also spoilt now due to non-usage, go ask the service provider we threw the set top box (Airtel) ask them when the connection was stopped. Remove my details from Netflix n Prime office I don’t watch anything there either and GO SEE IF I HAVE EVER CREATED an account on VOOT I have NO ACC there. Like I said I haven’t seen him since Feb 2016 that too on social media I NEVER went on any of their profiles and FB office will reveal that my history is there. His fanclub came and liked but To prevent that also I had kept my notifications OFF I accidentally clicked on it after that Insta changed the notification panel and shifted to the top cuz I got a panic attack. Could be a wonderful stroke of luck or idk another girl too had complained about something and they’d made amends. He thinks ppl are taking his side? Unfortunately I’m dy-ing after this I was up all night crying waiting for daytime to put this and die it was a big decision (sharing this here) so I needed more time to think whether I should… and I decided to blur out certain things. I wanted to SHUT their ug-ly mouths it’s a slap there. Now finally bye forever “oversmart” ppl- Zara Sauleh



0 notes
Photo

Matrix 500 series,assembling the power supply #doitvision #ledscreen #powersupply #ledhubboard #rentaldisplay #screenboard #허브보드 #디스플레이 #화면패널 #주도비디오 #전원어셈블리 #비디오벽 #ledkijelző #ledwalls #leddisplaymanufacturer #ledekran#pantallasdeled #ledэкран #ledscherm #pokazled #عرضled #نمایشled #תצוגה #leddisplej #ledディスプレイ #led빌보드 #ledпанели #kodotxgrizzled #ledrizlla #จอแสดงผลled https://www.instagram.com/p/B_L_KCMp6C7/?igshid=10n2h5kf2xqj9
#doitvision#ledscreen#powersupply#ledhubboard#rentaldisplay#screenboard#허브보드#디스플레이#화면패널#주도비디오#전원어셈블리#비디오벽#ledkijelző#ledwalls#leddisplaymanufacturer#ledekran#pantallasdeled#ledэкран#ledscherm#pokazled#عرضled#نمایشled#תצוגה#leddisplej#ledディスプレイ#led빌보드#ledпанели#kodotxgrizzled#ledrizlla#จอแสดงผลled
0 notes
Text
On other news Oshi no Ko 2nd season OP is really good. Animation wise straight up many times better than 1st season (and not just in sakuga way, but also how creative the screenboard is).
Really good. Might be best OP of this season.
That Oshi no Ko latest chapter really hurts man
8 notes
·
View notes
Text
Taki just turned 20 and I just think about where Ri would be when she’s 20 in canon and
j u s t
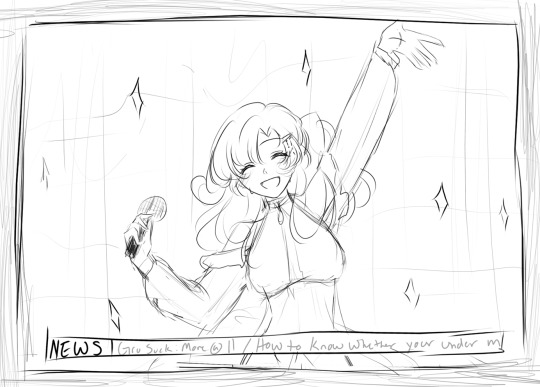
#{ Out of Booth }#{ From ur computer screen to ur TV and downtown screenboards#THE INTERNATIONAL IDOL#SINGING HER WAY INTO UR KOKOROS#IT'S JUST A SELF INDULGENT DOODLE FROM THE GROUP BUT GOD#IT'S SO RELEVANT HERE#even if you're apart just turn on the tv or the radio and she'll be right there for u uwu }
8 notes
·
View notes
Text
you know what makes me sad??
We are seeing a influx of amazing artist, animators, screenboarders and writers. They have so much passion and talent for their craft and only want to share it with the world. But because big studios aren’t willing to pay a fair price for their talent or allow originality we might never see them in the light they deserve
21 notes
·
View notes
Text
im partially working on a pmv ig? does it count as that? probably more a screenboard music video i think.
im nervous and excited, so far its mostly a brainchild and some scripting but i really wanna see this through. dont think ill ever be an animator of any kind lmao but what i have planned might actually work out
1 note
·
View note
Text
Datadog と Lighthouse を利用した WebPerf の継続的計測
こんにちは。ものづくり推進部、フロン���エンドエンジニアの武田です。 今日は Datadog, Lighthouse を使ったクライアントパフォーマンス計測に取り組んでいる、というお話です。
mediba では webpagetest を使った定期実行と計測を以前から行っています。
DataStudioとGASでWebPagetestの計測結果をグラフ化する
uknmr/gas-webpagetest
紹介記事: gas-webpagetestでWebPagetestのパフォーマンス計測を自動化、可視化する
1 での取り組みをベースにし、clasp で GAS のソースコード管理・デプロイを実現するための仕組みや webpagetest Lighthouse test と連携したメトリクスの取得まで網羅したものが 2 になります。
今回は少し webpagetest とは趣向を変えて
Lighthouse による定期実行とパフォーマンス値取得
Datadog API を利用したカスタムメトリクスへの POST
Datadog による可視化
についてご紹介します。
実施に必要なもの
Datadog (Pro Plan or Enterprise Plan での契約)
Node.js v10.13 以上(現時点)、Chrome がインストールされている実行環境
Lighthouse
定期実行する仕組み
超簡単な説明ですが
Datadog とは? -> システム監視のための SaaS
Lighthouse とは? -> クライアントパフォーマンスのスコアリングツール
です。
Lighthouse による定期実行とパフォーマンス値取得
webpagetest ではなくなぜ Lighthouse なのか
webpagetest を利用する場合、自前のプライベートインスタンスとして立てることも可能ですが、コストとの兼ね合いでパブリックインスタンスとして存在するリージョンを利用するというシーンがどうしてもあります。今回はプロダクション環境とパブリックに閲覧が不可能であるステージング環境の2環境を施策に合わせて比較をする必要があるため、どうしてもその制限をクリアできません。
ステージング環境を正常に閲覧できる(=リクエストを受け付けられる)
Lighthouse 実行のために必要な Node.js v10 以上が動��する
Lighthouse 実行のために Chrome が動作する
これらを定期的に実行する
以上を実現することが必要そうです。
どこで Lighthouse 定期的に動かすか
ランタイムを Node.js v10.x にした lambda もしくは CodeBuild でスクリプトを実行、定期スケジューリングを CloudWatch Events にするということも可能そうです。一度 CodeBuild 想定でコストを計算してみます。CodeBuild の OS image は Chrome も素で入っていますし、割となんでも入り感があります。
料金 - AWS CodeBuild | AWS
毎月かかりそうな試算の条件
デイリーで24回実行想定
ビルドにかかる時間 5 分
インスタンスタイプに一番高いクラス 1分単位で 0.02 USD
24回/day * 30day * 5 分 * 0.02 USD = 72 USD
現時点レートで 7,827 円、自分が毎月もらっているお小遣いから出せるかと言われると出せない金額なので今回は AWS 環境での実行を諦めます。
いろいろ考えた結果、ほぼゼロコストで仕上げるため選択したのは Travis CI でした。といっても弊社では Travis CI Enterprise を AWS 環境上で動作させており、そこで実行させる想定です(なので詳細を詰められるとゼロコストではないのですが)。
ただ残念ながら定期実行を叶える Travis Cron Jobs はリポジトリのブランチ毎にマニュアルで指定する必要があるのでそこは残念な感じになります、人間がポチポチ GUI から指定して定期実行を実現することにします。
Lighthouse スクリプト
フロントエンドエンジニアの方ですと Chrome Devtools -> audit や Lighthouse を CLI から利用することは一度はやってみたことがあると思うのですが、今回はよく見るスコアがほしいわけではなく特定のパフォーマンスメトリクスを取得したいという意図です。個人的にも絶対的なスコアリングが全てだと思っていません、計測し比較し向上しているかが一番重要であると思っています。
プログラマブルに Ligththouse を操作していきますが、実はほとんどドキュメントにあったりするので、参考に取得してパフォーマンス値をかき集めてみます。
const lighthouse = require('lighthouse'); const log = require('lighthouse-logger'); const chromeLauncher = require('chrome-launcher'); const opts = { chromeFlags: ["--headless", "--disable-gpu"], logLevel: "info" }; log.setLevel(opts.logLevel); launchChromeAndRunLighthouse("https://stg.example.com", opts).then(results => { // 一旦標準出力に表示 console.table(results); }); function launchChromeAndRunLighthouse(url, opts, config = null) { return chromeLauncher.launch({chromeFlags: opts.chromeFlags}).then(chrome => { opts.port = chrome.port; return lighthouse(url, opts, config).then(results => { // results.lhr はよく見るスコアリングの元データ // https://github.com/GoogleChrome/lighthouse/blob/master/types/lhr.d.ts const { "time-to-first-byte": ttfb, "first-contentful-paint": fcp, "first-meaningful-paint": fmp, "speed-index": speedindex, interactive, metrics, } = results.lhr.audits; return chrome.kill().then(() =>({ TTFB: Math.round(ttfb.numericValue), FIRST_PAINT: metrics.details.items[0].observedFirstPaint, FMP: Math.round(fmp.numericValue), FCP: Math.round(fcp.numericValue), SPEED_INDEX: Math.round(speedindex.numericValue), TTI: Math.round(interactive.numericValue), })); }); }); }
Lighthouse 実行時の Promise.resolve で返却される results は型定義もあり、昨今のエディタ補完の恩恵を受けると大変 DX が良いのですが、必要な数値は正直どこに格納されているか探すほかないので、CLI で一度 JSON ファイルを成果物として実行してから探すのが一番手っ取り早いです。切り取られたスクリーンショットの情報が Base64 でエンコードされ格納されているので違った工夫もできそうではあります。
ここまでで Lighthouse 側の準備は整ったので次に Datadog 側を準備します。
Datadog API を利用したカスタムメトリクスへの POST
そもそもなぜ Datadog を選ぶのか
担当するプロダクトのシステムモニタリングとして現在利用しており(他のプロジェクトでの利用実績もあります)、インテグレーションや API 連携について学びたいというのと、値のプロットと可視化を Datadog 一括にしちゃえば便利だし見るところ少なくていいんじゃね? というのが大きなモチベーションです。
私が活動するメインフィールドはフロントエンドなのですが、チームでは属人化を避けるため監視やアラート対応・調査を含め、モブを通して暗黙知をなくそうという取り組みをしている点も Datadog を候補にした理由です。
Datadog API とカスタムメトリクスの利用
次はDatadog API を使ってカスタムメトリクスを作り POST しますが、まずは API key, APP key が必要になってきます。
ナビゲーションから Intergrations -> APIs
API key, APP key 取得
実際にリクエストを送る際は node-dogapi というのがあるのでこちらを利用してみます。
初期化
const datadog = require("dogapi"); // 環境変数に Datadog API key, Datadog App key がセットされている想定 datadog.initialize({ api_key: process.env.DATADOG_API_KEY, app_key: process.env.DATADOG_APP_KEY, });
カスタムメトリクスへの送信
任意の文字列をカスタムメトリクス名として、収集した値をプロットしていきます。なお以下のコードは先ほど出力に結果を表示したブロックで利用する想定です。タグ名に関しては特定の要素に紐づけ絞り込みを目的として利用を推奨しているようで、公式にもある通りプロダクション環境やステージング環境の種別としてタギングします。タグのルールとしては <KEY>:<VALUE> というルールになります。参照
const { TTFB, FIRST_PAINT, FMP, FCP, SPEED_INDEX, TTI, } = results; const tags = "env:staging"; datadog.metric.send_all([ { metric: "webperf.measure.ttfb", points: TTFB, tags, }, { metric: "webperf.measure.first_paint", points: FIRST_PAINT, tags, }, { metric: "webperf.measure.fmp", points: FMP, tags, }, { metric: "webperf.measure.fcp", points: FCP, tags, }, { metric: "webperf.measure.speed_index", points: SPEED_INDEX, tags, }, { metric: "webperf.measure.tti", points: TTI, tags, }, ], (err, results) => { if (err) { console.log(`Error: ${JSON.stringify()}`); process.exit(1); } console.log(`Results: ${JSON.stringify(results, null, 4)}`); });
ここまでのもの実行できれば Datadog のカスタムメトリクスに値がプロットされ可視化するデータは出来たことになります。
Datadog による可視化
ダッシュボードを作成
新しいダッシュボードを作成しグラフを作る準備をします。
Timeborad: 時系列にイベントグラフを閲覧しレイアウトが自動
Screenboard: ステータスやグラフなどデータとして混合されたもの向けでレイアウトがフレキシブル
2つから選べますがお好きな方を選んで調整してください。
ダッシュボードにウィジェットを追加
グラフで可視化する場合は Timeseries というウィジェットを使用します。
ウィジェットでハマるとしたらタグでの絞り込みな気がします。もしタグがサジェストされないなどうまくいかないようでしたら </> アイコンを押下して raw text での変更に切り替えると avg:webperf.measure.ttfb{key:value} のような入力が可能になるので試してみると良いかもしれません。
最近よく聞くようなパフォーマンスバジェットを閾値として定めて、閾値よりオーバーしたら Warning 表示にする、なおかつ閾値を超えた際にモニタリングによって Slack に通知するといったことも可能です。
Google Developers Japan: パフォーマンスバジェットのご紹介 - ウェブパフォーマンスのための予算管理
ダッシュボードは今のところシンプルですがこんな感じになっています。
日々プロットしたグラフを可視化し追いかけたい数値と、重要視したい値・バジェットを定めてデカデカと表示する、見栄えはよくありませんが実務に事足りるものになっています。
まとめ
Lighthouse から特定の値を取得、Datadog API を使ったカスタムメトリクスへの POST、Datadog 内での可視化について書かせていただきました。
Datadog のカスタムメトリクス利用は Pro/Enterprise プランのみ
手早く低コストで定期実行したいなら CI のサービス利用を検討
Lighthouse の実行結果からはパフォーマンス値やその他(スクショなど)も取得できる
Datadog API の利用は簡単(各種言語のライブラリ等も揃っており充実)
ダッシュボードも気軽で簡単に可視化できる
今回は Datadog のプラン次第というところもありますが、まずは低コストでパフォーマンス定期計測やパフォーマンスバジェットの設定などに取り組んでみてはいかがでしょうか。
0 notes
Text
Introducing Coinbase Watchdog: A new approach to UI and code-driven automation for Datadog
At Coinbase, we use Datadog to collect system and application metrics, implement SLIs and SLOs, create dashboards, and more. As the number of dashboards and monitors grew, we began to see the need to codify them. We were worried that we didn’t have tools to detect accidental or malicious modification. Imagine a production incident that was not noticed by engineers because of an accidentally muted monitor.
Codification solves this because modifications are explicit (through code) and are stored in version control (benefitting from notification and code review systems).
One way of solving this problem would be to store the Datadog components (e.g. Datadog timeboards, screenboards, and monitors) in a version control system and apply changes done through code. The downside of this approach is that managing screenboards or timeboards though the code is not convenient or friendly.
Another way of solving this problem would be to use a Datadog UI-driven approach. This would be much more convenient and friendlier to use. This would require detecting changes, creating a request to submit it back to a version control system and the ability to revert/rollback changes that were not approved.
To achieve the best of both potential solutions (code and UI-driven approaches) we first started by reviewing existing projects we could find:
https://github.com/trueaccord/DogPush
https://github.com/codenize-tools/barkdog
https://github.com/rapid7/dogwatch
https://github.com/grosser/kennel
Each project had their pros and cons but this came down to two issues: not being able to codify dashboards in addition to monitors (even if we forked and contributed back) or being too complex for our customers.
Introducing Coinbase Watchdog
Coinbase Watchdog is a GitHub app and a Golang service that uses the Datadog API to watch for changes in Datadog, achieving the best of both a code and UI-driven approach. When it sees a change, it automatically creates a Pull Request (PR) with the changes in a dedicated Datadog GitHub repository. We have control and consensus mechanisms (you can read more about Heimdall here) that provide us the guarantees that a sufficient number of people have reviewed the change before it can land on master. If a PR was not approved and closed by a customer, Watchdog will call Datadog APIs to restore the components from the master branch in source control.
This approach gives us a UI-driven codification bot. All changes made in the Datadog UI will be automatically picked up by the bot and corresponding Pull Requests will be created. Watchdog can also detect if a user modified the code (Datadog component JSON) and apply the change to Datadog.
The two workflows are pictured here:

Coinbase Watchdog workflows
Configuring Watchdog
The Watchdog service has two types of configuration:
System configuration: this configuration includes all required parameters such as Datadog API/APP keys, GitHub application private key, GitHub project URL, GitHub app installation ID, etc. This configuration is passed to the service with environment variables.
User configuration: this is used by customers. Simple YAML files with a list of Datadog component IDs and metadata such as team, project name, etc. You may have many YAML files in the configuration directory and a configuration folder can have any arbitrary number of subfolders.
This is an example of a User configuration YAML file:

The components that you see above are:
meta: team: An arbitrary team name identifier.
meta: slack: A Slack room name to notify of changes.
dashboards: A list of dashboard IDs to watch.
monitors: A list of monitor IDs to watch.
screenboards: A list of screenboard IDs to watch.
How does Coinbase Watchdog detect changes?
The Watchdog service is completely stateless. There are two ways in which Watchdog detects changes: Full sync and Incremental.
Full sync
When the Watchdog service starts for the first time, it will query all components by ID and check each against the components stored in GitHub. If some component files are different, new PRs will be created per user configuration file. Depending on users’ configuration files, this step could potentially make many Datadog API calls. However, this will only happen once on service startup to verify that the current state in Datadog is consistent with the source in GitHub.
Watching for incremental changes
This is a fairly straight-forward task, and consists of several steps:
The Datadog APIs conveniently expose a field “modified” which contains a component modification date. Watchdog polls the APIs https://api.datadoghq.com/api/v1/monitor, https://api.datadoghq.com/api/v1/screen, https://api.datadoghq.com/api/v1/dash . every N minutes (in our case every 10 minutes) and checks if the current time minus modified field value is less then 10 minutes.
Watchdog uses a git implementation written in Golang under the hood. If step 1 was successful, Watchdog will pull the latest changes from the master branch, create a new local branch, make an HTTP GET request to retrieve the Datadog component from the Datadog API, save the component to a file, and run the equivalent of the git status command to see if the file in the master branch is different from the API response.
Watchdog will then query GitHub APIs to find if duplicate PRs have been opened and if so it will ignore the current one.
An example API response from the Datadog API showing the “modified” key:

Notifications
When Watchdog creates a new PR it is important to notify the relevant team so that they can review the PR. We use a GitHub’s CODEOWNERS feature for that. In the GitHub repository root we have a CODEOWNERS file with the following lines:
config/reliability/ @engineering/reliability
data/infra/reliability/ @engineering/reliability
If a PR affects files in config/reliability/* or data/infra/reliability/* the Reliability Engineering team will be notified by email.
Furthermore, a team can opt-in to Slack notifications by setting a “slack” field under “meta” in user config file with a slack channel (see above picture).
Future features
In the future, we would like to add more features and are already working on a way to automatically revert changes based on PR expiration. We’re also looking forward to see if others who use Datadog find this service useful and are able and willing to contribute.
Datadog introduced new dashboard APIs which is currently not supported by Watchdog. We are planning to add this feature soon and meanwhile PRs are highly appreciated ;)
If you’re interested in contributing to this project, check it out on GitHub here!
If you’re interested in helping us build a modern, scalable platform for the future of crypto markets, we’re hiring in San Francisco!
This website may contain links to third-party websites or other content for information purposes only (“Third-Party Sites”). The Third-Party Sites are not under the control of Coinbase, Inc., and its affiliates (“Coinbase”), and Coinbase is not responsible for the content of any Third-Party Site, including without limitation any link contained in a Third-Party Site, or any changes or updates to a Third-Party Site. Coinbase is not responsible for webcasting or any other form of transmission received from any Third-Party Site. Coinbase is providing these links to you only as a convenience, and the inclusion of any link does not imply endorsement, approval or recommendation by Coinbase of the site or any association with its operators.
Unless otherwise noted, all images provided herein are by Coinbase.
Introducing Coinbase Watchdog: A new approach to UI and code-driven automation for Datadog was originally published in The Coinbase Blog on Medium, where people are continuing the conversation by highlighting and responding to this story.
from Money 101 https://blog.coinbase.com/introducing-coinbase-watchdog-a-new-approach-to-ui-and-code-driven-automation-for-datadog-74f636fb0aab?source=rss----c114225aeaf7---4 via http://www.rssmix.com/
0 notes
Text
hello, i just read mac and cheese as ‘(big) mac and cheese’ as in cheesy pasta stuffed in a hamburger bun and i think that is my cue to go the fuck to sleep
#i mean#i can't#but the cue is there blinking at me on the screenboard#[make text post] [lay down in bed and shut eyes]#just like that
0 notes
Text
SCREEN BOARD FOR BEEHIVE
https://davespestdefense.com/?p=60827 SCREEN BOARD FOR BEEHIVE
Screened bottom board with mite grid for easy mite counts
Manufacturer #SCREENBOARD
...
0 notes
Photo

DOITVISION LED screen, P10 outdoor in jeju. #ledwall #ledscreen #leddisplay #leddisplayrental #advertisements #ledwalls #ledvideowall #pantalla #ledekran #led #pantallasdeled #pantalladeled #ledэкран #ledscherm #pokazled #utstillingsåpning #göstərmək #عرضled #نمایشled #screenboard #panelexterior #ledpantallaalairelibre #주도야외디스플레이 #렌탈주도보드 #비디오벽 #fixedinstallation #outdoorpanels #outdooradvertising #ad #advertisedisplay #advertisements https://www.instagram.com/p/B-uHcECJxI0/?igshid=tng3kbis93z3
#ledwall#ledscreen#leddisplay#leddisplayrental#advertisements#ledwalls#ledvideowall#pantalla#ledekran#led#pantallasdeled#pantalladeled#ledэкран#ledscherm#pokazled#utstillingsåpning#göstərmək#عرضled#نمایشled#screenboard#panelexterior#ledpantallaalairelibre#주도야외디스플레이#렌탈주도보드#비디오벽#fixedinstallation#outdoorpanels#outdooradvertising#ad#advertisedisplay
0 notes
