#rossby
Explore tagged Tumblr posts
Visit Tumblr Blog
Explore Tumblr blogs with no restrictions, modern design and the best experience.
Last Seen Tumblr Blogs


Fun Fact
In 2020, 27% of US Tumblr users had an annual household income of over $100,000.
Text

Rossby doodle from the other day or week or something .. Crazy storm huh
8 notes
·
View notes
Link
Welcome to Astronomy Daily, your friendly and engaging source for all things space and Astronomy. I'm your host, Anna, here to guide you through the latest cosmic headlines. Whether you're a casual stargazer or an astrophysics enthusiast, we've got news that will spark your curiosity and keep you informed about the universe. - **Planetary Influences on the Sun's Magnetic Cycles**: Researchers at the Helmholtz Zentrum Dresden, Rossendorf, and the University of Latvia have unveiled a groundbreaking physical model supporting the planetary hypothesis. This model proposes that vortex-shaped currents on the sun, named Rossby waves, act as intermediaries between the gravitational influences of planets like Venus, Earth, and Jupiter, and the sun's magnetic activities. By revealing how Rossby waves mediate the planet's tidal forces, researchers can now predict and understand even longer-term solar cycles, offering new insights into the sun's behavior and its interactions with the rest of our solar system. - **Exploring Neptune's Moon Triton**: Steve Olson and Jeffrey Landis have proposed the Triton Hopper mission to explore Neptune's largest moon, Triton. The innovative mission aims to use a cryogenic pump to extract propellant directly from Triton's icy surface, enabling the hopper to cover significant distances by hopping across the moon. Loaded with scientific instruments, this mission could unlock a wealth of data about Triton's geology and potential for biological activity. - **Redefining What Makes a Planet**: The definition of what constitutes a planet is back up for debate. Researchers like Jean-Luc Margot of UCLA have proposed new criteria focusing on dynamical dominance and mass. This refined classification aims to provide clarity and consistency, aiding both the astronomical community and the public's understanding of what exactly constitutes a planet. The IAU is expected to discuss these proposals further at their next general assembly in Rome in 2027. - **Space Sustainability Collaboration**: Airbus Defense and Space and Astroscale Limited have partnered to advance in-orbit servicing and space debris removal. Their collaboration focuses on space debris removal, in-orbit servicing, precise navigation and docking technologies, in-orbit space assembly and manufacturing, and satellite refueling and life extension. This partnership aims to enhance the longevity and efficiency of space assets, contributing significantly to building a circular economy in space. For more Astronomy Daily, including our continually updating newsfeed, visit our website at astronomydaily.io. Follow us on social media at AstroDailyPod on Facebook, X, YouTubeMusic, and TikTok. We love engaging with our community, so be sure to drop us a message or comment on your favorite platform. For more Space and Astronomy News Podcasts, visit our HQ at www.bitesz.com.
#airbus#astronomy#cycle#cycles#debris#hopper#influences#magnetic#mission#moon#neptune's#news#planetary#removal#rossby#schwabe#space#sun's#triton#waves
0 notes
Text
Inez Fung

Atmospheric scientist Inez Fung was born in Hong Kong in 1949. Fung is one of the world's foremost experts on climate and the carbon cycle. She is currently a professor of atmospheric science at UC Berkley. Fung has won numerous awards, including NASA's Exceptional Scientific Achievement Medal, and the Carl Gustaf-Rossby Research Medal, the American Meteorological Society's highest honor for atmospheric scientists. She is a member of the National Academy of Sciences, and was a contributor to the Nobel Prize-winning Intergovernmental Panel on Climate Change.
Image source: Whitehouse.gov
#science#scientists#women in science#climate science#atmospheric science#hong kong#woc#women of color#asian-american
7 notes
·
View notes
Text
Magnetic activity of F stars observed by Kepler
The first measure of magnetic activity I will be looking into is known as Sph. This paper introduces this concept in a very understandable way, however the measure itself is limited in its capabilities due to a number of factors which I will talk about in another post.
Context. The study of stellar activity is important because it can provide new constraints for dynamo models when combined with surface rotation rates and the depth of the convection zone. We know that the dynamo mechanism, which is believed to be the main process that rules the magnetic cycle of solar-like stars, results from the interaction between (differential) rotation, convection, and magnetic field. The Kepler mission has already been collecting data for a large number of stars during four years allowing us to investigate magnetic stellar cycles.
Aims. We investigated the Kepler light curves to look for magnetic activity or even hints of magnetic activity cycles. Based on the photometric data we also looked for new magnetic indexes to characterise the magnetic activity of the stars. Methods. We selected a sample of 22 solar-like F stars that have a rotation period shorter than 12 days. We performed a time-frequency analysis using the Morlet wavelet yielding a magnetic proxy for our sample of stars. We computed the magnetic index Sph as the standard deviation of the whole time series and the index ⟨ Sph ⟩, which is the mean of standard deviations measured in subseries of length five times the rotation period of the star. We defined new indicators, such as the contrast between high and low activity, to take into account the fact that complete magnetic cycles are not observed for all the stars. We also inferred the Rossby number of the stars and studied their stellar background. Results. This analysis shows different types of behaviour in the 22 F stars. Two stars show behaviour very similar to magnetic activity cycles. Five stars show long-lived spots or active regions suggesting the existence of active longitudes. Two stars in our sample seem to have a decreasing or increasing trend in the temporal variation of the magnetic proxies. Finally, the last group of stars shows magnetic activity (with the presence of spots) but no sign of cycle.
26 notes
·
View notes
Text
Ok, no shut up. Weather nerd, and let me explain this properly.
The scary thing about climate change is we don't know. All we have theories/model outputs/guesses. A good example is the USA was expected to have a horrible Hurricane weather due to warmer sea surface (Hurricanes need heat + moisture so that makes sense) but what we didn't expect, was the horribly dry conditions in Europe actually having an effect on the tropics, and absorbing so much of the moisture in the air. Add some nicely placed wind shear to tear apart the hurricane if it does get any closer, (random event that happens sometimes) so that if a hurricane was strong enough to maintain it's own moisture, it would get whipped apart by the wind. (Hurricanes are big babies when it comes to opposing wind force), while we have had several named hurricanes this season they couldn't come close to the USA most of the time. Why is this important?
Saying the "Ice melting means the polar vortex is falling apart" IS A POSSIBILITY ONLY. IT IS NOT EVEN A SCIENTIFIC THEORY, MODELS DO NOT AGREE WHAT THE ICE MELTING IS DOING TO OUR WEATHER. So far, the ice melting IS USED AS WARNING SIGNAL THAT THINGS ARE NOT OK and nothing more. (At least in terms of climate, it has effects on other things on our planet)
And most importantly, Tropospheric polar vortex, (labeled as the 'polar vortex' in the graph above) tries to knock around the stratospheric polar vortex (A little above where the 'Polar Jet Stream' is labeled) and very little happens. In fact, only 1/3rd of sudden stratospheric warming events (which is the event being shown in 2nd part of the graph, and what is causing our unusual artic weather) are caused by the Tropospheric vortex bumping it. Now here where the potential effects of climate change is actually a factor, atmospheric Rossby waves (waves that often happen due to the earth rotating) if they can gather enough strength, (usually fed by different high pressure and low pressure systems) they can actually have the strength to run up north and knock the stratospheric polar vortex (the one on the outside) more often, causing SSW events. (I could go on a rant about Rossby waves and their patterns, but this is long enough.) These last two SSWs were caused by Rossby waves. So how does climate change relate to Rosbby waves? Hot water baby. (Which, can cause the artic ice to melt, see where I'm getting at?)
Remember when I said Rossby waves can be influenced by high and low pressure systems? Water temperature can influences high pressures and low pressures drastically. (As I mentioned in paragraph above about hurricanes about how much heat and moisture is needed) Why is this important to understand? Because you then get assholes who want to spend millions of dollar to "bring ice to the artic" to fix everything. That's like when you take medicine to stop coughing, but it doesn't stop you being sick in the first place.
Climate change is a very complex issue that is still very early in it's development. There are too many factors in our weather to say it in just one sentence. Please, if you're interested in stuff like this, do your own research. NOAA (The National Oceanic and Atmospheric Administration) has almost all their research for free online, we need a better understanding of what is going on before we can think of a solution.
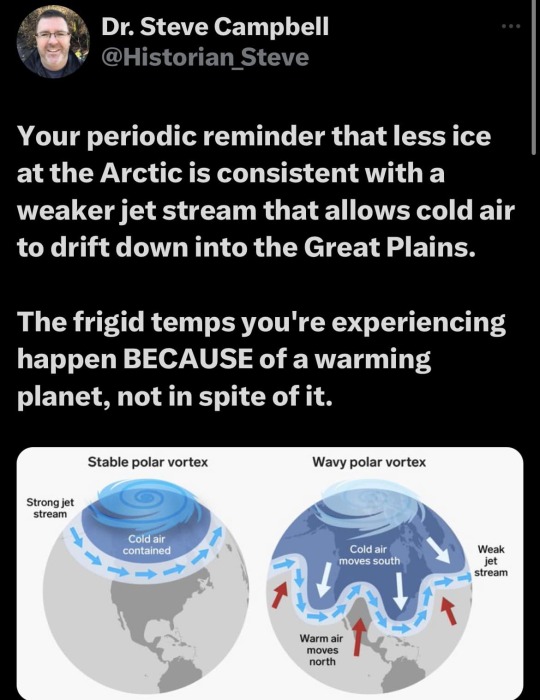
So many people do not understand the relationship between climate change and cold weather.
177K notes
·
View notes
Text
TURISIAN.com - Balai Taman Nasional Gunung Rinjani (TNGR) Provinsi Nusa Tenggara Barat (NTB) menutup sementara sejumlah destinasi wisata nonpendakian di kawasan Gunung Rinjani. Keputusan ini diambil menyusul cuaca ekstrem yang dipicu oleh Bibit Siklon Tropis Invest 96S pada Februari 2025. "Penutupan berlaku mulai 10 Februari 2025 hingga batas waktu yang belum ditentukan," ujar Kepala Balai TNGR NTB, Yarman, di Mataram, Selasa 10 Februari 2025. Yarman menjelaskan, langkah ini diambil untuk memulihkan ekosistem di kawasan taman nasional sekaligus mengantisipasi dampak cuaca buruk. BMKG Stasiun Meteorologi Zainuddin Abdul Madjid Lombok melaporkan bahwa wilayah NTB sedang menghadapi gelombang atmosfer ekuatorial Rossby dan monsun Asia. Dimana, situasi ini berpotensi memicu hujan lebat, angin kencang, hingga bencana hidrometeorologi seperti banjir, longsor, dan pohon tumbang. Sementara itu, sejumlah destinasi wisata alam nonpendakian yang terdampak penutupan ini antara lain Air Terjun Jeruk Manis di Kecamatan Sikur. BACA JUGA: Pendaki Gunung Rinjani Diminta Gercep, Ada Pembatasan Pembelian Tiket Pemandian Sebau Kemudian, Gunung Kukus di Kecamatan Pringgasela, serta Air Terjun Mayung Polak di Desa Timbanuh, Lombok Timur. Sedangkan, sestinasi lain yang ditutup meliputi Tangkok Adeng di Kecamatan Lenek, Bornong Bike Park di Kecamatan Aikmel. Hingga Bukit Malang via Tombong Rebo di Kecamatan Wanasaba. Pemandian Sebau, Savana Propok, Bukit Gedong, Air Terjun Mangku Sakti via Desa Sajang, dan Desa Sambik Elen di Kecamatan Bayan juga masuk dalam daftar penutupan. Selain itu, jalur sepeda di Desa Sembalun turut ditutup sementara. Masyarakat diimbau untuk meningkatkan kewaspadaan dan mengutamakan keselamatan. "Penutupan ini semata-mata demi keamanan bersama," kata Yarman. ***
0 notes
Text
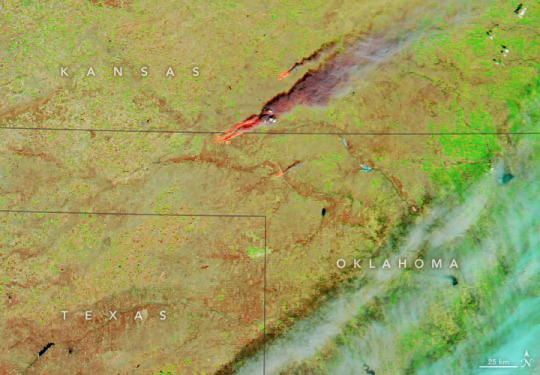
The Fast Fire Threat
Large “megafires” are often the most noticeable fires in satellite imagery. Yet another type—fast fires—are more dangerous and destructive.
This was the finding of a recent University of Colorado Boulder analysis of two decades of NASA satellite data. “We’ve been focused on the wrong metric,” said Jennifer Balch, director of the Environmental Data Science Innovation & Inclusion Lab and lead author of the study. “It’s fire speed that really matters.”
To be considered a fast fire, blazes must achieve a growth rate of at least 16 square kilometers (6 square miles) in a day. Fast fires also share other key features: they’re propelled by strong winds, usually rage in grasslands and shrublands rather than forests, and often burn in the autumn or winter when fuels are exceptionally dry.
The researchers analyzed more than 60,000 fires detected by the Aqua and Terra satellites between 2001 and 2020. Only 3 percent met the fast-fire threshold, but these fires caused 89 percent of damage, 66 percent of deaths, and $18.9 billion in suppression costs.
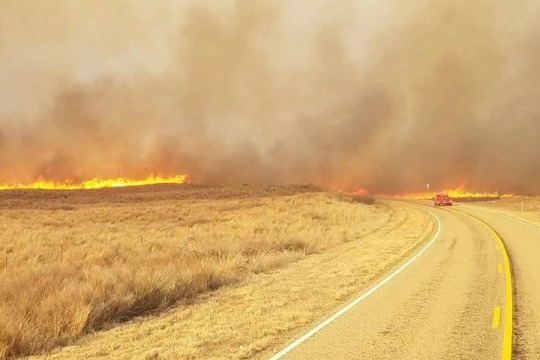
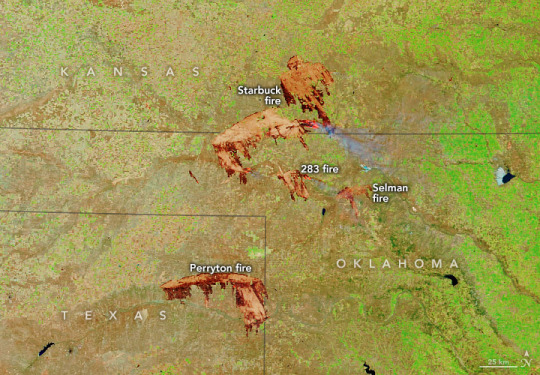
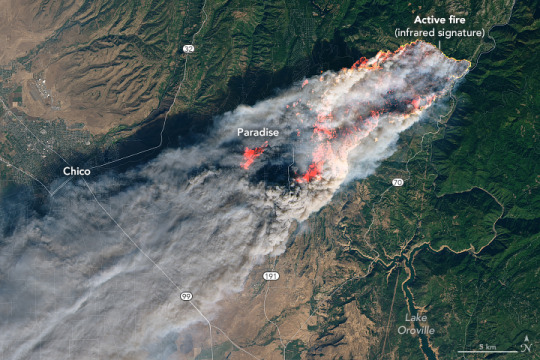
The fastest of the fires tracked, the Northwest Oklahoma Complex (above), hit cattle and ranchers the hardest. Roughly 4,000 animals died after lightning ignited fires in prairie land near the Oklahoma-Kansas border on March 6, 2017. When the fire cluster—including the Starbuck, Selman, Beaver, and 283 fires—was fully extinguished 16 days later, flames had consumed 151 structures and killed eight people.
The prairie was already primed to burn. Several months earlier, abundant rain had fueled unusually lush growth. By March, near-record heat and several months of drought had turned that growth into flammable, dead grass. On March 6, a cold front brought 50-mile (80-kilometer) per hour winds roaring across the landscape. As these winds fanned the lightning-induced flames, the Northwest Oklahoma Complex charred nearly 3,000 square kilometers, an area nearly the size of Rhode Island.
Much of the growth happened on the fire’s first day, a common feature of fast fires. The MODIS (Moderate Resolution Imaging Spectroradiometer) sensors on Aqua and Terra acquired the images at the top of the page on March 6 (ltop) and March 7 (lower), highlighting the fires’ stunning growth rate—a maximum of 2,142 square kilometers in a day. By comparison, the top 20 fastest fires in the database achieved maximum growth rates of 380 square kilometers in a day; the average maximum growth rate for all fires was just 2.5 square kilometers. The nearby Perryton fire, the fourth fastest, grew at a maximum rate of 1,009 square kilometers in a day.
“When you have extreme wind events, fires can become uncontrollable,” said Michael Falkowski, manager of NASA’s wildland fire program. “For safety reasons, firefighters have to get out of the way.”
The typhoons disrupted the normal flow of the jet stream by amplifying huge undulating meanders in the atmosphere known as Rossby waves. This caused a train of these waves to buckle and break over the Pacific Northwest, creating an intense ridge of high pressure that pulled hot, dry air to the surface and generated record-breaking heat.
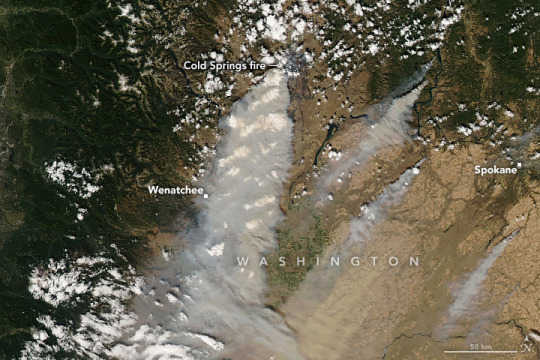
This, along with a low-pressure system over the Four Corners area, fueled powerful easterly winds over the Pacific Northwest. As seen in the visualization, these winds accelerated as they streamed over the Columbia Plateau and into the Okanogan Valley in northern Washington on September 7, fanning fires ignited by damaged power lines and destroying dozens of homes on the Colville Indian Reservation. The visualization is based on data from the HRRR (High-Resolution Rapid Refresh) model and VIIRS (Visible Infrared Imaging Radiometer Suite); the fastest winds are depicted in purple.
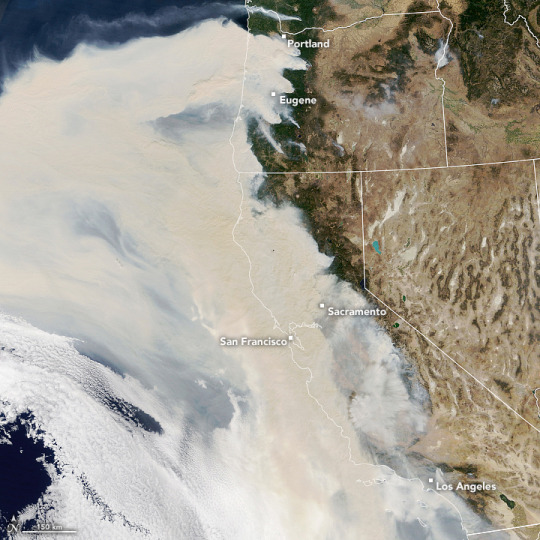
On September 8, winds strengthened as they spread across the plateau, streamed past the Cascades, and fanned several megafires at lower elevations in Oregon, including the Riverside, Beachie Creek, Lionshead, and Holiday Farm fires. The visualization ends focused on the Holiday Farm fire (second 50), a blaze that devastated the town of Blue River and destroyed more than 500 homes and offices. Together the Labor Day fires produced stunning amounts of smoke (below) that engulfed much of Washington, Oregon, and California for more than a week.
The researchers also found that fast fires grew faster over the study period, especially in the Western U.S. The trend was strongest in California’s chaparral, Idaho’s Snake River Plain, and the Columbia Plateau. In California, for instance, fires grew 398 percent faster by the study’s end.
More research is needed to determine why fast fires are speeding up. One factor could be that as climate change has made ecosystems drier, more forests have transitioned to grasslands, making it easier for fast fires to spread, Balch said. Or fires might be igniting more easily in areas prone to fast fires because more people are living and building in them. Wherever people go, fire follows. As much 97 percent of fires are lit by humans and the proportion of fires started by people is rising, earlier research from Balch’s lab shows.
Still, only a small number of fast fires cause most of the destruction and loss, Falkowski noted. “This problem is solvable if communities and individuals take steps to mitigate risks.” Experts suggest proven ways to reduce risks. For instance, communities can implement building codes that incentivize fire-resistant materials and plan for evacuations, the researchers said. Homeowners can ensure roofs and other building materials are fire resistant, remove flammable material from yards, and take steps to protect structures within their home ignition zone, the National Interagency Fire Center recommends.
0 notes
Text
0 notes
Text
There's a reason that everyone except my old supervisor has already gotten rid of certain graphs demonstrating the difference between Kelvin and Rossby waves, and that reason is "he didn't believe me about what it looked like".
The shaft is red and the balls are blue. Of course it looks like a dick.
22K notes
·
View notes
Text
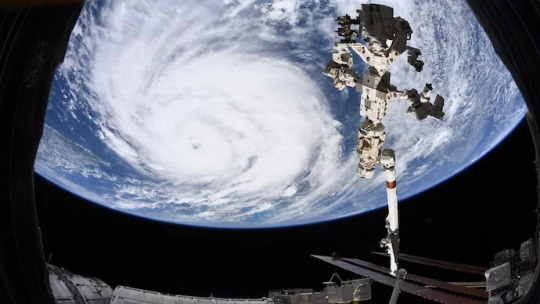
Cyclone Freddy: A Deep Dive into Its Meteorological Milestones
Cyclone Freddy is etched into the annals of meteorological history as the longest-lived tropical cyclone ever recorded, enduring an extraordinary five weeks and three days. This unparalleled storm not only eclipsed the previous longevity record held by Hurricane John in 1994 but also set new benchmarks for tropical cyclone activity, including the highest accumulated cyclone energy ever documented worldwide. Freddy’s relentless strength was marked by a record seven separate rounds of rapid intensification during February and March 2023, kedai168 slot,highlighting its formidable and persistent nature.


Genesis and Initial Intensification
Cyclone Freddy’s story began on 4 February 2023, when it formed as a tropical low south of the Indonesian archipelago. This low-pressure system quickly gained momentum, and by 6 February, it had intensified into a Category 1 tropical cyclone on the Australian scale, officially receiving the name Freddy from the Australian Bureau of Meteorology. As Freddy moved westward across the Indian Ocean, its strength rapidly increased. By 11 February, the cyclone had escalated to a Category 3 severe tropical cyclone and eventually reached Category 4 intensity on the Australian scale.
A Record-Breaking Force
Freddy's peak intensity was a sight to behold. The cyclone reached Category 5-equivalent intensity on the Saffir-Simpson scale, boasting 1-minute sustained winds of 270 km/h (165 mph) and a central barometric pressure of 927 hPa (27.37 inHg). These figures marked Freddy as one of the most powerful tropical cyclones ever recorded. The storm maintained its ferocity as it continued its westward journey towards the northern Mascarene Islands.
Landfall and Devastation
On 21 February, Freddy made its first significant landfall near Mananjary, Madagascar, as a strong Category 2-equivalent cyclone, with winds reaching 175 km/h (110 mph). This made Freddy the most intense storm to hit Madagascar since Cyclone Batsirai a year earlier. The cyclone caused substantial damage as it crossed the island nation, weakening upon landfall but quickly regaining strength as it moved over the Mozambique Channel.
By 24 February, Freddy made its second landfall near Vilankulos, Mozambique, as a moderate tropical storm. The cyclone’s journey did not end there; it re-entered the Mozambique Channel and intensified once again, making its final landfall near Quelimane, Mozambique, on 11 March. Freddy’s impact was devastating, with significant damage reported across multiple countries in its path.
Formation and Evolution
The origins of Cyclone Freddy can be traced back to 4 February 2023, when a tropical low formed in the active Madden–Julian oscillation phase, combined with an equatorial Rossby wave. The system was located in a favorable environment with low wind shear and warm sea surface temperatures of 29–30 °C (84–86 °F), which facilitated its rapid development. Freddy’s early intensification saw it progress from a tropical low to a Category 1 cyclone by 6 February.
Over the next few weeks, Freddy underwent several cycles of rapid intensification and weakening. The cyclone’s structure evolved from a minimal tropical storm to a powerful Category 5 system, demonstrating its capacity to undergo significant changes in strength and size. Freddy’s eyewall displayed a symmetrical appearance with a pinhole eye, which contributed to its high intensity and record-breaking status.
Redevelopment and Final Dissipation
After its final landfall in Mozambique, Cyclone Freddy's remnants continued to impact the region with heavy rains and strong winds. By late February, forecasts indicated that Freddy might redevelop due to a large low-pressure circulation influenced by atmospheric conditions over the southern Mozambique Channel. On 1 March, Freddy re-emerged into the channel and began to regain tropical characteristics, strengthening into a moderate tropical storm by 4 March.
Freddy’s final intensification phase saw it reach tropical cyclone status once again, but it rapidly weakened as it approached the coast of Mozambique. The cyclone made its last landfall near Quelimane on 11 March with estimated winds of 175 km/h (110 mph). The storm’s eye soon dissipated, and by 14 March, Freddy had fully dissipated, leaving behind a legacy of intense meteorological activity and substantial impacts on the regions it affected.
Legacy and Lessons
Cyclone Freddy’s record-breaking duration and intensity serve as a stark reminder of the increasing power and persistence of tropical cyclones in the face of changing global climate conditions. The storm's impact on Madagascar and Mozambique underscores the need for improved disaster preparedness and resilience strategies in vulnerable regions. Freddy’s saga will continue to be a crucial subject of study for meteorologists and climate scientists, offering insights into the behavior and intensity of tropical cyclones.
Cyclone Freddy’s epic journey through the Indian Ocean stands as a powerful testament to nature’s raw force and the ongoing challenges posed by extreme weather events in our rapidly changing world.
0 notes
Text


cosmosdex ocs… probably gonna be a while til i use em in an event 😭
#rossby#derecho#apollo v17#hermes v17#oc#cosmosdex#cosmic events#dont think i’ll tag with cosmicrew#i’ll wait til i post anything to do with pets#apollocentric
8 notes
·
View notes
Text
OK OK OK BUT MAY I INTRODUCE YOU TO MY TWO CATS, ZIRA (left, yes named after Aziraphale) AND ROSSBY (right)!!

Zira loves food, has a big fluffy tail, and is overall a sweetheart while Rossby is a skinny gangly son of a bitch (affectionate) who will pester you relentlessly for attention. Yes I have accidentally called him Crowley a few times.
Literally saw this drawing and immediately couldn't unsee it, I only wish I had a better photo of them together to match the drawing above 😭😭
hello there✨ I was drawing more serious GO illustrations, but I took a break 'cause I HAD TO draw the Ineffable Cats, don't judge me🤭

• Ineffable Cats •
Now back to drawing serious stuff, see u soon my dears💖
ps. Did you notice how their tail form a heart?✨
#One of them is still a kitten while the other is a few years old#bet you cant guess which is which#fanart is wonderful 10/10 good omens kitties :)#good omens#good omens fanart#ineffable husbands#aziraphale#crowley#ineffable cats#ineffable idiots
713 notes
·
View notes
Text
Rethinking solar cycles: New physical model reinforces planetary hypothesis
Strange Sounds May 29, 2024 Researchers at the Helmholtz-Zentrum Dresden-Rossendorf (HZDR) and the University of Latvia have posited the first comprehensive physical explanation for the sun’s various activity cycles. It identifies vortex-shaped currents on the sun, known as Rossby waves, as mediators between the tidal influences of Venus, Earth as well as Jupiter and the sun’s magnetic…

View On WordPress
0 notes
Text
Un nuevo modelo físico solar refuerza la hipótesis planetaria
Aunque el Sol, al estar cerca de nosotros, es la estrella mejor investigada, muchas preguntas sobre su física aún no han sido completamente respondidas.
Investigadores del Helmholtz-Zentrum Dresden-Rossendorf (HZDR) y de la Universidad de Letonia han propuesto la primera explicación física integral de los distintos ciclos de actividad del sol. Identifica corrientes en forma de vórtice en el Sol, conocidas como ondas de Rossby, como mediadoras entre las influencias de las mareas de Venus, la Tierra y Júpiter y la actividad magnética del Sol. Por…

View On WordPress
0 notes
Text
Study says warming may push more hurricanes toward US coasts
Changes in air patterns as the world warms will likely push more and nastier hurricanes up against the United States’ east and Gulf coasts, especially in Florida, a new study said.
While other studies have projected how human-caused climate change will probably alter the frequency, strength and moisture of tropical storms, the study in Friday’s journal Science Advances focuses on the crucial aspect of where hurricanes are going.
It’s all about projected changes in steering currents, said study lead author Karthik Balaguru, a Pacific Northwest National Laboratory climate scientist.
“Along every coast they’re kind of pushing the storms closer to the U.S.,” Balaguru said. The steering currents move from south to north along the Gulf of Mexico; on the East Coast, the normal west-to-east steering is lessened considerably and can be more east-to-west, he said.
Overall, in a worst-case warming scenario, the number of times a storm hits parts of the U.S. coast in general will probably increase by one-third by the end of the century, the study said, based on sophisticated climate and hurricane simulations, including a system researchers developed.The central and southern Florida Peninsula, which juts out in the Atlantic, is projected to get even more of an increase in hurricanes hitting the coast, the study said.Climate scientists disagree on how useful it is to focus on the worst-case scenario as the new study does because many calculations show the world has slowed its increase in carbon pollution. Balaguru said because his study looks more at steering changes than strength, the levels of warming aren’t as big a factor.The study projects changes in air currents traced to warming in the equatorial eastern Pacific Ocean, just off the coast of South America. Climate change is warming different parts of the world at different rates, and models show the eastern Pacific area warming more quickly, Balaguru said.That extra warming sets things in motion through Rossby waves, according to the study — atmospheric waves that move west to east and are connected to changes in temperature or pressure, like the jet stream or polar vortex events.“I like to explain it to my students like a rock being dropped in a smooth pond,” said University of Albany atmospheric scientist Kristen Corbosiero, who wasn’t part of the study. “The heating is the rock and Rossby waves are the waves radiating away from the heating which disturbs the atmosphere’s balance.”
0 notes