#juniper publishers peer review
Explore tagged Tumblr posts
Visit Tumblr Blog
Explore Tumblr blogs with no restrictions, modern design and the best experience.
Last Seen Tumblr Blogs


Fun Fact
Forty percent of Tumblr users are between the ages of 18 to 25.
Text
Omega-3 Polyunsaturated Fatty Acids, Metabolic Syndrome and Diabetes Mellitus

Authored by Victoria Serhiyenko
Abstract
Omega-3 polyunsaturated fatty acids (ω-3 PUFAs) are increasingly being used to prevent cardiovascular diseases (CVD), and cardiac societies recommend the intake of 1g/day of the two ω-3 PUFAs eicosapentaenoic and docosahexaenoic acid for primary and secondary prevention of CVD. Clinical trials clearly suggest beneficial effects of ω-PUFAs consumption on lipid metabolism profile, their anti-inflammatory actions; on endothelial activation, which are likely to improve vascular function; antithrombotic and antiatherosclerotic properties. Experimental studies demonstrate direct antiarrhythmic effects, which have been challenging to document in humans. By targeting arterial stiffness and endothelial dysfunction administration of ω-3 PUFAs may prevent atherosclerosis and CVD development. A synergistic interplay showed by ω-3 PUFAs prescription suggest the potential to beneficially impact on fundamental steps involved in the development of preclinical atherosclerosis. We reviewed available evidence of the benefits of ω-PUFAs administration, especially to patients with CVD, metabolic syndrome and type 2 diabetes mellitus, including their effects on potential molecular pathways, effects on glucose and lipids metabolism parameters, thrombocyte aggregation parameters and haemostasis, endothelial function, antioxidant/anti-inflammation and antiarrhythmic properties.
Keywords: Omega-3 polyunsaturated fatty acids; Coronary heart disease, atherosclerosis; Diabetes mellitus; Glucose, lipids; Inflammation; Platelets; Haemostasis; Endothelium; Heart rate variability; Arrhythmias; Arterial stiffness
Abbrevations: ω-3 and ω-6 PUFAs: Ω-3 and ω-6 Polyunsaturated Fatty Acids; MetS: Metabolic Syndrome; T2DM: Type 2 Diabetes Mellitus; CVD: Cardiovascular Diseases; DLP: Dyslipoproteinemia; OS: Oxidative Stress
Go to
Introduction
Numerous studies report salutary effects of ω-3 polyunsaturated fatty acids (ω-PUFAs), i.e. eicosapentaenoic (EPA) and docosahexaenoic acid (DHA) on cardiovascular diseases (CVD) risk factors. These effects include lowering of serum triglyceride (TG) by reducing of hepatic TG production; lowering of blood pressure (BP) by improving of endothelial cell functution; decreasing of platelet aggregation by reducing of prothrombotic prostanoids; decreasing inflammation via reduction in 4-series leukotrienes (LT) production; protection from arrhythmias by modulation of electrophysiological properties of cardiac myocytes. Systematic meta analysis suggests that high doses of ω-3 PUFAs (~3g/day) produce a small, but significant decrease in systolic blood pressure (SBP) in older and hypertensive subjects [1,2]. The aim of this study was to review the latest evidence about the ω-PUFAs, metabolic syndrome (MetS) and type 2 diabetes mellitus (T2DM).
Go to
Discussion
Ω-3 and ω-6 PUFAs are essential fatty acids, as they cannot be synthesized de novo in humans. There are limited data available regarding the exact amount of dietary ω-3 PUFAs consumed by the general population. It is reported that the total daily intake of dietary ω-3 PUFAs in the US is approximately 1.6g. Of this α-linolenic acid (α-LLA) accounts for approximately 1.4g/q.d, and only 0.1–0.2g/q.d. comes from EPA and DHA. The conversion rate from α-LLA to EPA and DHA is variable (0.2-15%). Therefore, in general, the total amount of EPA and DHA available to the body from current dietary patterns is well below the recommended amounts. EPA and DHA didn’t show a significant negative effect on glucose metabolism [3].
Several experimental studies have shown that long-chain ω-PUFAs inhibit the absorption of cholesterol in the intestine and its synthesis in the liver, lead to increased clearance of lipoproteins in the blood, prevent the development of insulin resistance (IR) in experimental diabetes, increase the level of glucose transporter 4 in skeletal muscles, have a positive effect on age related decrease of blood flow in the brain and improve glucose utilization under stress; there isn’t any influence on the development of hypertension (HT) and MetS. Ω-3 PUFAs decrease level of BP, dose-dependent prevent the development of T2DM, IR, contribute to positive changes of blood coagulation parameters; enhance endothelial cell migration and inhibits the proliferation of smooth muscle cells [4]. A meta-analysis of 18 studies found a significant effect of fish oil to lower TG concentrations and increase high-density lipoprotein cholesterol (HDL-C) in the blood; while there were no statistically significant changes in preprandial glucose, glycated hemoglobin A1c, total cholesterol, low density-lipoprotein cholesterol levels. Ω-3 PUFAs may affect the IR and glucose homeostasis by inhibition of IR in the muscle tissue >adipose tissue >>liver, inhibition of insulin secretion, which defer the development of T2DM; and on the state of lipid metabolism (in particular, reduce the concentration of TG, very low density-lipoprotein cholesterol (VLDL-C), increase of HDL-C, improve lipid profile by mixed hyperlipidaemia (HLP), slightly decrease BP, improve endothelial function, have an positive impact on the antioxidant status and inflammatory reactions [5]. Ω-3 PUFAs decrease VLDL assembly and secretion, resulting in diminished TG production, through a decreased sterol receptor element binding protein-1c activity [6,5].
The highly concentrated pharmaceutical preparation Omacor™ (Pronova Biocare, Lysaker, Norway), known as Lovaza™ (Glaxo Smith Kline, St Petersberg, FL, US) in North America is approved by the FDA as an adjunct to diet to reduce very high TG levels (≥500 mg•dL-1) in adults. Each 1-g capsule of ω-3-acid ethyl esters contains ethyl esters of EPA (0.465 g) and DHA (0.375g). Patients take a q.d. dose of 4-g or two 2-g doses (two capsules b.i.d.) [7]. Clinical trials have shown that administration of 4 g•day-1 of Lovaza™ results in a decrease in TG levels of 30-50%; does not affect the efficacy of statins [8,5]. In patients with combined HLP, co-administration of Lovaza™ with statins was a safe and effective means of lowering serum TG, despite the persistent high TG levels when the patients received statins alone [9,5].
The anti-inflammatory actions of marine ω-3 PUFAs are [10]: reduced leucocyte chemotaxis (via decreased production of some chemoattractants (e.g. leukotriene B4 down-regulated expression of receptors for chemoatttactants); reduced adhesion molecule expression and decreased leucocyte-endothelium interaction (via down-regulated expression of adhesion molecule genes [via the nuclear factor kappa B (NF-kB) (i.e. peroxisome proliferator-activated receptor-ɣ (PPAR-ɣ) etc.); decreased production of eicosanoids from arachidonic acid (AA) (via lowered membrane content of AA; inhibition of AA metabolism); decreased production of AA containing endocannabinoids (via lowered membrane content of AA); increased production of ‘weak’ eicosanoids from EPA (via increased membrane content of EPA); increased production of anti-inflammatory EPA and DHA containing endocannabinoids (via increased membrane content of EPA and DHA); increased production of pro-resolution resolvins and protectins (via increased membrane content of EPA and DHA); decreased production of inflammatory cytokines (via down-regulated expression of inflammatory cytokine genes (via NF-kB, i.e. PPAR-ɣ etc.); decreased T cell reactivity (via disruption of membrane rafts (via increased content of EPA and DHA in specific membrane regions).
Ω-3 PUFAs may decrease the risk of atherothrombosis by affecting platelet aggregation and haemostasis. The antithrombotic properties of EPA and DHA have been attributed to the incorporation into platelet phospholipids at the expense of the ω-6 PUFAs, such as AA. An important set of pathways clearly influenced by changes in the ω-3/ω-6 ratio are those for synthesis of eicosanoids. These include the cyclooxygenase (COX), lipoxygenase and cytochrome P450 epoxygenase pathways, for which EPA and DHA compete with AA as a substrate, inhibiting the production of the proaggregatory thromboxane A2 (TXA2) originating from AA. Indeed, the production of TXA2 from platelets stimulated by a variety of agonists decreased by between 60% and 80% after fatty acid supplementation both in vitro and in vivo [11,5]. The mechanism by which ω-3 PUFAs influence endothelial function is mediated by their incorporation into biological membrane phospholipids; this allows modulation of membrane composition and fluidity. The reason lies in the fact that endothelial cell membrane houses caveolae and lipid rafts where several receptors and signaling molecules crucial for cell function are concentrated [12]. Caveolae-associated receptormediated cellular signal transduction includes important pathways such as the, the nitric oxide (NO)/cyclic guanosine monophosphate signaling pathway, the nicotinamide adenine dinucleotide phosphate oxidase and tumor necrosis factor-α/ NF-kB induced COX-2 and prostaglandin E2 activation pathway. By modulating the composition of caveolae, as described for other classes of lipids ω-3 PUFAs may exert their beneficial effects, which include increased NO production and reduced production of proinflammatory mediators [13,12]. In addition to increasing NO production, ω-3 PUFAs decrease oxidative stress.
The incorporation of ω-3 PUFAs in synaptic membranes could potentially influence the autonomic control of the heart. Both nervous tissue and heart tissue have a high content of ω-3 PUFAs (especially DHA) and this may be consistent with the finding that this marine ω-3 PUFAs may modulate cardiac autonomic function as assessed by heart rate variability (HRV) [14]. Thus, ω-3 PUFAs may modulate HRV both at the level of the autonomic nervous system and the heart. Most of the data support that ω-3 PUFAs beneficially modulates cardiac autonomic control thereby possibly reducing the risk of arrhythmias. Accumulating evidence from in vivo and in vitro experiments has demonstrated that ω-3 PUFAs exert antiarrhythmic effects through modulation of myocyte electrophysiology. Ω-3 PUFAs reduce the activity of membrane Na+ channels in cardiomyocytes, thus increasing the threshold for membrane potential depolarization. EPA and DHA also modulate the activity of L-type Ca2+ channels, leading to a reduction in free cytosolic Ca2+ ion, which stabilizes myocyte electrical excitability to prevent fatal arrhythmia. EPA blocks the Na+/Ca2+ channel; however, a single amino-acid point mutation in this channel attenuated the inhibitory effect of EPA. These findings suggested that the cardioprotective effect of ω-3 PUFAs is mediated by direct interaction with membrane ion channels [15].
Ω-3 PUFAs intake has shown to reduce BP especially in HT by interacting with several mechanisms of BP regulation: reduction of stroke volume and heart rate; improvement of left ventricular (LV) diastolic filling; reduction of peripheral vascular resistances; improvement of endothelial-dependent and endothelial-independent vasodilation (stimulation of NO production; reduction of the asymmetric di-methyl-arginine; reduction of endothelin-1; relaxation of vascular smooth muscle cells; metabolic effects on perivascular adipocytes; endothelial regeneration. Mechanisms of HT-related organ damage protection: anti-inflammatory, antioxidant, and antithrombotic effects; reduction of arterial stiffness; experimental effects on LV hypertrophy and abnormal gene expression; effects on atherosclerotic plaque progression and stability [7]. Ω-3 PUFAs offer a scientifically supported means of reducing arterial stiffness and this may account for some of the purported cardioprotective effects of ω-3 PUFAs [16,17].
Go to
Conclusion
The antiarrhythmic effects of ω-3 PUFAs, which occur by blocking various ion channels, are encouraging. So, cardiovascular benefits of ω-3 PUFAs [7,18] are: antidysrhythmic effects (reduced sudden death; possible prevention of atrial fibrillation; possible protection against pathologic ventricular arrhythmias; improvement in HRV; antiatherogenic effects (reduction in non- HDL-C levels; reduction in TG and VLDL-C levels; reduction in chylomicrons; reduction in VLDL and chylomicron remnants; increase in HDL-C levels; plaque stabilization; antithrombotic effects (decreased platelet aggregation; improved blood rheologic flow); anti-inflammatory and endothelial protective effects (reduced endothelial adhesion molecules and decreased leukocyte adhesion receptor expression; reduction in proinflammatory eicosanoids and LT’s; vasodilation); decreased SBP and diastolic BP. Thus, further research to understand the mechanism of action and confirm the beneficially effect of ω-3 PUFAs on BP profile, artery stiffness and HRV parameters in patiens with MetS, T2DM is needed.
To Know More About Current Research in Diabetes & Obesity Journal Please click on: https://juniperpublishers.com/crdoj/index.php
To Know More About Open Access Journals Please click on: https://juniperpublishers.com/index.php
0 notes
Text
Is US Patent Policy Strong Enough to Withstand the Winds of Change: A Study of the Need to Change United States Patent Policy

Author by Kent R Acheson
Abstract
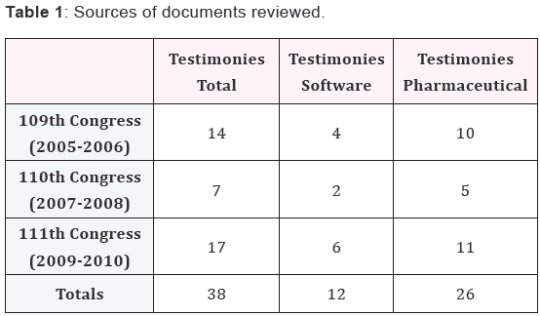
The purpose of this case study was to learn how US patent policy requirements differ for the Software and Pharmaceutical Industries, specifically if United States Patent Policy adequately protects intellectual property rights [1] for two divergent industries while still encouraging research and development (R & D) investment sufficient to increase profits and innovation. Data for this study consisted of 38 witness testimonies delivered to US Congress between the years 2005 and 2010 by experts representing the two industries of interest: pharmaceutical and software. Key findings from the data analysis of these 38 testimonies revealed both within industry differences and between industry differences in patent law protection. Within industry differences showed variance based on size of the company and the degree to which they relied on their own R & D. Between industry differences reflected divergent ‘products’ with Pharmaceutical Industries needing long-term protection to recover R & D expenditures that include expenses for human trials research to proceed from patent application to market. Software industry, on the other hand, uses follow-on innovation of others to continue technological advancement by constantly improving upon existing software. The data show that these two industries use patent policy protection in different ways for different reasons. This information will enable Policymakers to develop another form of product protection in lieu of the current patent law to better meet the needs of these two industries rather than try to modify the existing law.
Introduction
Patent law was developed in parts, building on one another with a single purpose in mind of protecting all innovations in a society and this created the basis for patent laws imposed on the current and future generations. Bessen [2,3] stressed that patents may not be valuable in protecting innovation [4-6] but are used solely to diffuse new ideas in the public. Bessen and Maskin [7] had previously highlighted that little research and development (R&D) in the Software Industry is used to gain patent protections and the enforcement issue with patents is difficult, as many patents are issued for products that are not new. Levin [8] and others found much earlier that patents were rated weak at protecting the returns on innovation, far behind the protection gained through lead time and learning curve advantages.
Patent’s role in different industries
The purpose of this qualitative case study was to explore the different requirements for patent policy for the Software and Pharmaceutical Industries. All transcripts from testimonies from the spokespersons representing the two industries introduced to either House between the years 2005 to 2010 concerning the U.S. Patent Reform Bills were collected and analyzed to answer the research question in this case study. The findings could be useful in further adjusting patent policy to encourage innovation for diverse industries, or suggest the creation of another form of idea protection.
A similar problem may be in the type of intellectual property protection that a company chooses to obtain to avoid the constraints of getting a patent and extend the time frame for protection, such as copyright protection that extends protection from the 20 years for a patent to 120 years. Apple Inc. obtained a copyright protection for their popular iPhone [9], which recently lost in a suit against the Federal Government. The landmark decision helps to control copyright creep. Initially when buying an iPhone, Apple Inc. limited the service provider to AT&T and applications had to be bought from the Official Apple Store. Now, however, through a hack on the iPhone, users can choose a different service provider and load other, unofficial, applications not supported by Apple Inc., and hackers are not in violation of Copyright Law.
Policy Makers can use the findings of this study to explore new directions for the United States Patent Policy to optimize advancement of technology in the Software and Pharmaceutical Industries. Historically in the United States, there has been one patent policy. Scholars, academicians, and the United States Government still do not know the ideal amount of IPRs mainly because the objective has been to uphold one uniform policy. This study clarified if further changes were needed for patent policy through a Patent Reform Act, which enables Policy Makers to understand the needs of the Software Industry, or design another form of protection designed specifically for the Software Industry.
Crowe [10] and others stated that a case study design is most appropriate when little is known of a phenomenon in its natural context. A case study is “used to generate an in-depth, multifaceted understanding of a complex issue in its real-life context” (p. 1). The Pharmaceutical Industry has a profitable track record using the existing Patent Law to protect their R&D investments. The Software Industry is comparatively new and therefore their issues are only just now becoming obvious. Case law is outside the boundaries of this study.
The multiple dimensions of the phenomenon of the nature of protecting intellectual property rights in the Software Industry property and the Pharmaceutical Industry are worthy of study to allow all voices to be heard, including large corporations from both software and pharmaceutical companies, generic drug companies, and smaller software startups. After carefully examining all relevant transcripts, these diverse opinions can be given venue to state their needs.
Methodology and main results
The research question addressed in this study was: How do the patent policy requirements differ for the Software and Pharmaceutical Industries? From the Software and Pharmaceutical Industries’ objectives and needs for the United States Patent Policy to address, the questions spotlighted the sufficiency and effectiveness of the United States Patent Policy.
The focus of this study has two parts, they are:
1. What is the evidence United States Patent Policy adequately protects Intellectual Property Rights (IPRs) for both the Software and Pharmaceutical Industries?
2. How does the United States Patent System encourage companies to make R&D investment in the Software and the Pharmaceutical Industry?
The first research question dealt with the effectiveness of the United States Patent Policy in protecting IPRs in two industries: software and pharmaceutical. The second research question related to how companies invest in R&D with support of the United States Patent Policy. The study explored the ability of the United States Patent Policy to foster innovation with satisfactory IPR protection to encourage R&D spending focusing on two specific industries. The Software Industry experiences a sequential and complementary nature of innovations, building on previous discoveries; and may not use the patent policy in effect in the United States. If patent policy does not consider the different requirements within the Pharmaceutical Industry and is too lax then enough R&D spending will not be invested and technological advancements, including new medications, may come to the market slower or not at all.
The scope of the study is to understand how the Software and Pharmaceutical Industries use the patent system and how better to adjust the patent system to optimize technological advancement. As discussed in assumptions, because of the nature of the source of data and the possible bias that was not fully known, the assumptions may or may not have had a credible or dependable basis and may therefore have biased the findings. Qualitative designs such as the case study have inherent limitations that may threaten validity, they may lack rigor and they may not be generalizable. These limitations may be mitigated with transparency in data analysis and reporting. Crowe 5 and others explains on page 8 “seeking potential, alternative explanations, and being explicit about how interpretations and conclusions were reached, helped readers to judge the trustworthiness of the case study report.
Evidence from various sources highlight the United States Patent system does not work as intended and needs a solution to continue or increase innovative activity. The principal problem deals with innovative activity that is sequential in nature and innovative activity that involves much R&D investment to bring a product to market. Sequential inventions build on previous breakthroughs and do not require much R&D investment. Secrecy would hinder follow-on discoveries of sequential innovative products.
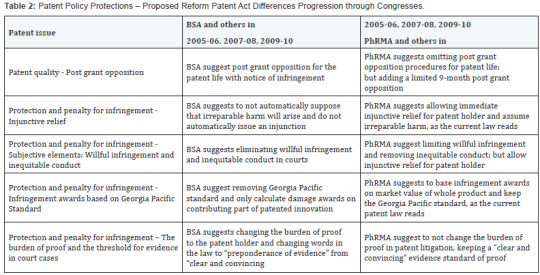
This study used a content analysis of witness [11] testimonies to Congress on the Software and Pharmaceutical Industries from the years 2005 to 2010, and the possibility to develop more than one patent policy to accommodate different sectors of the economy. The study concentrated on software and pharmaceutical companies, as these two industries are most at odds with each other, and have prevented the passage of the Patent Reform Act of 2005 through 2010. The Patent Reform Act of 2010 [12,13] is the result of non-passage of the 2009 Act, as was each successive year from 2005. The stance of the Software and Pharmaceutical Industries remained relatively unchanged in their requirements, but the patent reform acts changed to incorporate the majority opinion of industry. The most important recommendations of the Federal Trade Commission (FTC 11) and National Academies of Sciences (NAS) studies that were first introduced in 2005 by Senator [14] Lamar Smith were considered.
The purpose of this descriptive analysis was to examine the current United States Patent Policy and the proposed changes to United States Patent Policy, and answer the research question – How do the patent policy requirements differ for the Software and Pharmaceutical Industries? This study will help decide if the Software and Pharmaceutical Industries effectively use the U.S. Patent Policy through protecting Intellectual Property Rights (IPRs) and encouraged investment research and development (R&D). The qualitative case study was the most suitable approach to study the issues and answer the research questions because it explored real-life experiences of industries looking to patent Intellectual Property (IP).
Data and Sample Statistics
Data were collected and analysis began using the Content Analysis Guide developed for this study. The testimonies of the BSA representatives, other computer software witnesses, Computing Technology Industry Association, PhRMA representatives, other generic pharmaceutical representatives, and the Generic Pharmaceutical Association, Biotechnology Industry Association (BIO), Intellectual Property Owners Association (IPO) [15-18], and venture capital organizations were included in this study. The IPO was included because IPO members represent 30% of patent applications at the USPTO and include members from the Software and Pharmaceutical Industries, among others. The study included Venture capitalists because some members of BSA [19] and other smaller software companies began with venture capital dollars. Each data point was examined for inclusion of any reference to R&D, including duration and support for R&D, the need for patent protections [20,21], and future needs for patent policy.
The 38 documents submitted to the congressional hearings were analyzed. Documents relating to software and pharmaceutical companies reviewed were not ambiguous but very clear and straight forward following a consistent format, so that anyone conducting another study would reach the same conclusions. They all stated who authored the document, who the document represented, who presented opinion to Congress, their position on the patent reform act, and agreements and disagreements with specific points of the patent reform act. No ambiguity existed and no information required subjective judgments to interpret the information reported. The nature of the data supported the reliability of the findings.


Cisco, Hewlett-Packard, and other big high-tech companies began pushing for reform legislation to limit the number of patent infringement lawsuits and therefore the amounts paid in damages. The United States Patent and Trademark Office’s (USPTO) proceedings’ transcript from the public hearings showed the patent policy needs for BSA’s principle member and founder Microsoft. The public hearing titled Use of the Patent System to Protect Software Related Inventions took place in 1994 at the San Jose Convention Center, California, and at the Crystal Forum in Arlington, Virginia. A brief summary of Microsoft’s speech follows. Microsoft (BSA) recommended that patent protection allow an accused infringer to identify readily the activity forbidden under the claim. The success of a particular claim in meeting these objectives may depend less on the form and more on claim substance and the supporting details.
BSA represents a large base of computer software and hardware companies in the United States. Phelps (2005) from Microsoft Corporation stated that BSA does not want the patent holder to have automatically injunctive relief. Injunctive relief occurs when the courts rule an infringement occurred and automatically issue a ruling to stop the infringer from continuing operations. From the congressional hearing in 2005 on harmonization and other matters, Phelps for BSA supports publication in 18 months. Phelps [39] expressed support for establishing a post grant opposition procedure and supported third-party opportunity to alert USPTO to questionable patents during review. Phelps also supported allowing third parties the opportunity to suggest relevant prior art to examiner during review, supported a limit on damages for willful infringement to include only egregious behavior, and supported limiting damages to only the contributing, patented piece of the invention and not the market value of the whole product, as it is now.
In a congressional hearing in 2005, Simon [40] from Intel , a BSA representative, stated the patent system is difficult to maneuver because of many pieces that comprise computers and software contain “potentially hundreds of patents [that] may be relevant to a particular computer or software technology” [40]. The primary way to challenge a patent under current law is through costly litigation. Intel suggests Congress create a balanced post grant opposition enabling third parties to challenge issued patents that includes a post grant opposition of 2 years from patent grant or 1 year from receiving notice of patent infringement. Simon also encouraged Congress to create a second window to make the post grant review meaningful. Simon suggested a limit on patent application continuations and for the court not to issue a continuation on any claim broader than the broadest claim previously published or issued. BSA suggested a stay on the lower court’s decision in interlocutory appeals before final determination by the Federal Circuit Court of Appeals. Micron Technology, Inc., a non-BSA member, suggested the same patent law reforms as BSA.
In a congressional hearing in 2006, Chandler [41] of Cisco (BSA) suggested a second window triggered by receipt of an infringement complaint. During the first window, the patent issues with thousands or millions of parts making the effectiveness of the patent examination questionable. Chandler (2006) encouraged Congress to make changes to remove venue shopping, and prevent suits from worldwide damages in United States Courts like the Microsoft and AT&T case. The only patent policy need described on the BSA website dated 1994 had no updates, which is understandable because United States Patent Policy has not changed significantly for more than 50 years and the proposed changes have not made it into law. The agreement with the Patent Reform Act was from the most influential voice for the Software Industry; nevertheless, there were disagreements within the Software Industry mainly arising from smaller companies and individual inventors. Software companies wanted patent reform by Congress but differences remained among large software companies and smaller organizations. An overhaul of the patent system and other measures to promote tech development efforts are top priorities of the Business Software Alliance, Cisco, Hewlett-Packard, and other big high-tech companies . BSA members began pushing for reform legislation to limit the number of patent infringement lawsuits, and therefore, the amounts paid in damages.
In an article in PC World dated March 9, 2008, patent reform leads a list of five legislative priorities expressed by BSA in 2008. The opinion article stated that BSA members want Congress to approve the Patent Reform Act but the legislation stalled in the United States Senate because of objections from inventors, pharmaceutical companies and some small tech (computer software) firms. In addition the article proclaimed, more than 170 California businesses and organizations oppose the Patent Reform Act in its current form. They mention that research to stay competitive is both expensive and risky, but strong protections from patent policy attract the necessary investments to commercialize a new product. This is especially the case for the hundreds of smaller, venture capital-backed firms in the state, of which many spun from California’s world-class research universities and private research institutes. According to GlaxoSmithKline, California Wireless and Mi5 Networks in paragraph eight on page one of Gross [42] (2008), the Patent Reform Act “would increase costs to obtain and maintain patents, undermine patent certainty, incentivize infringement, and weaken the enforceability of patent rights and intellectual property protections.”
Dr. Myhrovold [43-45] started Dynamical Systems, a software company, in 1984 that Microsoft bought in 1986. He worked with Microsoft from 1986 to 2000 (14 years). Myhrovold retired from Microsoft in 2000 to start another company, Intellectual Ventures, which files more than 300 patents a year making it the 25th largest inventing organization in America. Dr. Myhrovold stated “[Software is] a complex topic…and it’s all about company culture and how companies use patents” (Perspectives on Patents [46,47]. Continuing Dr. Myhrovold stated “…for most tech companies patents have never been important; they have never been a way to make money” (p. 76, para. 2), and “…patents are, at best, a distraction and most tech companies have made a deliberate decision to ignore the patent system” (p. 76, para. 5). Many other non-BSA members agreed with Myhrovold.
Defensive patenting by software companies explains if a company holds enough patents then this company can steal another product company’s ideas with impunity, but the problem enters when the other entity does not create a product to attack (Myhrovold, 2006, p. 77, para 3). These are the battle lines in the patent reform debate with universities, small inventors and pharmaceutical companies whose lifeblood is the patent system on one side, and companies who decide to infringe or at least do not care about infringing on the other side. Dr. Myhrovold is a witness from the vantage point of a Microsoft senior executive in the 1990s who discussed this role with other firms in the earlier rounds of patent reform debate.
Technology companies exaggerate the problem when over the last 20 years patents have remained in last place of lawsuits for the three forms of idea protection: trademark, copyright, and patents. A study of four high-tech companies that are active in the patent reform debate paid out $3.7 billion in patent lawsuit settlement from 1993 to 2005, but those same four companies earned $1.4 trillion in revenue over the same period making the sums for infringement only 0.26% of revenues on average. The company with the highest number of lawsuits experienced sums for infringement at only 0.51% of revenues. “Patent trolls” are companies that do not market a product but only the idea for a product. Companies that do not produce a product comprise only 2% of the patent infringement lawsuits. Software companies like to blame an innocuous group of patent troll companies when they themselves perform the same litigious practices blamed on trolls. Myhrovold stated the need to embrace the trend to make the alternate resolutions more like a court trial by creating a separate Patent Court, much like the Tax Court, Bankruptcy Court, or Divorce Court to try only specific cases.
Inter Digital is a technology and software company that disagrees with BSA’s proposed changes to patent law. Inter Digital’s Bernstein summarized the differences in the Software industry on page 220 last paragraph at the 2007 congressional hearings: “…the IT industry is absolutely not united in its support for mandatory apportionment, post grant opposition, expansive USPTO rulemaking authority, and interlocutory appeals fall outside the realm of patent ‘reform’.” Bernstein continues by expressing how such an action would degrade patent rights and increase litigation for smaller innovators. The weakening of legitimate patents would protect a few corporate giants and increase the number of lawsuits Bernstein (2007), [48,49].
An article by Mc Dougall [50] and Chabrow (2006), [51,52] in InformationWeek explains the problems as they perceive them with the Patent Reform Act from other software and computer companies. Hans Hxu, founder of online gift registry Felicite.com, says the industry’s large players want the appearance of IP openness but do not practice it. “IBM patents almost everything they do, and then they sit on it, which does not encourage innovation” (Microsoft Agenda, para. 3) says Hxu, a McKinsey consultant although other critics suggest the sellers’ moves cement their advantages when they face rising [53] competition from startups. In an August 2005 essay, Harvard Law School professor and tech entrepreneur James Moore argued the collaborative patent review proposed by IBM, Microsoft, and others would result in fewer patents issued because it would give examiners more ammunition to shoot down patent applications. “If fewer patents are issued, but existing patents are not revoked, IBM and Microsoft win because they already possess vast existing portfolios,” Moore writes (Microsoft Agenda, para. 4). Some Web 2.0 companies dismiss IBM’s argument that business-method patents protect obvious ideas. “Everything is obvious after someone has done it,” says a spokesperson for online movie renter Netflix (Microsoft Agenda, para. 5), which has patents on its queue-ordering system--and is suing Blockbuster for allegedly copying the system.
Small tech companies are taking matters into their own hands, forming patent cooperatives through which they share IPRs. Search company Wink shares in Creative Commons, a group that encourages sharing of copyrights and open source licenses, but there is a line between sharing and protecting intellectual property that creates competitive advantage, says Wink’s Chief Executive Officer (CEO) Michael [54,55] Tanne. “When companies have invested in the development of technologies, they really ought to be able to protect it,” Tanne says (Microsoft Agenda, para. 6). Resolving these issues will influence developing and commercializing tech innovations. Too many lengthy and expensive legal battles will persuade IT departments to stick with familiar technology, and this is something tech vendors should consider as they take one another to court.
The largest and best known pharmaceutical companies in the Pharmaceutical Industry represented by Pharmaceuticals Researchers and Manufacturers of America (PhRMA), Biotechnology Industry Organization (BIO), and the Professional Inventors Alliance disagree with the weakening of patent protection and the long, time frame proposed for patent reexamination. High R&D characterizes these industries and the Pharmaceutical Industry realizes a shortened patent protection because patent protection begins before FDA approval. This shortens patent protection to commercialize the product to the remaining years.
On September 17, 2007, The Professional Inventors Alliance expressed through a letter to President Bush the flaws in the Patent Reform Act of 2007. The Patent Reform Act of 2007 did not pass the United States Senate because of the opposition from PhRMA, small inventors, and small tech firms . The letter from the Professional Inventors Alliance expressed that if the Patent Reform Act of 2007 passed into law it would harm the United States’ innovative character because of the inability to enforce patents and would reduce the royalties associated with a patented technology. In 1980, PHRMA’s members invested $2 billion in R&D for new medicines; although, nearly 30 years later (in 2009), PHRMA’s members invested $50.3 billion in R&D out of the $65.2 billion industry-wide total. Pharmaceutical companies rely on government-granted patents to protect their substantial investments in researching and developing new drugs. It takes 10-15 years and costs $800 million on average to bring a new medicine to market. The Pharmaceutical Research and Manufacturers of America (PhRMA) represents the country’s leading pharmaceutical research and biotechnology companies.
Without patents to protect all the inventions necessary to develop a drug for a limited time, others could simply copy the drugs immediately, offering their versions at a reduced price because they did not incur the high costs to develop the drug. This would seriously affect the pharmaceutical companies’ ability to recoup their costs and reinvest in other research projects. PhRMA stated in 2010 that “a strong patent system is crucial to our economic [56,57] competitiveness, especially in these economically trying times” (PhRMA’s website, 2001, p. 1). The companies in favor and against the Patent Reform Act of 2010 divided into the companies that have favored and opposed the previous patent reform acts, that is, computer software favoring patent reform and pharmaceutical companies and biotechnology companies opposing patent reform. Those opposing and in favor of the patent reform acts through the six years in this study have not changed their needs but, instead, Congress changed trying to create a patent policy agreeable to most patent users.
The large pharmaceutical companies also known as the name brand pharmaceutical companies and the smaller, generic pharmaceutical companies were in general agreement on most issues. Both wanted strong patent protection and both sides were against the Patent Reform Bill [58] of 2005 and 2006 as stated in the congressional hearings on patent reform. The firstinventor- to-file patent system while harmonizing with the large United States trading partners also poses some difficulties and disagreements with United States patentees. The problems lay in the grace period of 1-year and the best mode requirement in the patent application. Harmonizing with other countries’ patent systems as currently written, such as Japan and Europe, would remove the United States grace period of 1 year to file a patent application and would remove the best mode requirement when filing a patent application. The best mode requirement is the descriptive part of the patent application the inventor has to include the inventor’s idea of how best to use or combine the chemicals for complete effectiveness.
The differences between the brand name and generic pharmaceutical companies lay in eliminating the best mode factor of the patent application and the inequitable conduct defense. Brand name pharmaceutical companies say the best mode provision of the patent law is subjective, and therefore should be removed. The generic pharmaceutical companies believe the best mode provision should remain because they cannot copy the patented medication without the recipe or the “best mode” of making the drug. By removing the inequitable conduct defense, brand name pharmaceutical companies will misuse the patent system to the harm of the public and generic pharmaceutical companies. Differences exist between the brand name pharmaceuticals and the generic pharmaceuticals. One example is the issue of patent quality: Best mode. Generic pharmaceuticals want to keep the “best mode” in the patent law language because it lowers cost of medications by allowing generic companies to copy name brand drugs more easily. Ely Lilly [59,60] and PhRMA want to remove the best mode language . The Generic Pharmaceutical Association also has qualms with weakening the inequitable conduct saying that weakening this provision gives brand-name pharmaceutical companies incentive to misrepresent their inventions.
The differences between the brand name and generic pharmaceutical companies lay in eliminating the best mode factor of the patent application and the inequitable conduct defense. Brand name pharmaceutical companies say the best mode provision of the patent law is subjective, and therefore should be removed. The generic pharmaceutical companies believe the best mode provision should remain because they cannot copy the patented medication without the recipe or the “best mode” of making the drug. By removing the inequitable conduct defense, brand name pharmaceutical companies will misuse the patent system to the harm of the public and generic pharmaceutical companies. Differences exist between the brand name pharmaceuticals and the generic pharmaceuticals. One example is the issue of patent quality: Best mode. Generic pharmaceuticals want to keep the “best mode” in the patent law language because it lowers cost of medications by allowing generic companies to copy name brand drugs more easily. Ely Lilly [59,60] and PhRMA want to remove the best mode language . The Generic Pharmaceutical Association also has qualms with weakening the inequitable conduct saying that weakening this provision gives brand-name pharmaceutical companies incentive to misrepresent their inventions.
Together the Case Lawre presented the most comprehensive line of court-led patent reforms, which makes patent reform substantially different in 2010 than 2005. Patent lawyers and the law association, AIPLA [63,64], believe that legislation is not necessary and the court system will eventually find a solution for compromise for the different users of the patent system and will define patent law through successive Case Law. Larger, more market capitalized firms make more noise and are heard more clearly than smaller, less capitalized companies or individual inventors, including companies that specialize in innovation but do not concurrently produce a product, also known as patent trolls. More innovation comes from smaller firms and individual inventors than large entities. The larger software enterprises that often infringe on patents held by companies that do not produce a product (patent trolls) behave similarly to the patent trolls. IBM and Microsoft sit on patents without an accompanying product, when another company discovers something similar the patent surprises the unsuspecting company, and a licensing or royalty agreement can avoid costly litigation. IBM earned over a billion dollars in 2005 solely from license agreements and royalties. Licensing and royalty agreements are another possible direction that companies take to avoid patent infringement suits; however, their use threatens other companies to ransom licensing or royalty agreements but is cheaper and the outcome more certain than litigation.
The Pharmaceutical Industry appreciates the current patent policy and is leery of any changes that would disrupt the current manner in which they use the patent system to optimize patent protection; also the Pharmaceutical Industry like the Software Industry makes the best of the current patent policy . Although pharmaceutical firms have to wait until after drug trials and resulting FDA approval to market the medication, which includes the 20-year patent term and drug approval sometimes lasts as much as 10 years, they too have found ways to evade current patent law to extend the patent length. The Pharmaceutical Industry commonly increases the shortened patent length by adding a known chemical to the patent protected drug therapy, and adds another patent protection term of 20 years by increasing the number of patents on a drug. One specific drug therapy created by a name-brand pharmaceutical firm that a generic company was exploring to copy had patent protection by more than 200 patents spanning 40 years.
Discussion and Conclusions
The specific research questions that framed this qualitative case study were 1. What is the evidence United States Patent Policy adequately protects Intellectual Property Rights [65] (IPRs) for both the Software and Pharmaceutical Industries? 2. How does the United States Patent Policy encourage companies to make research and development (R&D) investment in both the Software Industry and in the Pharmaceutical Industry? Based on the differences on how patent policy should read, issues of effectiveness of the United States Patent Policy to both protect and encourage IPRs and R&D investment should be considered. Patent policy in the United States has remained unchanged for the last 55 years, and has been effective in protecting IPRs and encouraging R&D investment. Pharmaceutical firms have been around many years and have flourished in the current patent policy environment. Only with the creation of the personal computer have software companies entered the scene and have expressed concern for the patent policy changes to reduce the software company’s purposeful infringement. In a few words, the large software companies want to weaken patent protections and reduce their costs to defend against patent infringement lawsuits because big software companies do not care about patents or patent infringement.
Three important findings from this study are
1. The Pharmaceutical and Software Industries use patent policy differently
2. BSA explicitly states they want a strong patent policy, but, in effect, want to weaken the current patent policy, and
3. Differences exist within each industry. Congress has attempted to improve patent law 6 years without success because there is not agreement pleasing all industries, but the principle differences embodied the Software and Pharmaceutical Industries.
Firstly, pharmacy and software use patent policy differently: Pharmacy to protect R&D and Software for defensive purposes. Software Industry (BSA) does not use the patent policy as designed to protect R&D, but to defend against the threat of patent infringement lawsuits. The testimonies to Congress provided evidence to answer my research question of how the patent policy requirements differ between the Software and Pharmaceutical Industries. The testimonies to Congress were clear and straightforward. I did not have to infer the meaning or needs of the witnesses. They clearly stated their position and what they wanted in patent policy. Many people in the Pharmaceutical Industry and smaller software companies specifically stated that larger software and computer companies began calling for patent reform to limit the many patent infringement suits against them. Myhrovold shared his experience working for Microsoft in the late 90s stating that large software companies are not concerned with infringing on another’s patents and the only reason they care at all about patents is to defend against patent infringement lawsuits.
Secondly, the data from congressional testimonies clearly showed that the Software Industry (BSA) verbalized they want a strong patent policy but, instead, they want to weaken the rights of patent holders. This weakening is from: An unlimited post patent review period, placing the burden of proof for infringement on the patent holder (instead of the offender), and limiting the damage awards for infringement to only the infringing part of an innovation. The testimonies clearly stated their position and what they wanted. The previous list clearly communicated to Congress what the Software Industry (BSA) wanted in a patent policy, and refuted by other expert testimonies in the Software Industry.
All BSA representatives stated they wanted strong patent protection, and continued with the above reasons, which amount to weakening a patent holders’ legal rights to their Intellectual Property Rights (IPRs). Many testimonies contrary to BSA stated specifically the reasons BSA wants to limit a patent holders’ IPRs is to stave off patent infringement lawsuits. Myhrovold (2006) shared that patent policy did not enter into Microsoft’s and other BSA members’ culture. Patents are not how software companies protect innovation, but, rather, secrecy, and lead time or economies of scale are more effective to protect innovation in a short product lifecycle industry. Thirdly, the entire Software Industry is not united with BSA, and the entire Pharmaceutical Industry is not united with PhRMA. Differences exist between the two industries and differences exist within each industry, such as difference between larger companies and smaller companies in Software Industry and brand name pharmaceutical versus generic pharmaceutical. Each expert clearly stated what they wanted, why they wanted it, and differences within their respective industries. The witnesses to the congressional hearings succinctly stated that the BSA or PhRMA did not represent the entire industry, and the industry was not united in its desires for patent policy. Siwik [66] said in the exact words that the Pharmaceutical Industry is not united, and based on the non-BSA members’ testimonies with them vehemently disagreeing with BSA’s stance, anyone would reach the same conclusions that BSA is far from united too.
The evidence suggests the two industries use patent policy in different ways. For instance, The Software Industry does not use the patent system to protect intellectual property but rather use the patent system for defensive purposes not so much to protect innovation but to defend against infringement lawsuits. Pharmaceutical industry relies heavily on a patent protection to recover large R&D spending. The evidence was found in examples of how each industry effectively uses the patent system. Based on research of the patent system and the evidence of how each industry uses the patent system, the data would suggest agreement with many of the pharmaceutical, biotechnology, and other industries that use the patent system effectively to protect research and development dollars that the system does not need major change. Research shows the answer to the question of how the United States Patent System encourages R&D and promotes innovation; the patent system performs well according to its design. It protects ideas. The current patent policy is effective in protecting innovation and encouraging research and development spending.
For more Open Access Journals please visit our site: Juniper Publishers For more articles, please click on Journal of Organic Medicinal Chemistry
0 notes
Text
Valuation of Nutrient Utilization, Protein Requirement and Proximate Assessment of an Ecotype Tilapine ‘Wesafu’ Fingerlings Reared in Earthen Pond
Authored by: Albert O Amosu
Abstract
This study was conducted to evaluate the nutrient utilization, protein requirement and proximate analysis of Wesafu from fry to fingerlings in an earthen pond. The experimental fish were monitored for comparative analysis and growth performance using commercial feed (Coppens® 0.2mm) and wheat flour in formulating feed with 30%, 35%, 40% and 45% crude protein levels. Fry were fed thrice daily at 8am, 12 pm and 4pm with 5% body weight for 8 weeks. Samples of experimental diet and fingerlings were analyzed for proximate composition while growth performance and nutrient utilization of diet were evaluated using growth indices such as Weight Gain (WG), Percentage Weight Gain (%WG), Specific Growth Rate (SGR), Food Conversion Ratio (FCR), Gross Feed Conversion Efficiency (GFCE), Protein Intake (PI), Protein Efficiency Ratio (PER). The results revealed that the highest cumulative weight gain (10.58 ± 0.12) was recorded in fry fed 45% crude protein diet while the lowest (6.58 ± 0.21) was observed in the 30% crude protein diet .There were no significant differences (p>0.05) in specific growth rate, food intake, food conversion ratio, gross food conversion efficiency and protein efficiency ratio while there were significant differences (DNMRT; ANOVA; df = (n-1); p < 0.05) in weight gain, protein intake. This study indicated that a diet containing 45% crude protein appear to be suitable for rearing Wesafu fry to fingerlings in earthen ponds.
Keywords: Aquaculture; Cichlids; Diet; Ecotype; Fingerlings; Growth; Nutrient; Wesafu
Abbreviations: WG: Weight Gain; FCR: Food Conversion Ratio; GFCE: Gross Feed Conversion Efficiency; PI: Protein Intake; PER: Protein Efficiency Ratio; SGR: Specific Growth Rate; LSD: Least Significance Difference; DNMRT: Duncan’s New Multiple Range Test; SE: Standard Error
Introduction
As the global population continues to rise, the need for sustainable alternative sources of protein also increases [1]. Research estimated that the worldwide requirement for food will increase up to 50 % by 2030 [2]. Juxtaposing the production input efficiencies of aquaculture versus several of fisheries and terrestrial agriculture systems shows that aquaculture is among the world’s most efficient mass producer of protein [3]. Protein is the most important constituents of fish and also the most expensive constituent of fish feed and global expenditure exceeds (7.05 million MT) €1bn per annum [4,5]. Aquaculture production is growing at a rate of nearly 9% per annum [3,6]. As wild fish stocks decline, the aquaculture industry faces a massive challenge to identify cost-effective and environmentally friendly alternatives to fish production on which it is so heavily reliant [1,7]. Cichlid aquaculture has the potential to provide a solution to this problem as it is relatively underexploited in Nigeria and can be cultured in a sustainable manner [8]. Cichlids are one of the most diverse fish species and widely cultivated fish families in the world, though their natural distribution was confined to North America, Central America, South America, Africa and the Mid East [9]. The family has been introduced into various continents including Australia [10]. Wesafu is an indigenous ecotype cichlid, very important specie of the fisheries of Lagos coastal waters in Nigeria [11-12]. The diversity of an unidentified cichlid of great abundant in Epe Lagoon commonly referred to as Wesafu and the large size cum weight it attains in the wild influence the drive for possible domestication, culture and exact identification and naming of this specie [13-14]. Several research studies have been conducted on this indigenous specie such as Age and growth, Aquaculture system, Characterization, food and feeding habits, nutrition, meristic and morphometric characters among others [11-22].
Tilapines are Cichlids with fast growth, resistant to diseases and handling, easy to reproduce and are able to tolerate a wide range of environmental conditions. They are widely cultured in tropical and subtropical regions of the world and constitute the third largest group of farmed fin fish with an annual growth of about 11.5% [3,23-25]. Proper feeding management is therefore a necessary tool for successful tilapia culture. Nutrition and feeding play important role in sustainable cichlid aquaculture therefore, feed resources as well as costs continue to dominate aquaculture needs. Feed accounts for 40-60% of the total production costs in aquaculture, with protein sources accounting for a significant proportion of this cost [1,3,22-24]. Frys and fingerlings require diets higher in protein, lipids, vitamins, minerals and lower in carbohydrate as they are developing muscles, internal organs and bones with rapid growth. Adult fish needs more calories of fats and carbohydrate for basal metabolism and a smaller percent of protein for growth [19]. The energy needs of the fish can be met by less expensive lipid and carbohydrate sources. The protein requirement of tilapia was estimated to be from 25% to 45% of diet [26,29-34]. Under natural condition, Tilapia is predominantly an herbivore and a detritus feeder. This means that they can provide high quality protein, suitable for human consumption from less protein sources [35]. Inabilities to develop suitable commercial and improved strain of tilapias that will grow to table size in good time are few of the problems militating against a viable tilapia industry in Nigeria [14]. The problem of precocious sexual maturity and unwanted reproduction has long been accepted as a major constraint to further development and expansion of tilapia culture in Nigeria. In addition, unwanted reproduction which leads to excessive recruitment (overpopulation), particularly in ponds, resulting in competition for available food and space resources as well as the ease of reproduction represents the principal problem in the optimization of yield in tilapia culture. Therefore, this research was geared towards determining the growth performance, dietary protein requirement and nutrient utilization of this economic important ecotype cichlid. The increased intensification of culture method for warm water fish such as tilapia has necessitated the provision of balance ration to satisfy the dietary requirement. Despite the commercial values of Wesafu, a tilapia highly priced fish in Lagos, Nigeria due to its tasty flesh and large size of over 1500g in the wild, little information exists on its nutritional requirements, in cultural practices yet it has culture potential in the country.
Materials and Methods
Experimental fish
One thousand four hundred and forty (1440) fry of average weight of 0.93 ± 0.16 were used in determining the protein requirement of Wesafu. The fish was raised from fry to fingerlings stage at Seg farm a private aquaculture farm in Topo village (6°25’0’’ N; 2°55’59’’ E) (Figure 1) on the West Coast of Badagry, Lagos, Nigeria. Fry were weighed and stocked in hapas. Prior to feeding trials, the experimental fish were starved for a day (24h) to ensure that their guts were emptied.
Experimental Design
Twelve (12) hapas (1 × 2 ×1.5m) were placed in earthen pond were used which was conducted in four stages:
a) Fry fed with 30% crude protein represent A in triplicate
b) Fry fed with 35%crude protein represent B in triplicate
c) Fry fed with 40% crude protein represent C in triplicate
d) Fry fed with 45% crude protein represent D in triplicate The fish were divided into one hundred and twenty (120) fry, stocked per in twelve different hapas in three replicates of 30%, 35%, 40% and 45% crude protein level and fed at 5% body weight. The 5 % the daily ratio was divided into 3 equal parts and fed at 8a.m, the second portion at 12p.m and the third portion at 4p.m. Each unit of experiment lasted for 8 weeks. Coppen 0.2mm feed was used with a protein content of 56% (Manufactured by Alltech Coppens Aqua Center, Germany) and wheat flour of 12% to formulate the diets using Pearson square method. All these hapas were placed in earthen pond in the farm and were covered with net to prevent the fish from escaping.
Determination of growth performance and nutrient utilization
Weight gain (wg)
The weight gain by fish was calculated from the differences between the final mean and the initial mean weight that is the final mean weight of fish at week eight subtracted from the initial mean weight of fish at week zero [36].
Weight gain (WG) = final weight (W2) – initial weight (W1) WG = (W2) – (W1)
Where:
W2 = Final mean body weight (g)
W1 = Initial mean body weight (g)
Percentage Weight Gain (%WG)
The percentage weight gain was calculated from the formula according to [14].
% weight gain = (X2 ) – (X1)×100 / (X1)
where:
X2 = Final mean body weight (g)
X1 = Initial mean body weight (g)
Specific Growth Rate (SGR)
Specific growth rate was calculated according to [36] as
SGR = Loge W2 – Loge W1 / T2 – T1
where:
W2 = Weight of fish at time T2 in days
W1 = Weight of fish at time T1 in days
Loge = Natural log of base e
Food Conversion Ratio (FCR)
Food conversion ratio according to[36] as FCR, expressed as the proportion of dry food fed per unit live weight gain of fish:
FCR =Weight of dry fed (g) / Live weight gain (g)
Gross Food Conversion Efficiency (GFCE)
The gross food conversion efficiency was calculated according to [36] as the percentage of the reciprocal of feed conversion ratio.
gFCR = 1×100 / FCR
Protein Intake (PI ) = Total feed intake × % protein in the diet Protein Efficiency Ratio (PER) = weight gain / Protein intake
Nutrient Evaluation of Experimental feed and fish
Samples of experimental feeds and fish were analyzed for their proximate composition according to the methods of [37].
Moisture content
The moisture content of the different fry samples were determined
% Moisture content = M1 − M2 / M1 − M0 × 100
where
M0 = Weight in g of fish and lid
M1 = Weight of g of dish, lid and sample before drying
M2 = Weight in g of dish, lid and sample after drying
M1 − M0 =Weight of sample prepared for drying
% dry matter content = 100 − % moisture content
Crude protein
Determination of crude protein was done using total kjeldahl nitrogen method.
% Nitrogen = 0.0075× A / B ×C
where
A = Mg /L reading displayed
B = g – sample digested
C = ML digest analysed
Determination of crude fat or lipid
The measure fat content of all the soluble materials present was determined according to [38].
% Fat = W3 –W2 /W1
where
W3= Weight of the cup with the extracted oil.
W2 =Weight of the empty cup
W1 =Weight of the sample.
Determination of the total ash
The percent of ash was calculated as follows:
Percentage (%) of ash = (weight of ash / weight of sample)×100 % Ash = (W2 /W1)×100
where,
W1 = Weight of sample (g)
W2 = Weight of ash (g)
Determination of crude fibre
The amount of the crude fibre content in the sample was determined using the acid/base digestion process [39].
% Crude fiber =Weight A −Weight B / Sample Weight
Where
Weight A = Weight of crucible + dried residue
Weight B = weight of Crucible + residue ashed
Statistical Analysis
All data collected were presented as mean values of each determination ± standard error (SE). Analysis of variance was performed using one way ANOVA procedure. Differences between the mean values of the treatments were determined by the least significance difference (LSD) test and the Duncan’s New Multiple Range Test (DNMRT). The significance was defined at p < 0.05.
Results
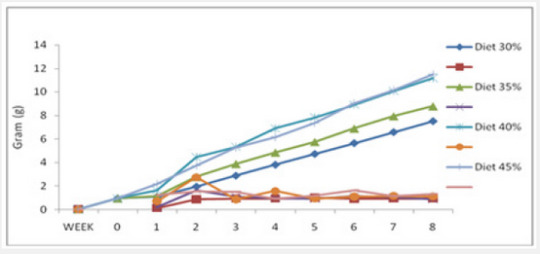
The result of the experiment shows that there was increase in the weekly growth rate, weekly feed intake, and food conversion ratio, protein intake while there was decrease in the weekly Specific Growth Rate, Gross Food Conversion Efficiency and the Protein Efficiency Ratio. It was observed that the weekly feed intake consumed increased per week in the following sequence Diet 1 > Diet 2 > Diet 3 > Diet 4 (Table 1). The weekly mean of total feed consumed showed a progressive increase throughout the experiment and there was significance (p<0.05) difference throughout the experiment. The weekly mean weight in Figure 1 shows increase trend from week one to week eight and there was significance difference (p< 0.05) between the crude protein levels throughout the experiment.
The weekly mean of total feed consumed showed a progressive increase throughout the experiment and there was significance (p<0.05) difference throughout the experiment.
No significance difference (p > 0.05) observed in weight gain for week 6 and 7 and significance difference was observed throughout the remaining weeks. Also, there was no significance difference (p > 0.05) observed between specific growth rates of the dietary protein level in week five and seven and there was significance in the rest of the week. The weekly specific growth rate decreases throughout the duration of the experiment (Figure 2).
No significance difference occurred (p > 0.05) in week 3, 6, 7 and 8 and significance difference was observed in week 1, 2, 4 and 5 (Figure 3). The food conversion ratio increases throughout the experiment. It was reveal that Gross Conversion Efficiency decreases throughout the duration of the experiment and significance difference (p < 0.05) was observed from week seven to week 8 whereas no significance difference observed from week 1 to week 6 (Figure 3).
There was significance difference (p < 0.05) throughout the experiment and the protein intake increases throughout the experiment. Significance difference (p < 0.05) was observed in the protein efficiency ratio expect for week four where there is no significance difference in the fry fed with the four experimental diet (Figure 4). No significant differences (p > 0.05) in specific growth rate, food intake, food conversion ratio, gross food conversion efficiency and protein efficiency ratio while significant difference (p < 0.05) in the weight gain, protein intake (Table 2).
Table 3 shows proximate analysis of feed Percentage crude protein had the highest mean value in each Diet 34.37 ± 0.12, 28.47 ± 0.25, 26.86 ± 0.26, 24.04 ± 0.48, the lowest value was observed in Fat content for Diet 1, Diet 2, Diet 3 and Diet 4 had 7.31± 0.12, 5.22± 0.05, 5.16 ± 0.05 and 4.81 ± 0.07 respectively. The proximate analysis of fish sample in each Diet; the percentage crude fiber had the highest mean value of 40.18 ± 4.79, 47.52±0.55, 45.76±0.08, and 43.95±0.39 and fat content has the lowest Diet of 2.91 ± 0.04, 2.69 ± 0.04, 2.19 ± 0.08 and 2.24 ± 0.09 (Table 3). The experimental earthen pond water temperature, pH, dissolved oxygen and total alkalinity ranged from 27-28.5°C, 6.8-7.5, 5.8- 6.4ppm and 120-128ppm, respectively during the entire rearing period.
Discussion
The highest cumulative weight gain was recorded in fry fed on Diet 1(45%) with 10.58 ± 0.12 while the lowest was observed in fry fed with diet 4(30%) with 6.58 ± 0.21, similar findings have been reported by different authors for different tilapia species that the dietary protein requirements of several species of tilapia have been estimated to range from 20% to 56% [33,34,40-42]. The specific growth rate decreased throughout the duration of the experiment. The highest food conversion ratio was observed in the fry feeds with Diet 2 crude protein with the value of 0.32 ± 0.57 cumulative. The other feeds 30%, 35% and 45% crude protein recorded 0.25 ± 0.04, 0.32 ± 0.57 and 0.25 ± 0.04 respectively which were similar to [43]. The highest cumulative gross food conversion efficiency was recorded in the fry fed with 532.14 ± 131.12 and the lowest gross food conversion efficiency was recorded in fry fed with 35% crude protein with the value of 412.48 ±105.57 corresponding to the observations of [41,42]. The fry fed on Diet 2 crude protein recorded the highest protein efficiency ratio and fry fed with Diet 1 crude protein diet recorded the lowest protein efficiency ratio. PER, in the present study, was significantly affected by protein levels and manifests that protein utilization was obtained at low protein level. The decrease of PER with increasing dietary protein level have also been reported by different authors for different tilapia species [44,45]. This was mainly because more dietary protein is used as energy when high protein Diets are fed to fish [30,40]. The highest cumulative protein intake was recorded in the fry fed on on Diet1, having a value of 8.75 ± 1.43, this was followed by Diet 2 with the value of 7.40 ± 1.34. Frys fed with diet 3 with the value of 5.17 ± 0.91 and this was observed to the lowest experimental Diet which was fry fed with Diet 4 which recorded 3.74 ± 0.71. The proximate analyses of sample feed fed fry of Wesafu showed that the percentage crude protein was highest in the feed with 45% having a value of 34.37 ± 0.12 and the lowest was observed in feed with 30% with value of 24.04 ± 0.48. The formulated experimental feed with 40% recorded 28.47± 0.25 while 35% recorded 26.86 ± 0.26. Fry on proximate analysis recorded better productive protein values in the 45% feed with the value of 19.99 ± 0.35, 35% feed with value of 18.26 ± 0.12 followed by 40% feed with 17.61 ± 0.08 and 30% with 17.71 ± 0.17.
Conclusion
This study clearly indicated that diet containing 45% crude protein bodes well for cichlid aquaculture industry and appear to be suitable for rearing Wesafu fry to fingerlings in earthen pond with the potential to be a successful feed and alternative replacement for coppens in tilapine feed formulation.
To Know More About Oceanography & Fisheries Open Access Journal Please click on: https://juniperpublishers.com/ofoaj/index.php
For more Open Access Journals in Juniper Publishers please click on: https://juniperpublishers.com/index.php
#Juniper publishers#Open access Journals#Peer review journal#Juniper publisher reviews#Juniper publisher journals
0 notes
Text
Non-Destructive Control of a Hydraulic Hammer Piston, Designed for Geological Exploration Activities

Authored by: Kamelia Kalchevska
Abstract
The piston part provided to us by the Bulgarian company to clarify the reason for its breakage.
Keywords: Steels; Non-destructive testing; Macrostructure
Standards used in Peer Review
a) BS EN 13018:2016 Non-destructive testing. Visual testing. General principles Released: 2016-02-29
b) BS EN 13927:2003 Non-destructive testing. Visual testing. Equipment, 2003
c) BS ISO 5579:2013 Non-destructive testing - Radiographic testing of metallic materials using film and X- or gamma rays - Basic rules
d) ISO 3452-1:2013 Non-destructive testing - Penetrant testing - Part 1: General principles
e) ISO 3452-2:2013(en) Non-destructive testing - Penetrant testing - Part 2: Testing of penetrant materials
f) BS EN 10228-2:2016 Non-destructive testing of steel forgings. Penetrant testing
g) ISO 23277:2015 Non-destructive testing of welds - Penetrant testing- Acceptance levels
h) ISO 10675-1:2016 Non-destructive testing of welds - Acceptance levels for radiographic testing - Part 1: Steel, nickel, titanium and their alloys
i) EN ISO 17637:2016 Non-destructive testing of welds - Visual testing of fusion-welded joints
j) EN 1371-2:2015 Liquid penetrant testing - Part 2: Investment castings.
Test Method
Visual inspection according to standards [1,2]. No defects in the base metal, as well as surface staining are observed.
Material - after the spectral analysis it was found that the sample is made of steel type 40Ch2N2MA. Analog to DIN 1.6565 40NiCrMo 6. Analog: Japanese brand JAPAN JIS No. G 4103 steel grade SNCM8 of type.
The rolled product made of the above-mentioned material with ф160mm and in the range of 100 ÷ 400 mm is with subsequent heat treatment of the forging-hardening 850oС in oil and annealing at 610oС, which allows a part made with additional machining to be loaded to energy impact 5120 J according to the provided documentation (Figures 1 & 2).
After the performed radiographic control according to the current standards BDS EN ISO [3] and [4], Figures 3 & 4 show the found inadmissible pores and voids A> 10%.
Conclusion
The FUROKAWA FXJ 275 hydraulic hammer part was broken due to the large number of cracks inside the forging, as well as pores and cracks at two diametrically opposite ends, leading to the formation and development of a highway crack [5-9] (Figure 5).
To Know More About Juniper Online Journal Material Science Please click on: https://juniperpublishers.com/jojms/index.php
For more Open Access Journals in Juniper Publishers please click on: https://juniperpublishers.com/index.php
0 notes
Text
Individual Neuronal Apoptosis Provokes DeterminedNecrosis of the Regional Cerebral Infarct in Patients with Ischemic Stroke
Authored by Lawrence M Agius

Abstract
Interplay pathway dynamics are constitutive agonists in an evolving ischemic focus within the brain that is triggered by apoptotic programmed cell death that is subsequently established as a necrotic focus of infarction within the cerebral cortex of many patients with stroke. The evolutionary dynamics further permit the activation of potentially neuroprotective measures that primarily attempt limitation of involvement of adjacent less injured neurons but subsequently by the establishment of transformed penumbra to a necrotic focus of infarction. Within such contextual transformations, the individual apoptotic neuron determines the characterized infarcted region as necrotic focus formulation. Individual neuronal apoptosis provokes determined necrosis of the regional cerebral infarct in patients with ischemic stroke.
Go to
Introduction
Stroke patients comprise a large number of patients with a highly significant degree of cerebral ischemia that is best exemplified by the transient focal ischemia models in experimental animals such as rat and mouse. Mechanisms include bioenergetic failure and loss of cell homeostasis, and also acidosis, excitotoxicity and disrupted blood-brain barrier [1]. A central issue is the series of set conditioning factors that induce apoptosis of individual neurons within the penumbral region of the cerebral cortex on the one hand and the development if neuronal necrosis on the other. Combined steroid administration inhibits ischemia-induced apoptosis of neutrons through involvement of the intrinsic pathways [2]. It would appear that a combination of both apoptosis and necrosis of neurons evolves in at least some of the patients, and indeed neurons may exhibit features of both these forms of neuronal cell death when electron microscopic studies are combined with molecular and biochemical modes of analysis. Whether necrosis or apoptosis occurs often depends on cell type, cell age and location in the brain. Apoptosis leader to protein crosslinking, DNA fragmentation, ligand expression for phagocytic cell receptors and subsequent phagocytic uptake [3].
Neuroprotection
It is idealized that a set of potentially neuroprotective mechanisms is activated within the penumbral region of an evolving cerebral infarct. Oxidative stress contributes to ischemia/reperfusion with blood-brain barrier disruption, inflammation necrosis and apoptosis; Nnclear factor-E2-related factor 2 is central to regulated antioxidant defence and may protect against ischemia-induced neuronal injury [4]. Such coupled phenomena are central to the establishment of the expanding infarct secondary to delayed death of more neurons in the few days following the primary acute infarction of the core lesion. Glycine inhibits tumor necrosis factor alpha and protects agains inflammation and gloss in hypoxia-ischemia of neurons [5]. Such considerations are believed to potentiate the possible beneficial attempts at reducing infarct size within the acute dimensions of ischemic injury to neurons.
Glial cells
Glial cells such as astrocytes and microglia are implicated in neuroprotection and indeed the cellular network of gap junctions between individual astrocytes are viewed as supportive elements in neuroprotection. The dimensions of complex control of ion-motive ATPase channels collaborate with the dynamics of possible recovery of related ischemic neurons that implicate a regional characterization and re-characterization of the ischemic injury not only to individual neurons but also to groups and sizeable aggregates of such neurons. Auto-antibodies to apolipoprotein A-1 are associated with poorer clinical recovery and increased brain lesion volume 3months after acute ischemic stroke [6].
Dynamics of ischemic injury
Genetic evidence exists that separates apoptosis from necrosis through different forms of nuclear pyknosis, with conservation of nuclear pyknosis in the propagation of necrosis [7]. Performance dynamics of the acute ischemic focus also implicates microglia that are implicated in removal of ischemic individual neurons following acute ischemic injury. The distributional coherence of integral groups of ischemic neurons is hence mirrored by presumably apoptotic individual neurons undergoing damage primarily to mitochondria and to lipid moieties of the plasma membrane of the cells. In such context, the evolving participation of apoptosis and necrosis would permit the progression of caspase pathway activation and the release of cytochrome c release from mitochondria. Also, destabilized cellular calcium homeostasis follows a stereotyped pattern of changes that invokes execution pathways of neuronal cell injury.
The phagocytic receptor CED-1 is activated through interaction with its ligand phosphatidylserine (PS) exposed on the surface of necrotic neutrons; calcium influx activates a neuronal PS-scramblase for PS exposure [8]. A complex array of executing agonists include excitotoxic, oxidative and lipid peroxidation, and metabolic insults such as hypoglycemia participates within contexts of activated apoptotic pathways, as evidenced by the neuroprotective effects of administered caspase inhibitors in the acute phase of ischemic insults. Epigenetic regulatory networks in ischemic stroke may protect against oxidative stress with induced DNA methylation, histone modification and microRNAs, with affected redox state in neutrons, glia and vascular endothelial cells [9].
Determined pathway events
Determined outcome of the ischemic individual neuron and also of groups of such neurons is affected by "ischemic preconditioning" whereby a mild episode of ischemia generates resistance to a second ischemic episode. Certainly, the panoramic contexts of evolving ischemic injury within neurons is programmed within the pathways primarily dictated by individual cellular responses to ischemia that however originates as a regional focus of groups of ischemic neurons. Platelet- activating factor receptor is expressed on cellular and nuclear membranes of leukocytes, platelets, endothelial cells, neurons and microglia; its deficiency is experimentally associated with prevention of caspase-3 activation and decreased vascular permeability and cerebral edema. Decreased brain levels of tumor necrosis factor-alpha, interleukin-1beta and the chemokine (C-X-C motif) ligand 1 may be crucial in global brain ischemia-reperfusion [10].
Particularly intriguing is the overlap of regional and individual cell ischemic episodes that determine the onset of a core of necrotic cerebral tissue in the first instance and the subsequent creation of a penumbra of regional and partially injured neurons and glial cells. It is further to such phenomena that the ischemic episodes are regional also as evidenced by activated neuroprotective mechanisms such as the action of neurotrophic factors and of some cytokines such as tumor necrosis factor alpha and interleukin 1-beta. The PPAR gamma agonist 15d-PGJ2 regulates microglial activation and decreases tumor necrosis factor aha and interleukin-1 expression. Fewer apoptotic cells and less CD68 positive staining in diabetic schema rats [11].
Chaperone dysfunctionality allows for an evolving train of events in the execution of both apoptosis and necrosis within the individually affected neurons and as further portrayed by the dynamics of the expanding penumbral region. 4'-O-beta- D-Glucosyl-5-O-Methylvisamminol, a natural histone H3 phosphorylation epigenetic suppressor is a neuroprotective factor by acting via the PI3K/Akt singling pathway in focal ischemia in rats [12]. It is further to such processes that the integral identity of cell-death phenomena permits the execution of individual cell damage as dictated by regional injuries to the cerebral cortex in particular. pH gradient difference around cerebral foci of ischemia may allow delivery of polyethylene glycol-conjugated urokinase nano gels with effective thrombolysis of the ischemic stroke [13].
Performance attributes
Performance attributes characterize hence the emergence of a necrotic core to the ischemic focus in a manner that potentiates the evolutional progression of the penumbral region of partially injured neurons. MicroRNA-9 is down regulated in mice with middle cerebral artery occlusion and oxygen-glucose deprivation neurons, with suppression of neuronal apoptosis on its up regulation [14]. The parameters of acquisition of cellular ischemic injury is mirrored in the evolutionary course dynamics of such events as the emergence of a multitude of agonists that portray the character of primary core necrosis by the penumbral region of conditioned delay of individual cell death within contexts of transforming apoptotic cascades within such individual neurons.
Apoptosis
The ischemic neuron undergoing apoptosis is generally associated with adjacent cells that do not show apoptosis phenotype characteristics and as such this has implicated microglial phagocytosis of the individually damaged neuron. Such a phenomenon however is contrary to the widespread focus of integral ischemic injury to the cerebral cortical region and is also at variance with a presumably programmed response to injury to cellular networks. Tissue necrosis in particular is a conceptual realization of regional fields of perfusion and re-perfusion events arising from compromised individual vessels of supply. Penehyclidine hydrochloride down regulates the phosphorylation of JNK, p38MAPK, and c-Jun and protects neutrons against ischemia/reperfusion [15]. Ongoing phenomena such as the no-reflow events within the vessels of supply allow for complicated series of processes involving neuroprotective measures. Scite;;arom down- regulates expression of angiotensin-converting enzyme and ATI receptor with neuroprotective effects [16]. The activation of heat shock protein such as HSP-70 and increased secretion of glucocorticoids during the acute ischemic episode allows for the emergence of constitutive pathways that on the one hand further injure the neurons and on the other hand actually enhance potential resistance to acute neuronal ischemia.
Apoptosis/necrosis interplay
The apoptotic neurons exhibit characteristic cell body shrinkage and condensation of chromatin that progresses as fragmentation of the DNA and the appearance of single- and double-strand breaks of the DNA molecules. Such events may be related to the cytoskeletal injuries that occur in individual neurons such as those caused by depolymerization of actin filaments by gelsolin. Release of calcium from endoplasmic reticulum stores is characterized as an end-pathway that is reflected in individual cell death. Mitochondrial dysfunction further correlates with the onset and participation of injurious events as evidenced by programmed cell death pathway activations. Apoptosis of individual ischemic neurons is hence a contextual setting for necrosis of core foci within the lesion as further indicated by the subsequent establishment of a truly necrotic focus of cerebral infarction. The delivery of multi-components would further confirm the derivation of programmed cell death as determining agonist series of pathway events in establishment of further increased injury to individual neurons and regional groups of ischemic neurons. Etanercept, a recombinant TNF receptor (p75)-Fc fusion protein, may with repeated administration prevent exacerbation of cerebral ischemic injury in the diabetic state, mainly through anti-inflammatory action [17].
Go to
Conclusion
Dynamics of calcium influx and of calcium release intracellularly include the participation of neuronal programming in cell death that is regionally characterized by dynamics of individual neuronal self-programmed cell death. As is evidenced by such dynamics of processed de-control of agonists such as mitochondrial dysfunction with release of cytochrome c and the lipid peroxidation pathways on the one hand, and of the oxidative end-products primarily affecting membrane lipids and calcium membrane channels, on the other, there evolves a regional/individual cell interplay of integral ischemic and hypoxic elements in the pathogenesis of cerebral infarcts. In such terms, evolutionary dynamics is collaborated pathway event in re-characterized potential neuroprotection of adjacent neurons within the adjacent cerebral cortex in many patients suffering from ischemic stroke. On the other hand, the transforming dimensions of injury to neurons are interplay supportive elements that profile-determine cell apoptosis that, in turn, may lead to potential necrosis of cerebral tissue.
For more open access journals in juniper publishers please click https://juniperpublishers.com/
For more articles on Open Access Journal of Neurology & Neurosurgery Please click on https://juniperpublishers.com/oajnn/
Open Access Journal of Neurology & Neurosurgery in Full text in Juniper Publishers
https://juniperpublishers.com/oajnn/OAJNN.MS.ID.555612.php
#juniper publishers Reviews#Juniper Publishers#Juniper Publishers group#juniper publishers peer review#Juniper Video Articles
0 notes
Text
Health Promotion Program of Yoga Exercise among Female in Workplace

Authored by Su Ying Tsai
Introduction
Working women are a larger part of workforce than in previous generations. Premenstrual syndrome (PMS) is a common disorder in menstruating females. All women, regardless of race, age, or socioeconomic status, have experienced discomfort during their menstrual periods. Painful menstrual periods or PMS are the most common gynecologic problems as well as the most common reason for increased absenteeism and more workdays with 50% or less of typical productivity per month in female employees [1]. Females with PMS report a poorer perceived quality of sleep [2] and health-related quality of life [3-5], and PMS may result in a depressed mood and greater psychiatric comorbidity [6]. Severe menstrual symptoms lead to increased healthcare utilization, decreased occupational productivity, and absence from work [7].
In recent years, with the rise of educational level and social changes, female labor force has become an indispensable stable foundation for economic development in Taiwan. To our knowledge, when female workers have PMS in the workplace in Taiwan, care personnel in the workplace usually provide heat packs or suggest bed rest at a health center or may provide painkillers. These methods, which merely alleviate female workers’ pain at the time the menstrual cramps occur, are not preventive methods. Recent studies reported an association between exercise and PMS and indicated that a regular exercise habit might be associated with a decrease in some physical and psychologic premenstrual symptoms [8-9]. Exercise is commonly listed as a remedy for PMS. Hence, more and more workplaces and employers are attempting to determine preventive methods or health promotion activities that can ameliorate PMS in female workers during their menstrual periods.
A growing body of evidence indicates that yoga benefits physical and mental health by down regulating the hypothalamic-pituitary- adrenal axis and the sympathetic nervous system [10]. Yoga is a mind and body practice with historical origins in ancient Indian philosophy. Many clinicians treating persistent pain hear about the benefits of yoga from patients who frequent yoga centers. Yoga classes specifically designed for women with PMS have increased, but there is little research about the efficacy of these classes. No research in Taiwan has addressed improvement or changes in female workers’ menstrual discomfort through interventional psychologic and physical yoga activities in the workplace. The research setting was Company C, a large electronics manufacturer requiring highly labor-intensive work in the Tainan Science Park in Southern Taiwan. This company has many female employees of reproductive age, the director of health management pay attention to female employees’ premenstrual disorders and the negative impact of premenstrual symptoms on occupational productivity and attendance. The yoga exercise program was 12 weeks long and featured physically and psychologically interventional yoga activities to determine changes in female workers’ menstrual discomfort.
This study invited all eligible employees (female employees aged 20 to 45 years who were healthy premenopausal women, taking no oral contraceptives, and taking no medication during the last 3 months) and all of them voluntarily participated in this program. Written and signed informed consent was obtained from each participant. The yoga teacher personally guided each participant’s yoga exercise activities at twice-a- week 50-min sessions after work in the plant’s fitness center. There were four yoga classes a week to choose from, allowing participants to select the most convenient time to participate in two yoga classes per week. Each 50-min session comprised a 5-min breathing exercise, 35-min yoga pose practice, and 10-min supine meditation/relaxation. Before starting the yoga exercise intervention programs, we administered a structured self- report questionnaire to the participants to collect information about baseline menstrual pain scores, premenstrual symptoms, and health-related quality of life during the prior 6 months. At the end of the 12-week yoga exercise intervention, we administered the same questionnaire to evaluate changes in the participants’ menstrual discomfort.
A total of 64 participants completed the intervention study. Data revealed that moderate or severe effect of menstrual pain on work was reported by 53.1% participants, with 35.9% subjects reporting the need for analgesics every month during menstruation to relieve menstrual pain. The comparison of characteristics of menstruation before the yoga exercise intervention and after 3 months revealed that 14% participants significantly decreased their use of analgesics during menstruation and the prevalence of a moderate or severe effect of menstrual pain on work significantly declined 23.4% after the yoga exercise intervention. Menstrual pain scores above 80 were reported by 14.1% subjects before the intervention, but after 12 weeks of yoga exercise the prevalence decreased to only 4.7% of subjects. The 12-week yoga exercise intervention was significantly correlated with decreased prevalence of four physical symptoms, including abdominal swelling, breast tenderness, abdominal cramps, and cold sweats.
Based on this data, these findings suggest that yoga exercise in the workplace effectively reduces the symptoms of PMS and can be applied to other woman-friendly workplaces to relief PMS. The results will contribute to our understanding of the current status of a menstrual health-friendly workplace environment for female employees and can be used to establish a model for a healthy lifestyle with a regular yoga exercise to decrease the negative impact of premenstrual symptoms. However, this program has some limitations [11]. Nevertheless, workplaces and employers can help female employees to understand the benefits of regular exercise, such as yoga, which may decrease premenstrual distress and improve the health of female employees. This program may be able to provide a reference for menstrual health promotion of female employees in the future workplace.
For more articles in Journal of Yoga and Physiotherapy please click on https://juniperpublishers.com/jyp/index.php
For more about Juniper Publishers please click on https://juniperpublishers.com/index.php
#karma yoga#physiotherapy#juniper publishers#open access journals#high impact factor journals#physical health#peer review journals#yoga meditation#meditation#yoga
4 notes
·
View notes
Text
Juniper Publishers- Open Access Journal of Otolaryngology

Juniper Publishers- Open Access Journal of Otolaryngology
Research Article
Long Term Test-Retest Reliability of Auditory Brainstem Response (ABR) and Middle Latency Response (MLR)
Sanjay Kumar Munjal1*, Naresh K Panda2 and Ashis Pathak3
1Speech and Hearing Unit, Post Graduate Institute of Medical Educational and Research, India
2Department of Otolaryngology, Post Graduate Institute of Medical Educational and Research, India
3Department of Neurosurgery, Post Graduate Institute of Medical Educational and Research, India
Submission: December 02, 2015; Published: January 20, 2016
*Corresponding author: Sanjay Kumar Munjal, Speech and Hearing, Department of Otolaryngology, Head and Neck Surgery, Post Graduate Institute of Medical Educational and Research, Chandigarh, 160012, INDIA.
Abstract
Objective: To study the variability of auditory brainstem response (ABR) and middle latency response (MLR) over a long term period.
Methods: 50 normal hearing subjects participated in the study. All the subjects were tested at 3 months, 6 months and 12 months of the initial testing. The absolute latencies and interpeak latencies of ABR waves and amplitudes & latencies of waves Na and Pa of MLR were measured.
Results: The Repeated measure ANOVA did not reveal any statistically significant difference (p>0.05) between interpeak latencies of wave I-III, III-V and I-V across the four visits. The amplitude of MLR wave Pa showed no significant difference across four visits. However significant difference (p< 0.05) across visits was observed for latency of wave Na.
Conclusions: The absolute latencies of wave III & V and the interpeak latencies of waves I-III, III-V and I-V have good test retest reliability. Reliability of wave I however has not been established. Amplitude of wave Pa has good test retest reliability.
Significance: The ABR and MLR can be used as monitoring tools in a number of cases like neurodegenerative disorders, progressive disorders of the central nervous system.
Keywords: Auditory Brainstem Response; Middle Latency Response; Test-retest Reliability
Introduction
The most widely used auditory evoked potential measurements are ABR and MLR that have a widespread application. ABR audiometry refers to an evoked potential generated by a brief click or tone pip transmitted from an acoustic transducer in the form of an insert earphone or headphone. The elicited waveform response is measured by surface electrodes typically placed at the vertex of the scalp and ear lobes. The amplitude (micro voltage) of the signal is averaged and charted against the time (millisecond), much like an EEG. The waveform peaks are labelled I-VII. These waveforms normally occur within a 10-millisecond time period after a click stimulus presented at high intensities (70-90 dB normal hearing level [nHL])
The most widely used measure is the latency of a component peak and the interpeak latencies (IPL). The latency of a component peak is simply the time after stimulus onset that a given peak occurs. As described by several researchers the clinical advantages of AEP lie in the fact that these are accurate and objective tests, independent from an individual’s subjective response, and it may be very useful in the evaluation of children with language disorders and also in monitoring therapeutic process because of the very plasticity of the nervous system. Moreover, it has been stressed that it bears high correlation to physiological changes in the auditory pathway and is efficient in distinguishing lesions from functional alterations in the Central Nervous System (CNS) (Sininger and Wesson, [1,2])
Several responses can be evoked from the auditory cortex. The most useful component of the auditory evoked response in the diagnosis of auditory cortical abnormalities is the middle-latency auditory evoked response (MLR). The MLR can be elicited by frequency-specific signals at relatively low intensities (Neves et al. [3]).This potential occurs between 10 and 80 milliseconds (ms) after the acoustic stimulus onset, and seems to have multiple generators, with a greater contribution of the thalamus cortical pathways, and less contribution from the inferior colliculus and the reticular formation.
The morphology of such potentials is clinically important, and one should confirm the presence of a long negative peak (Na), followed by a positive peak (Pa), between 15 and 30ms, besides wave reproducibility. Although the Pa wave is the dominant component, its morphology may vary substantially from individual to individual and also between the ears and electrodes in the same individual.
As in any other auditory evoked potential (AEP), response analysis criteria are in function of the latency (milliseconds - ms) and amplitude (microvolt - μv) values, and an intensity reduction causes an increase in latency values and reduction in amplitude values. Studies suggest that CNS alterations would affect more the amplitude than the latency values. Amplitude also seems to be the best indicator of functional alterations, since latency values bear large variations even among normal individuals. In general, the measured amplitude is generated between peaks Na and Pa, since it is the most robust. Using the Pa-Nb amplitude value may be one option if it is not possible to attain the Na-Pa amplitude value.
MLR is one of the most promising procedures for the identification of alterations in the central nervous system. Nonetheless, its little clinical use is due to the fact that there may be a great variability in latency and amplitude values among subjects, and this makes it difficult to establish values of normality, thus making it necessary to research this.
Test retest is a method of estimating test reliability in which a test developer or researcher gives the same test to the same group of research participants on two different occasions. The results from the two tests are then compared to produce a stability coefficient. Studying the coefficients for a particular test allows the assessor to see how stable the test is over time. Thus, studies aiming at studying the long term variability and the test retest reliability become extremely valuable to expand the clinical use of both ABR and MLR.
Go to
Need for the Study
Since ABR and MLR enjoy a widespread clinical application in a number of cases like neurodegenerative disorders, progressive disorders of the central nervous system, it is empirical to study the variability of these measures over a long term period. On extensive review of literature there was a paucity of data on the long term variability of these measures; hence this study.
Go to
Methodology
50 normal hearing subjects participated in the study. All the subjects were tested at 3 months, 6 months and 12 months of the initial testing. At the second follow-up i.e. after 6 months of initial testing 2 subjects dropped out of the study while 4 subjects dropped out on the third follow up.
Auditory Brainstem Evoked Response (ABR) measurement and MLR measurements were carried out on the evoked potential system developed by Intelligent Hearing System, USA.
The test was conducted in a sound treated room with minimal electrical and mechanical interference. Silver-silver chloride button electrodes were used. The non-inverting electrode was placed on Cz position (vertex), inverting electrode was placed on M1 and M2 position (mastoid), and the ground electrode was placed on Fz position (forehead) after applying conduction gel. The skin electrode surface impedance for all electrodes was first measured before starting the recording. The impedance was always adjusted and kept below 5K to facilitate proper recording.
The following parameters were selected for recording ABR. All the subjects were recorded at 70 dB nHL and 90 dB nHL intensity level in both ears separately. The bandwidth of filters was adjusted between 100 Hz to 3,000 Hz. Rate of stimulus used was 19.3/sec. Duration of stimulus was 100 µsec/click. Minimum of 1024 clicks were given at a time of each recording. The responses were repeated at each intensity level to ensure reproducibility. During ABR recording the absolute latencies of wave I, III and V and the interpeak latencies of Wave I-III, III-V and I-V were studied.
MLRs were measured along with ABRs using same instrumentation and electrode configuration. All the subjects were recorded at 70 dB nHL intensity level in both ears separately The bandwidth of filters was adjusted between 10 Hz to 300 Hz. Rate of stimulus used was 5.1/sec. and the duration of stimulus was100 µsec/click. Number of stimuli presented were 1000 .Peaks that were picked was Na, Pa and Nb. Latency measures were made from the centre point of the peak. The amplitude of Na and Pa waves were measured. Wave Na to Wave Pa was taken as the amplitude of Na and Wave Pa to Wave Nb was taken as the amplitude of Pa. The mean values and standard deviations were calculated for all the measures. Statistical analysis was done using repeated measure ANOVA. The informed consent was taken from all the subjects and the study was approved by the institutes’ ethical committee.
Go to
Results
To find out the test re-test reliability of ABR and MLR, the repeated measure analysis of variance (ANOVA) was applied across all the visits.
Table 1 shows the comparison of mean and SD values for the various ABR parameters of the four visits. Statistical significant difference (p< 0.05) in the mean values of four visits was found for the absolute latency of wave I in right ear revealing poor test retest reliability. However, in left ear, no significant difference was observed between the mean latency values of wave I across four visits depicting good test re-test reliability. Similarly, difference in the mean values of four visits for the other ABR parameters viz. absolute latency of wave III,V and interpeak latencies of wave I-III, III-V & I-V were statistically non-significant implying good test re-test reliability. Hence, it can be inferred that ABR has good long-term test retest reliability for majority of the parameters studied.
Table 2 depicts the comparison of mean and SD values for the various MLR parameters of the four visits. For latency of wave Na in right and left ear, statistically significant differences (p< 0.05) were observed between mean values of the four visits. Similarly, the difference was significant for the amplitude of wave Na in right ear. However, in left ear the difference in mean value of wave Na between the four visits was non-significant. For latency of wave Pa, the difference between the mean values of four visits was non-significant (p> 0.05) in right ear, but highly significant (p< 0.001) in left ear. No significant differences between visits were depicted for amplitude of wave Pa in both right and left ears.
Hence it is revealed that among the various parameters of MLR, amplitude of Pa has the best test retest reliability.
Go to
Discussion
The results show that the F value reached a significant level (p< 0.05) only for latency of wave I in the right ear. The F values for all the other measures tested did not reach a level of significance (p>0.05) indicating little or no variability in these measures over a long term follow up. Thus these findings suggests that the ABR latency of wave III and V have good test – retest reliability over a long duration of time. Our present findings however indicate variability in the absolute latency of wave I. This is in agreement with the study of Lauter and Karzon [4] who reported low level of consistency across subjects for peak I of ABR. Peripheral hearing status and other testing parameters like ambient noise, minimal wax in the external auditory meatus and transient middle ear pathology has been known to affect the latency of wave I in ABR (Sininger and Wesson [1,2]) This finding must be examined cautiously further and requires attention during measure of latency of ABR waves on a long term basis.
The interpeak latencies of wave I-III, III-V and I-V did not show any variability over a period of one year of the study. These values remained stable as indicated by non significant F-values (p > 0.05). Thus the authors emphasize the value of this measure in any long term follow up as in cases of demyelinating diseases, degenerative neurological disorders. Bergamaschi et al. [5] also reported good test-retest reliability of ABR components over one week period and recommended it as a good useful monitoring tool in longitudinal studies.
The MLR measure i.e. amplitude of wave Pa showed no variability over time and remained stable as denoted by non – significant p values (p>0.05). This measurement remains relatively stable over time and thereby has good test retest reliability. Thus this measure can be utilized to determine hearing thresholds at all frequencies in patients with abnormal ABR due to neurologic damage to the brainstem and in the pre and post operative management of patients with cochlear implants. These measures can be used in the localization of auditory pathway lesions, the diagnosis of syndromes that compromise MLR generating system. While ABR provides information unto the level of brainstem the MLR extends assessment of auditory system beyond the brainstem to the thalamocortical pathway. The latency values of Na wave in our study did show variability with time as the p values obtained were significant (p< 0.05).This is in correlation to the previous findings of Kavanagh et al. [6] who also established the fact that the MLR measures often fluctuate over time.
Go to
Conclusion
The absolute and interpeak latency measures of ABR waves III and V remain stable over a long period of time. However some variability in latency of wave I have been observed. The latency of wave Na and Pa in MLR also shows variability over an extended period although amplitude of wave Pa remains relatively stable.
For more information click on regarding Global Journal of Otolaryngology https://juniperpublishers.com/gjo/GJO.MS.ID.555559.php
For more open access journals click on Juniper Publishers
https://juniperpublishers.com/
#juniper publishers#juniperpublishers#juniper publishers publons#juniper publishers in usa#juniper publishers peer review
0 notes
Text
Material Health Literacy
Authored by: Duygu Kavuncuoglu*
Introduction
In the twenty-first century; there have been many developments in medicine such as finding new diagnostic and treatment methods; demographic and epidemiological transformation; changing disease burdens and increasing the burden of non-communicable diseases; increasing the importance of gaining healthy lifestyle behaviors to individuals and preventive health services rather than therapeutic health services. In addition; advances in communication technology have increased the resources for people to obtain health information and access to information has become easier. As a result of the developments both in the field of medicine and technology; the health care providers and the areas where the service is provided have increased as well as the share of health care providers-demanders in the process of making medical decisions-in the management of diseases and in the protection and improvement of their health. As a result of the changing roles of individuals regarding their health; it has led to the necessity of providing the communication between health service providers and service providers correctly and understanding all kinds of health information provided. In addition to the negativities experienced between health service providers and beneficiaries; the low level of socioeconomic level; the lack of information related to the lack of education level; and the difficulties in accessing health services cannot be adequately conveyed to the people [1, 2].
It is possible for individuals to reach their full health potential by taking control of the factors determining their health. For this; people should assume their own health responsibility and have the equipment and skills to make healthy choices based on the determinants of their health [3]. Patients constitute the main part of the health system and the decisions taken by individuals about their diseases significantly affect the effectiveness; effectiveness and quality of health care provided with health outcomes. The decisions taken by the patients are mostly based on their health-related skills; capacities and knowledge. This is called de health literacy de in the literature. Health literacy was first coined by Scott Simonds in 1974 in an article entitled “Health Education and Social Policy “. However; its widespread use in the literature began after the 2003 National Assessment of Adult Literacy (NAAL) study in the USA. As a result of the studies carried out by health researchers and clinicians; the definition of health literacy was first developed and then the concept was expanded by adding alternative terms such as “medical literacy saclike; “patient health literacy” and “clinical health literacy [2-4]. Health literacy is associated with the concept of general literacy; and it is possible for people to develop and make decisions about health care issues throughout their lives; to protect; maintain and improve their health; to access health-related information resources to improve the quality of life; to perceive health-related information and messages accurately and understanding and desires [5, 6].
Health literacy is defined within the framework of the concept of health promotion [7]. The concept of health promotion was defined as 1986 the ability to control and improve the health of individuals geliştirme during the Ottowa International Conference on Health Promotion in 1986. The concept of ok health literacy ortaya has been introduced to include the factors that affect health (determinants of health) and the learning and perception of social; political and economic conditions [8]. However; its widespread use in the literature began after the 2003 National Assessment of Adult Literacy in the United States [9]. Health literacy enables the individual to acquire the level of knowledge; individual skills and self-confidence that will lead to behavior that will improve both individual and community health by changing the lifestyle and living conditions [10]. It supports and improves the individual’s ability to access the right information and service; and the ability to use this service in order to maintain and maintain health [10,11]. It strengthens the use of existing health services more effectively; the creation of quality conditions in health services; and the competence of the individual over his or her health and community health [12,13]. Research shows that people with inadequate health literacy find it difficult to comprehend health information. Inadequate health literacy has been associated with more hospitalization; greater use of emergency services; less preventive health care; poor use of medication; poor understanding of healthrelated messages; and a worse level of health [14,15]. Maternal health literacy can be defined as cognitive and social skills that determine the motivation and ability of women to understand and use the information they can protect; maintain and improve their own health [16]. It is known that prenatal care is important for risk assessment for a healthy maternity and to avoid complications during pregnancy and childbirth. Adequate level of women’s SOY is extremely important for the protection and promotion of both their own and their children’s health. Women with low levels of health literacy will have difficulty in making the right decisions in situations that concern the health of both themselves and their family members; as they will be inadequate in accessing; understanding and interpreting health information [17].
Kohan et al. [18] Examined the impact of maternal health literacy on prenatal care and pregnancy outcomes; found that women with adequate health literacy had significant positive differences in terms of prenatal care frequency; neonatal birth weight; maternal hematocrit; iron and folic acid consumption; weight gain during pregnancy; gestational age at birth; mode of delivery and breastfeeding [18]. Similarly; in the study of Ohnishi et al. [19]; They found that mothers with adequate health literacy had less low birth weight and premature infants; infant mortality was less; and breastfeeding rates were higher than the other group [19]. In some studies; it is reported that pregnant women with low health literacy levels are not adequate and regular in their followup; they do not have their first follow-up in time; and they do not know screening tests such as double-triple screening and glucose load test [20-22]. Increasing knowledge of the mother about pregnancy changes; care in dangerous situations and pregnancy complications are important strategies for prenatal care and better adaptation to pregnancy. It is essential to educate and provide information on the subjects needed during pregnancy; but the most important factor is the perception; understanding and ability to use information in dangerous and inevitable situations. Therefore; it is necessary to carry out basic studies to increase maternal health literacy such as assessment in pregnancy care; identification of maternal literacy issues; identification of available resources; planning for better use of educational materials; written and oral education materials.
In most countries; information that is planned and organized in the prenatal period is given to pregnant women and their spouses through pregnancy preparation classes; and practical applications are provided to improve the ability to use and understand this information. Considering that maternal health literacy affects not only maternal health but also child health; growth and death; necessary health policies and practices should be developed to improve maternal health literacy in order to improve maternal and child health.
To Know More About Please Click on: Journal of Reproductive Medicine
https://juniperpublishers.com/gjorm/index.php
To Know More About Open Access Publishers Please Click on: Juniper Publishers
#Juniper publishers#Peer review journals#GJORM in juniper publishers#Reproductive medicine#Open access journals
1 note
·
View note
Text
Study the Physico-Chemical Properties of Sapota (Achras Sapota L.) - Juniper publishers
Journal of Trends in Technical and Scientific Research

Abstract
In the present work, the physical and chemical properties of fresh sapota fruits (Achras sapota L). And the Physical Properties studies such as moisture content (%), length (mm), width (mm), thickness (mm), volume (cc), Sphericity , weight of fruits (g), Bulk density (g/cc), True density (g/cc) and Porosity (g/cc). Chemical properties is TSS °(B), Acidity (%), pH, Reducing sugar (%), Total Sugar (%), Protein (%), Fat (%), Carbohydrate (%), Fiber (%), Color L, a and b.
Moisture content of sapota found to be in the range of 73.07 % wet basis (280.283 % db), the results showed that The length, width and thickness is sapota fruits was found to vary in the ranges from 44.08 to 60.19,37.00 to 49.34 and 41.06 to 52.91 mm, respectively, The volume of the sapota fruits range is 20 to 70 cm3, Sphericity of sapota fruits range is found to be 0.842 to 0.990, average weight of sapota fruits was 52.99±7.the weight of sapota fruits are recorded the range 41.15 to 74.99 (g), Sapota fruits are bulk density was in the range of found 0.341 to 0.414 g/cc, True density of sapota fruits was in the range of found 0.952 to 2.1095 g/cc, The porosity is calculated by the sapota fruits was found in the range of 16.62 to 42.22. chemical properties results shows the The fresh sapota fruits the TSS range is found 17 to 23, Titratable acidity of sapota fruits was in the of range 0.2 to 0.25, pH of sapota fruits range was observed in the range 5.5 to 6.0, Reducing sugar of fresh sapota fruits range was 15 to 17.3, Total sugars of fresh sapota are range between 46 to 52.2.
The fresh Sapota fruit protein is range is 0.6 to 0.80, The carbohydrate of sapota fresh fruits range is 14.3 to 28.31. The fat of Sapota fresh fruits range 0.4 to 1.25, Fibre of sapota was range of 0.42 to 28.31, Colour L values of fresh sapota fruits are range are 57.70 to 72.10, Colour a value of sapota fruits are range found 7.10 to 10.42 and b value of colour in sapota fruits are range comes in 37.26 to 41.91.
Keywords: Sapota fruit, Dimensions, Physical properties, Post-harvest processing.
Introduction
Sapodilla, (Manilkara Zapota L.) which belongs to the family sapotaceae, is underutilized tropical fruits commonly known as “sapota” in India and “chiku” in Malaysia. Immature fruits are hard, gummy and rich in tannin (astringent), while the ripe fruits are soft and juicy, with a sweet taste an attractive range colour, which makes them wonderful dessert fruit [1]. In India it is grown in an area of 82000 ha with 8 tones production at 14.19 tonnes per hectors productivity. Sapota is grown on a commercial basis in India, the Philippines, Srilanka, Malaysia, Mexico, Venezuela, Guatemala and other central American countries [2]. In Maharashtra, Gujarat, Tamilnadu and Karnataka states sapota is grown commercially [3]. Raw fruits of sapota are astringed, while ripe fruits are sweet. It is mainly used as dessert fruits bedside many processed products are prepared from sapota namely Halwa, Juice, Milk Shake, Shrikhand, fruit Jam. Mature fruits are used for making mixed fruits jams and provide a valuable source of raw materials for manufacture of industrial glucose, protein and natural fruits jellies. They also are canned as slices [4]. Sapota is a small fruit, generally with a diameter range from 5 to 9 cm with round to egg shaped appearance, and 75- 200 g weight. It consists of a rough brown skin, which enclosed a soft, sweet, light brown to reddish brown flesh. The flesh is often gritty, much like a pear, and which holds three to four flat, smooth black seeds, although some fruits are seedless. Figure 1 shows the sapota fruits and cut sapota fruits. Superior strains have a time smooth texture with a slight fragrant and sweet flavour [5].
Sapota fruits is reported to contain sugar, acids, protein, amino acid, phenolics viz, galic acid, catechin, chlorogenic acid, leucodelphinidin, and leucodelargonidin and Leucopelargonidin, carotenoids, ascorbic acids, and minerals like potassium, calcium and iron (Selvaraj and Pal) [6-9]. Fruits contains carbohydrate (50.49 g-100 g), protein (0.7 g – 100g), fat (1.1 g – 100g), fibre (2.6g -100g), and minerals nutrient viz. calcium (28mg -100g), iron (2.0mg -100g), phosphorus (27mg -100g), ascorbic acid (6.0mg -100g), Golpalan et al., Size and shape are most often used when describing grains, seeds, fruits and vegetables. Shapes and physical dimensions are important in sorting and sizing of fruits and determination how many fruits can be placed in shipping containers or plastic bags of a given size. Quality difference in fruits, vegetables, grains and seeds can often be detected by differences in density. When fruits and vegetables are transported hydraulically, the design fluid velocities are related to both density and shape [10]. Quality is defined as the absence of defects or degree of excellence and it includes appearance, color, shape, injuries, flavor, taste, aroma, nutritional value and being safe for the consumer [11]. Due to a higher market exigency as for high quality products, the juice and pulp industries have been looking for fruits with better internal and external features, including fruit length and width; fruit weight; pulp, seed and peel percentages per fruit; number of seeds per fruit; seed size and peel diameter; soluble solids (ºBrix); Titratable acidity (%); vitamin C content (mg/100g of fresh fruit); pulp pH and soluble solids/ Titratable acidity ratio. The physical properties affect conveying characteristics of solid materials by air of any sample. Size, shape and physical dimensions of sapota are important in sizing, sorting and other separation processes. Bulk and true densities of sapota are necessary to design the equipment for processing and storing. The porosity of fruits is the most important for packing, pH is used to determine the acidity and alkalinity of the fruits, and TSS is used to determine the amount of sugar concentration. Many studies have been reported on physical properties of fruits such as Apple, Apricot, Banana, Olive, Pomegranate and grape by the researches [12-17]. The literature on physico-chemical properties of sapota is scarce. The present work was undertaken to study the physico-chemical properties of sapota fruits.
Materials and Methods
Moisture content
The moisture content of sapota kalipatti variety fruits was used for the experiments. The moisture content was determined by using a standard hot air oven method [18]. The sapota was cut into slices around 10 to 15 g and slices were kept in pre weighed moisture boxes by using electronic balance of 300 g capacity having the least count of 0.001 g. These samples were kept in hot air oven for 105ºC ± 1ºC for 24 hours. The moisture content (wb%) was determined as equation (1)
2 3 2 1 ( %) 100 w w MoistureContent db w w − = × − ---(1)
Where,
W1 = mass of empty box with lid, g
W2 = mass of box, lid with sample, g
W3= mass of box, lid with sample after 24 hours, g
Dimensions (L, B, T)
The three principal dimensions namely length, width (Diameter) and thickness was measured for each individual sapota along X, Y, and Z axis with the help of Vernier caliper (least count of 0.01mm). The spatial dimensions were measured for 50 fruits and average value has been reported. Geometric mean diameter was calculated by following equation (2)
1 ( ) 3 [( )] g DL B T = × × ---(2)
Where,
Dg = Geometric Mean Diameter in mm
L = Length, mm
B = Breadth, mm
T = Thickness, mm
Sphericity
It is defined as ratio of surface area of sphere having same volume as that of the sapota to the surface area of the sapota [19]. This criterion was used to describe the shape of the sapota. Sphericity of sapota fruit was determined by using equation (3).
13 ()L B T Sphericity L × × = ---(3)
Fruit weight
Samples of sapota were taken and their weights were measured on an electronic weighing machine with the 0.001 kg least count. The maximum, minimum, and average values of these parameters were recorded and standard deviation of the mean values was tabulated.
Fruit volume
A 1000 ml measuring cylinder was used for measurement of fruit volume. Measuring cylinder was filled with water up to 500 ml. the fruit is dropped in the measuring cylinder. The initial volume before placed was recorded for fruit. The volume change after dropping the fruit in to the cylinder was recorded. The measurement was repeated 10 times the change in volume was reported as the volume of fruit. The average of 10 measurement were reported as a fruits volume using equation,
v FB A = − ---(4)
Where,
Fv = fruit volume,
A = Initial level of water in the measuring cylinder, ml
B= final level of water in the measuring cylinder, ml
Bulk density
The bulk density was determined by using the mass/volume relationship. Sapota were filled in gunny bag having volume (100cm×60cm×30cm). Total mass of the sapota were measured with the electronic balance with accuracy of 0.01 g. Fruit density (kg/m3) was calculated by using the following equation (5). The experiments were repeated with five times and average value was reported. The bulk density of sapota fruit was determined by using following formula as suggested by Mohasnin.
b M P V = ---(5)
Where,
Pb= bulk density (kg/m3),
M = bulk mass of fruit (kg), and
V = volume of Gunny bag (100cm×60cm ×30cm).
True density
The true density of sapota fruit was determined by using toluene displacement method. Weight of single sapota fruit was taken with electronic precision balance with least count 0.001 g and fruit was immersed carefully into measuring cylinder partially filled with toluene. The volume of toluene displaced by the fruit was noted down. The true density was calculated by using following equation (6).
t td W P V = ---(6)
Where,
Pt = True density g/cc,
Vtd= volume of cylinder content (cc).
W= Wight of sapota fruits
Porosity
The porosity of sapota was computed from the value of bulk density and true density using relationship.
100 Truedensity Bulk density Porosity Truedensity − = × ---(7)
Total Soluble Solids⁰ (BRIX)
Total soluble solids sapota pulps were determined using Refractometer (M/s. Atago, Japan) at atmospheric temperature. The equipment was calibrated with distilled water and the TSS of the Sapota juice was determined. The experiment was replicated three times. The total soluble solid content of fruit samples was determined by a digital Refractometer (Kyoto Company, Kyoto, Japan).
Titratable Acidity
The Titratable acidity of sapota fruit pulp was determined as per the procedure Ranganna. A known quantity of sample was blended in mortar and pestle with 20-25 ml distilled water. It was then transferred to 100 ml volumetric flask, made up the volume and filtered. A known volume of aliquot (10ml) was titrated against 0.1N sodium hydroxide (NAOH) solution using phenolphthalein as an indicator (Ranganna). The acidity was calculated as given below and the results were expressed as percent anhydrous citric acid. The three replications were carried out and the average readings were reported.
(%) 10 1000 N T E Titratableacidity W V× × = × × × ---(8)
Where,
N = normality of alkali
T = titrate reading
E = equivalent mass of acid, g
W = weight of the sample, g
V = total volume of the sample, g
pH
pH of sapota was measured using digital pH meter. The digital pH meter is firstly calibrated by using 4 pH and 7 pH buffer solution. The electrode was washed with distilled water and blot led with tissue paper. 10 ml of sapota juice was taken in beaker, and then the tip of electrode and temperature probe was then submerged in to the sample. The pH reading display on the primary LCD and temperature on secondary one. The pH of fresh sapota was determined for three replications. The chemical properties such as pH of meddler fruit were determined according to the methods presented by the Association of Official Analytical Chemists.
Reducing Sugar
The reducing sugar of sapota pulp was estimated by using Lane and Eynon Method with modifications reported by Ranganna. A known weight of Sapota slices were crushed with distilled water using lead acetate (45%) for precipitation of extraneous material and potassium oxalate (22%) to de-lead the solution. This lead free extract was used to estimate reducing sugars titrating against standard Fehling mixture (Fehling ‘A’ and ‘B’ in equal proportion) using methylene blue as an indicator to brick red end point. The three replication were carried out and the average reading was reported.
100 % ' volume prepared Reducing sugar GV of fehling s solution burette reading initial volume = × --- (9)
Where,
GV= Glucose value
Total Sugar
Total sugars of sapota pulp estimated by same procedure of reducing sugar after acid hydrolysis of an aliquot of deleaded sample with 50 percent of hydrochloric acid followed by neutralization with sodium hydroxide (40%) and calculated as below. The experiment was repeated three times to get the replication.
(%) 100 Factor Dilution Total sugar Titre reading Weight of sample × = × × ---(10)
Colour
The fresh sapota fruit pulp was used to measure the colour value by using colorimeter (Konica minotta, Japan model-Meter CR-400). The equipment was calibrated against standard white tile. Around 20 g pulp of sapota was taken in the glass cup; the cup was placed on the aperture of the instrument. The colour was recorded in terms of L= lightness (100) to darkness (0); a = Redness (+60) to Greeness (-60); b= yellowness (+60) to blueness (-60).
Protein
The protein content of fresh sapota fruits was determined by Lowry’s Method (Lowry et al.,) using spectrophotometer (Make: Systronics- UV Visible spectrophotometer; Ahmadabad; Model No: 106). In this method, 1 g sapota pulp was mixed with 5 ml of alkaline solution which was prepared from 50 ml of Part one (2% sodium carbonate in 0.1 N NaOH) solution and 1 ml of part two (0.5% copper sulphate in 1% sodium potassium tartarate) solution. Mixed solution i.e. part one and part two was rapidly diluted with folin-ciocalteu reagent. After 30 min, sample was loaded in the cuvet of spectrophotometer upto >3/4 of its level. The absorbance was read against standard protein solution at 750nm. Absorbance is recorded as protein content.
Fat
Fat of sapota fresh fruit pulp was determined using soxhlet fat extraction system (AOAC) by using Soxhlet apparatus (Make: Elico, Hyderabad). In this method, initially weight of empty flask was weighed. 2 g sapota pulp wrapped in filter paper was siphoned for 9-12 times with the petroleum ether in soxhlet apparatus. After removing assembly, evaporation of petroleum ether was allowed by heating. Residue remained at the bottom of the flask and was reweighed with flask. The quantity of residue was determined as fat content of sapota pulp.
Carbohydrate
The carbohydrate from sapota pulp was estimated by anthrone method in which prepared a series of Glucose solution and distilled water in the ratio (0:1; 0.2:0.8; 0.4:0.6; 0.6:0.4; 0.8:0.2; and 1:0) by using spectrophotometer. One gram ground sapota pulp was mixed with 5 ml of 2.5 N HCL and then heated for 3 h in water bath. The mixture was allowed to cool for 1.3 h, and it is added with sodium carbonate till effervescence stops. It is seen by naked eyes. After filtration, anthrone reagent (2 g anthrone powder 100 ml H2SO4) was added in filtered solution. The mixture was heated for 8 min and allowed to cool. The solution was taken in the cuvette of spectrophotometer, and absorbance was recorded at 630 nm. A graph was plotted, i.e., absorbance versus concentration (glucose stock: distilled water), and concentration of unknown sample was measured by using formula,
% Absorbanceof unknown Concentrationof standard Concentration Absorbanceof standard − = ---(11)
Results and Discussion
Table 1 shows the physical properties of sapota fruits & Table 2 shows the chemical properties of sapota fruits
Moisture content
Moisture content of sapota found to be in the range of 73.07 % wet basis (280.283 % db). The result was in general agreement with the result obtained for fresh sapota fruits by pawar et al., which having range is 69.80% to 75.80 % (wb) for kalipatti and Athmaselvi et al., reported the moisture content of sapota verity kalipatti 77.93% (wb).
Dimension
The length, width and thickness is sapota fruits was found to vary in the ranges from 44.08 to 60.19, 37.00 to 49.34 and 41.06 to 52.91 mm, respectively. The Average values of dimension in terms of length, width and thickness were found to be 50.29±4.15, 42.78±3.12 and 46.53±3.130 mm, respectively. The shape of sapota fruit may be classified as Eleptical as per classification given by Mohsenin [19]. The result were in general agreement with the result obtained for fresh sapota fruits by Gupta et al., 50.10 to 62.19, 31.90 to 42.16 and 27.40 to 41.42. And Athmaselvi et al., 41.51, 42.16 and 40.3.
Fruit volume
The volume of the sapota fruits range is 20 to 70 cm3 and average volume are found of sapota is 43.2±15.19cm3.). The result was in general agreement with the result obtained for fresh sapota fruits by Gupta et al., is 408.3 to 587.7 (cc).
Sphericity
The Sphericity of sapota fruits range is found to be 0.842 to 0.990 and average value is 0.908±0.052 .and the shape of sapota fruit may be classified as elliptical as per classification given by Mohsenin [19]. The results were in general agreement with the result obtained for fresh sapota fruits by Athmaselvi et al., is 0.957.
Fruits weight
The average weight of sapota fruits was 52.99±7.the weight of sapota fruits are recorded the range 41.15 to 74.99 (g). The result reported in literature for fresh sapota fruits by Gupta et al., range of 38.20 to 55.50 (g) verities in sapota kalipatti and Athmaselvi et al., was 48.42 kalipatti [20] reported average fruits weight of sapota was 55.6 verities cricket boll (g). And pawar et al., reported the sapota fruits weight range of 60.66 to 85.42 (g) for kalipatti.
Bulk density
Sapota fruits are bulk density was in the range of found0.341 to 0.414g/cc and the average value of the bulk density of sapota was 0.384±0.0321g/cc [21]. The result were in general agreement with the result obtained for fresh sapota fruits by Gupta et al., and Athmaselvi et al., range is 0.891 to 0.912 g/cc, 0.61 g/cm3.
True density
True density of sapota fruits was in the range of found 0.952 to 2.1095 g/cc. and average true density is sapota 1.323±0.40 g/cc [22]. The result were in general agreement with the result obtained for fresh sapota fruits by Gupta et al., for kalipatti and Athmaselvi et al., range is 1.013 to 1.055 g/cc and 1.12 g/cm3.
Porosity
The porosity is calculated by the sapota fruits was found in the range of 16.62 to 42.22 and average value of porosity is31.492±8.45 [23]. The result were in general agreement with the result obtained for fresh sapota fruits by Gupta et al., and Athmaselvi et al., range is 12.82 to 13.62. And 0.35 g/cm3.
TSS
The fresh sapota fruits the TSS range is found 17 to 23 and average value of sapota fruits is 19.45±1.40. The result were in general agreement with the result obtained for fresh sapota fruits by Pawar et al., which having range is 19.00°B to 23.60°B reported TSS of sapota average 24°B. Gupta et al., reported TSS of sapota average range 17°B to 22°B [20].
Titratable Acidity
The Titratable acidity of sapota fruits was in the of range 0.2 to 0.25, the average Titratable acidity is 0.16±0.14. The result were in general agreement with the result obtained for fresh sapota fruits by Pawar et al., which having range is 0.10 % to 0.23%.
pH
The pH of sapota fruits range was observed in the range 5.5 to 6.0 and average pH is 5.72 ± 0.14. The result were in general agreement with the result obtained for fresh sapota fruits by Pawar et al., which having range is 5.30 to 6.30. Gupta et al., range 5.2 to 5.7 [24].
Reducing sugar
Reducing sugar of fresh sapota fruits range was 15 to 17.3, average reducing sugar are 16.3±1.23. The reducing sugar reported for fresh sapota fruits by Pawar et al., was in the range of 8.90 % to 11.08 %. And Take et al., average 8.91 %. Sawant reported the reducing sugar content of sapota at ripe stage was 8.28-13.86%.
Total sugar
Total sugars of fresh sapota are range between 46 to 52.2 and average total sugar of fresh sapota fruits 48.50±1.58. The result were in general agreement with the result obtained for fresh sapota fruits by Pawar et al., which having range is 14.40% to 18.20% verities kalipatti [20] reported average total sugar 17.57% evaluated ten cultivar of sapota and noticed variation from 7.0 to 12.3 per cent in total sugar [7]. Rao et al., observed that in sapota fruit contained 12.0 per cent total sugar.
Protein
The fresh Sapota fruit protein is range is 0.6 to 0.80 and average value of protein is 0.48±0.13. The Protein content reported in literature for sapota fruits was 0.70 and 0.67. Ganjyal et al., 0.70 And Swaminathan is 0.70 average 0.6 [20].
Fat
The fat of Sapota fresh fruits range 0.4 to 1.25 and average fat value is 0.49±0.44. The fat content of sapota fruits reported in literature was 1.10, 1.13 and 1.25 (Ganjyal et al., Swaminathan) [20].
Carbohydrate
The carbohydrate of sapota fresh fruits range is 14.3 to 28.31 and average carbohydrate is 19.50±3.47. The result were in general agreement with the result obtained for fresh sapota fruits by Ganjyal et al., 21.40. average 28.31 [20].
Fibre
Fibre of sapota was range of 0.42 to 28.31 and average fibre is 2.50±0.92. The result were in general agreement with the result obtained for fresh sapota fruits by Kumari et al., 2.60.
Colour
Colour L values of fresh sapota fruits are range are 57.70 to 72.10 and average L value is 71.10±2.43. Sapota a value of sapota fruits are range found 7.10 to 10.42 and average a value of sapota is 7.14±0.02. And b value of colour in sapota fruits are range comes in 37.26 to 41.91 and average value is b is 40.50±0.03 [25].
Conclusion
Moisture content of sapota found to be in the range of 73.07 % wet basis (280.283 % db). And the length, width and thickness is sapota fruits was found to vary in the ranges from 44.08 to 60.19, 37.00 to 49.34 and 41.06 to 52.91 mm, respectively, The volume of the sapota fruits range is 20 to 70 cm3and average volume are found of sapota is 43.2±15.19cm3.The Sphericity of sapota fruits range is found to be 0.842 to 0.990 and average value is 0.908±0.052. The average weight of sapota fruits was 52.99±7. the weight of sapota fruits are recorded the range 41.15 to 74.99 (g). Sapota fruits are bulk density was in the range of found 0.341 to 0.414 g/cc and the average value of the bulk density of sapota was 0.384±0.0321 g/cc. True density of sapota fruits was in the range of found 0.952 to 2.1095 g/cc. and average true density is sapota1.323±0.40 g/cc. The porosity is calculated by the sapota fruits was found in the range of 16.62 to 42.22 and average value of porosity is 31.492±8.45. And some chemical properties of sapota fruits are the fresh sapota fruits the TSS range is found 17 to 23. The Titratable acidity of sapota fruits was in the of range 0.2 to 0.25, The pH of sapota fruits range was observed in the range 5.5 to 6.0, Reducing sugar of fresh sapota fruits range was 15 to 17.3, Total sugars of fresh sapota are range between 46 to 52.2, The fresh Sapota fruit protein is range is 0.6 to 0.80. and the fat of Sapota fresh fruits range 0.4 to 1.25, The carbohydrate of sapota fresh fruits range is 14.3 to 28.31 and Fibre of sapota was range of 0.42 to 28.31, Colour L values of fresh sapota fruits are range are 57.70 to 72.10 and a value of sapota fruits are range found 7.10 to 10.42.
To Know More About Trends in Technical and Scientific Research click on: https://juniperpublishers.com/ttsr/index.php
To Know More About Open Access Journals Please click on: https://juniperpublishers.com/index.php
2 notes
·
View notes
Text
Juniper Publishers - Open Access Journal of Ecology
First Record Fungi for Iraq

Authored by : Hussein Al-Nasrawi
Abstract 44 fungal species were isolated from plant parts submerged in Al-Huwaiza marsh within Iraqi borders, and 7 new first records fungi in Iraq were isolated too, which have been illustrated and described as follows: - Carbosphaerella leptosphaeriodes, Curvularia lunata var.aria, Graphium sp., Helicascus kanaloanus, Leptosphaeria obions, Stagnospora sp. and Ulocladium tuberculatum, Carbosphaerella leptosphaeriodes, Curvularia lunata var.aeria, Graphium sp., Helicascus kanaloanus, Leptosphaeria obions, Stagnospora sp., Ulocladium tuberculatum.
Keywords: Fungi; Submerged plants; Marsh; New record; Iraq
Introduction Al-Huwaizah marsh is an aquatic ecosystem extend between Iraq and Iran with freshwater body.Al-Huwaizah marsh locates between latitudes 31˚45ˉ and 31˚00ˉ in the north and longitude 47˚50ˉ and 47˚ 25ˉ in the east , passing through Iranian borders , 80km X 30km [1]. Reed plants (Phragmites Australis Trin) and Typha (Typha Australis Schum & Thonn) are the main components of the vegetative cover in the marsh ecosystem [2]. Many endemic fungal species play an important role in the biodegradation and bioremediation of marsh environment. Fungi play an important role in biodegradation process of plant debris submerged in marsh and bioremediation occurs during mycoremediation during decomposers (fungi) in the aquatic environment along with some types of bacteria [3-5]. Hussein Al-Nasrawi (2006) was confirmed isolation of fungal diversity (fifteen species) as a new record for the first time in Iraq, isolated from the plant remains submerged in aquatic ecosystems in Iraq , in addition to many studies conducted in Iraq for the same mycological puroses [6,7]. Many species of Basidiomycetes were isolated from stems and leaves of the reed plant submerged in salt marshes in Belgium [8].
Materials and Methods Collection of samples 50 pieces of decomposed plants were collected from water body and sediments in Al Huwaizah marsh in Iraq during 2016. Samples were washed gently by tap water and then by distilled water. Plant debris were cut into small parts 7-5cm long and each 10 pieces were settled in the bottom of petri dish.
Preparation of culture media Potato Carrot Agar (PCA), which was obtained by weighing 20g of potato and carrots after washing and peeling, then sliced and boiled with a quantity of distilled water, was sprayed well in a ceramic vase , filtered and placed in a 1 liter flask then added to the prepared mixture of each of the potatoes and carrots media .the media objected to sterilizing process in autoclave under standard conditions for 20 minutes (250mg of chloramphenicol as antibiotic to inhibit bacterial growth.
Insolation and identification of fungi In this study, two methods were used to isolate the fungi: direct isolation from the substrate. The humid chamber method was used to remove the previously prepared vegetable pieces from the beaker using sterile forceps and placed 7 to 5 pieces in a glass bowl of 15cm diameter Petri dishes Sterilize the filter leaves, then moisten the filter leaves with sterilized distilled water and incubate the dishes under 25°C. The second method is the method of dilution. Dilution method to isolate the fungus from the washing of submerged plant parts and summarized the method by withdrawing 10ml of sterile distilled water, which was washed by the samples previously using a sterile pipette placed in a flask containing 90ml of distilled water and a well and withdraw from it 1ml transferred to A sterile glass dish with a diameter of 9cm. The food medium, plate roast and incubation were incubated under 25°C. Three replicates were made of each sample. The isolated fungi were classified under light microscope by using international taxonomic keys published in the following literatures: [9-20]
Ascocarp 90-120um in diameter, globose to subglobose shape. The Asci 40-45 × 60-80μm with 8 Ascospores. The Ascospore 15- 18 × 25-30μm, devided by triseptate, the two mid cells within the ascospore dark to brown color, whereas the terminal cells pale and surrounded by mucous sheath. The present isolate nearly like the isolate of Schmidt [21]. This species considers as a new record for Iraq. The isolate was illustrated and kept in under no. BASRA 2011 (Figure 1).
Curvularia lunata var.aeria (Batista, Lima & Vasconselos) M.B.Ellis.1960, publcos inst Micol Recife 263: 5-10
The colony with black to gray color, the hyphae immersed under substrate surface. Conidiophore thicker than fungal filament (macronematous), subhyaline. Conidiogenous cell is polytretic. The conidia with curve shape divided with three septae to form four cells, the two mid cells thicker and darker from the two terminal pale cells. Conidia 10-15 × 20-30μm. This species was previously isolated from painted wood and soil whereas our present fungus isolated from reed sample submerged in marsh sediments. Dry culture was kept in Basra herbarium under no. BASRA 2012 (Figure 2).
The colony is gray to Olivaceous brown, Conidiophore thicker than fungal filament (macronematous) appears under dissecting microscope as Synnemata. Fungal hyphae immersed under the epidermis. Conidiogenous cell is monobasic type. Conidia 5-7 × 15-20μm. Oval to cylindrical shape, with rounded end, pale color without, unseptated. Our isolated fungus resembles species Graphium putredinis isolated by Huges [19]. Our present isolate differentiated by its shape and size (cylindrical 2-4 × 5-11μm. The species isolated from reed segment submerged in marsh sediment. Dry culture was kept in Basra herbarium under no. BASRA 2013 (Figure 3).
The Ascocarp globose, immersed, 400-250μm high, 400- 800 with ostule. Black to dark brown color. Asci 200-300μm., bitunicate, with 8 ascospores. The ascospore 15-25 × 35-50μm. Arranged inside ascus as uninervate. The ascospore divided by septum into 2 dark cells, with funnel shape. cell wall of ascospore surrounded by two layers. There are two germination pores in the ends of ascospore. The ascospore differentiated by gelatinous layer clearly appears when immerse in water drop (disappear with lactophenol stain). The present fungus isolated from Typha segment submerged in marsh sediments, illustrated and kept in Basra herbarium under no. BASRA 2014 (Figure 4).
Leptosphaeria obions (Crouan et Crouan) Saccardo Syll Fung 2,24,1883.
Ascocarp sub globose, immersed, with high about 100-300 and diameter 200-400μm., black to dark brown color, usually covered by brown filaments. The ascocarp coated by two layers, large dark external layer and pale small internal layer. The asci thick, bitunicate,14-20 × 150-300μm. Each ascus contains 8 ascospores, 8-15 × 25-40μm. Arranged inside the ascus as uniseriate in the top of the ascus whereas as biseriate in middle site. The ascospore divided by three septae to form 4 cells, the two middle cells dark brown and larger than the terminal smallest cells. This species was previously isolated from herbal plants and from mangrove area in Australia. The present fungus isolated from Typha segment submerged in marsh sediment, illustrated and kept in Basra herbarium under no. BASRA 2015 (Figure 5).
Stagnospora sp
The Pycnidium sub globose, partially immersed, with pale brown ostiole and short papillate. High of pycnidium 150-180μm, 100-200μm diameter with a neck about 10μm diameter. The conidia pale to brown color, cylindrical in shape, 4-8 × 40-70μm., divided by 5-7 septae. The present isolate resembles Stagonospora haliclysta which was previously isolated by Kohlm [22] (conidia size 3.5-4.5 × 20-27μm, smaller than our isolate). The present fungus isolated from reed segment submerged in marsh sediment and consider as first record in Iraq. It was illustrated and kept in Basra herbarium under no. BASRA 2016 (Figure 6).
Ulocladium tuberculatum Simmons, 1967, Mycologia 59: 83 -84.
The fungal hyphae immersed, sub hyaline, with thick conidiophore 4-6μm. 160-200μm. length, pale brown color, divided by septae. Conidia 10-16 × 10-20μm. sub globose, like potato fruit, divided into several parts by septae cross shape.
The species was firstly isolated in united states. The present isolate resembles Tetracoccosporium paxianum, which isolated by Szabo,1905. Our species was isolated from reed segment submerged in marsh sediment, kept in Basra herbarium under no. BASRA 2017 (Figure 7).
Discussion
Fungi Inhabit plant segments submerged in aquatic ecosystems used their enzymic complex system to biodegrade cellulose and produce carbon source, the most important matter for fungal metabolism process [23,24].
Guaro et al. [25] & Guaro et al. [26] the pioneers who worked on wetland area in Iraq, they isolated and identified many new fungal species and new record fungi forom plant segments submerged in marsh ecosystem in southern area of Iraq. The present study choosed one fresh and natural premium deep marsh ecosystem called al-Audem in Mysan province to suray fungal diversity and new records .This ecosystem consider a natural , undiscovered mycoflora enriched with organic materials and with high quality sediments settle in the bottom of water body , that encourage growth of different fungal species. The present study contributed in recording seven new record fungi for Iraq from this marsh environment [27-34].
Conclusion
Several marshed in southern area of Iraq still waiting more studies and novel works to discover more new species and new record fungi. The high-quality water parameters of marsh ecosystem with enrichment of plant diversity, leads to establishment a perfect foundation of sediment layers embedded in the bottom of marsh environment. This study opens the track for researchers to investigate the ecological niche of fungi in marsh community to detect more aquatic and sediment mycoflora of wetlands.
#Ecology open access journals#Juniper publisher journals#Juniper Publishers#Juniper publishers reviews#Open access journals#Peer review journals
2 notes
·
View notes
Text
An Assessment of Local Community Livelihood Benefits as a result of Bale Mountains National Park, Southeast Ethiopia
Yohannes Teshome

Authored by Yohannes Teshome
Assessing and considering the potential contribution of protected areas of land on local community livelihood benefits helps to effectively protect and sustain representative samples of various biotopes. This study was designed to assess the contribution of Bale Mountains National Park (BMNP) on local community livelihood. Thirteen villages were selected purposely from five Districts and 732 households were interviewed. The survey was conducted using structured household questionnaires, focus groups discussion and key informants. Various data analysis techniques namely descriptive statistics, Chi-square (χ²) test of independence, post hoc Tukey test after a one-way ANOVA test and Correlation (r) were used. Results showed that 76% of households earned direct benefit from the park in terms of livestock grazing 39.6% (dry season) and 37.9% (wet season), land holding 39.66%, firewood collection 93.53% and grass harvesting 64.14%. Ecotourism related activity 27.8%, being an association member 2.1%, employment (full time 0.86% and part time 0.6%), donation 2% and training/workshop 15.5% were recorded as indirect benefit as a result of the park. Generally, it is concluded that BMNP has enormous potential to contribute on local community livelihood directly and/or indirectly, but indirect benefits remain low and a distant reality. Therefore, the management approach of the park should be changed and able to focus on offering indirect benefit opportunity equitably and reasonably for all residents living in and around the park.
For more Open Access Journal in Juniper Publishers please click on: https://juniperpublishers.com/
For more articles in Journal of Environmental Sciences & Natural Resources please click on: https://juniperpublishers.com/ijesnr/
To read more…Fulltext
#Juniper Publishers#peer reviewed journals#Open Access Journal#Livelihood#Local Community#Dry Season#Environmental Sciences#Natural Resources
1 note
·
View note
Text
Anti-hyperglycemic Effect and Regulation of Carbohydrate Metabolism by Phenolic Antioxidants of Medicinal Plants against Diabetes

Authored by HP Gajera
Introduction
Background
Diabetes mellitus is a carbohydrate metabolism disorder of endocrine system due to an absolute or relative deficiency of insulin secretion, action, or both [1]. The disorder affects more than 100 million people worldwide and it is predicted to reach 366 million by 2030. The non-insulin dependent diabetes mellitus (NIDDM, type 2) is the most prevalent form globally which is associated with elevated postprandial hyperglycemia. The occurrence of NIDDM 2 has been shown an alarming increase during the last decade (http//www.who.Int/diabetes/en/).
Plant derivatives with reported hypoglycaemic properties have been used in folk medicine and traditional healing systems. Very few of these traditional antidiabetic plants have received proper scientific or medical scrutiny despite recommendations by WHO. Ayurveda and other Indian traditional approaches have described more than 800 plants in the Indian subcontinent, known to possess antidiabetic potentials. These require to be effectively studied and in fact only few of them have been characterized for their mechanistic action [2,3]. Pancreatic α-amylase, is a key enzyme in the digestive system and catalyses the initial step in hydrolysis of starch to maltose and finally to glucose. Degradation of this dietary starch proceeds rapidly and leads to elevated post prandial hyperglycemia. It has been shown that activity of HPA in the small intestine correlates to an increase in post-prandial glucose levels, the control of an important aspect in treatment of diabetes [4]. Hence, retardation of starch digestion by inhibition of enzymes such as α- amylase would play a key role in the control of diabetes.
The discovery of specific high-affinity inhibitors of pancreatic α-amylase for the development of therapeutics has remained elusive. Inhibitors currently in clinical, use for example, acarbose, miglitol, and voglibose, are known to inhibit a wide range of glycosidases such as α-glucosidase and α-amylase. Because of their non specificity in targeting different glycosidases, these hypoglycemic agents have their limitations and are known to produce serious side effects. Therefore, the search for more safer, specific, and effective hypoglycemic agents has continued to be an important area of investigation with natural extracts from readily available traditional medicinal plants offering great potential for discovery of new antidiabetic drugs [5]. Ponnusamy et al. [6] studied on antidiabetic medicinal plants for human pancreatic amylase inhibitory effect in vitro and found that pancreatic α-amylase lower the levels of post perandial hyperglycemia via control of starch breakdown. The probable mechanism of action of the above fractions is due to their inhibitory action on HPA, thereby reducing the rate of starch hydrolysis leading to lowered glucose levels. Phytochemical analysis revealed the presence of alkaloids, proteins, tannins, cardiac glycosides, flavonoids, saponins and steroids as probable inhibitory compounds.
Anti-hyperglycemic effect of natural phenolic antioxidants
Advanced molecular studies showed that methanol extract of black jamun plant modulate the expression of glucose transporter (Glut-4), peroxisome proliferator activator receptor gamma (PPARγ) and phosphatidylinositol-3-kinase (PI3 kinase) comparable with insulin and rosiglitazone [7]. Evaluation of black jamun containing antidiabetic poly herbal formulation in alloxan induced diabetic rats also showed significant hypoglycemic activity, positive glucose tolerance activity and reduced lipid peroxidation in various organs compared to that of the diabetic control animals [8]. Meshram et al. [9] studied on hypoglycaemic action of black jamun seeds. The possible mechanism by which extracts bring about its may be by affecting the activity of glucoamylase or by increasing the glycogen biosynthesis. Thus, the significant inhibition of glucoamylase suggests that the active hypoglycaemic compound present in methanolic extracts of jamun seeds does not necessarily require the presence of functioning of β-cells for its favourable action seen in type-I. It means the methanol extracts of black jamun seeds may act in a variety of diabetic conditions with or without functioning of pancreatic β-cells.
Hasan et al. [10] studied DPPH radical scavenging activity of black jamun seed extracted in methanol. It has been determined that the antioxidant effect of plant products is mainly due to radical scavenging activity of phenolic compounds such as flavonoids, polyphenols, tannins, and phenolic terpenes [11]. Liang & Yi [12] identified hydrolysable tannins (ellagitannins) extracted from black jamun fruit showed a very good DPPH radical scavenging activity and ferric reducing/antioxidant power. The results are promising and indicating the utilization of the fruit of black jamun as a significant source of natural antioxidants.
Stanely et al. [13] evaluated the protective effects of gallic acid on brain lipid peroxidation products, antioxidant system, and lipids in streptozotocin induced type II diabetes mellitus. The results showed the beneficial effects of gallic acid on brain metabolism in streptozotocin induced type II diabetic rats. A diet containing gallic acid may be beneficial to type II diabetic patients. Meguro et al. [14] investigated the effects of continuous ingestion of a catechin rich beverage in patients with type 2 diabetes. The significant increase in insulin level was observed to patients fed with green tea containing the catechin. Rizvi et al. [15] evaluated the effect of tea catechins (epigallocatechin gallate (EGCG), epigallocatechin (EGC), epicatechin gallate (ECG) and epicatechin (EC)) on markers of oxidative stress in erythrocytes from type 2 diabetics. The relative effectiveness of individual catechins are in the order of EGCG>ECG>EGC>EC. Higher intake of catechin rich food by diabetic patients may provide some protection against the development of long term complications of diabetes. Chlorogenic acid is a major component of coffee that may provide more of an explanation for coffee’s effect on risk for type 2 diabetes. Chlorogenic acid proposed beneficial effects on glucose metabolism. The chlorogenic acid may delay glucose absorption in the intestine through inhibition of glucose-6-phosphate translocase 1 and reduction of the sodium gradient driven apical glucose transport. In vitro studies and animal studies showed that chlorogenic acid derivates can be decreased hepatic glucose output through inhibition of glucose- 6-phospatase [16].
Jung et al. [17] investigated the blood glucose lowering effect and antioxidant capacity of caffeic acid in mice. Caffeic acid induced a significant reduction of the blood glucose and glycosylated hemoglobin levels than the control group. Increased plasma insulin by caffeic acid was attributable to an antidegenerative effect on the islets. Caffeic acid also markedly increased glucokinase activity and its mRNA expression and glycogen content and simultaneously lowered glucose-6- phosphatase and phosphoenol pyruvate carboxykinase activities and their respective mRNA expressions, accompanied by a reduction in the glucose transporter 2 expression in the liver. Zhi et al. [18] investigated the antioxidant activity of black jamun leaf extracts. Leaf extracts contained phenolic compounds, such as ferulic acid and catechin, responsible for their antioxidant activity.
Diabetes, when uncontrolled, causes dyslipidemia often followed by atherogenic abnormalities. Balasubashini [19] examined role of ferulic acid (flavonoid) in diabetes induced dyslipidemia. Study demonstrates that ferulic acid lowers the lipid levels in diabetic rats and hence prevents further complications. It has been documented that ferulic acid may lower blood sugar level of Type 1 and Type 2 diabetic mice by enhancing insulin secretion [20]. Diabetic mice was given rice derived ferulic acid for 17 days and results showed that plasma insulin level increased while blood sugar level decreased significantly compared with control [21]. Ferulic acid may be beneficial in Type 2 diabetic and for the management of diabetic complications. Hussain et al. [22] indicated that quercetin can decrease postprandial glucose level after disaccharides loading, which may be mainly attributed to inhibition of α-glucosidase as one of the expected mechanisms for the reduction of plasma glucose. This effect subsequently leads to suppression of postprandial hyperglycemia. Thus, quercetin can be considered as a potential candidate for the management of type 2 diabetes mellitus. Medicines that reduce postprandial hyperglycemia by suppressing the absorption of carbohydrates are shown to be effective for prevention and treatment of non-insulin dependent diabetes mellitus [23]. Quercetin inhibited in vitro the intestinal α-glucosidase activity [24]. It has been also assumed that quercetin activates tyrosine kinase. Phosphorylation of the specific region of the subunit in insulin receptor (including Tyr- 1158, Tyr-1161 and Tyr-1162) correlates with receptor tyrosine kinase activation and the propagation of the biological actions of the hormone [25].
Correlations between antidiabetic, antiradical and phenolic compounds
Our previous study Gajera et al. [26,27] suggested that antidiabetic activity of fruit parts of black jamun landraces was positively correlated with free radical scavenging activity, nutraceuticals profile and individual phenolic constituents. Total phenols and individual phenolics are positively correlated with antidiabetic and antiradical activities but vary with different level of significances. Individual phenolics - gallic, catechin, ellagic and ferulic acids are highly positively correlated (P0.001) with antidiabetic and free radical scavenging activity. The positive correlation (P0.01) was established for caffeic and chlorogenic acids to scavenge free radicals and α amylase inhibitory activity (antidiabetic) for methanolic extract of black jamun fruit parts. The quercetin was found only in seed and its part kernel fraction of BJLR-6 (very small size fruits) and found to be positively correlated (P0.05) with antidiabetic activity. Among the fruit parts of black jamun land races, seed exhibited maximum seven individual phenolics and total phenols, particularly in their kernel parts. Among the individual phenolics, gallic acid was most diverse phenolic constituents which significantly positively correlated (P0.001) with inhibition of α amylase activity and DPPH radical scavengers followed by catechin, ellagic and ferulic acids in different fruit parts of black jamun land races. The study explained correlation of individual phenolics including flavonoids (ferulic) with α amylase inhibition and free radical scavenging activities in fruit parts of indigenous black jamun landraces.
Muniappan et al. [28] reviewed the black jamun as an antidiabetic plant which contained ellagic acid, glycosides, anthocynine, kampferol, marcein and isoquarcetine; and halt the diastolic conversation of starch into sugar. The phenolic constituents may be contributed directly to the antioxidative action. Consequently, the antioxidant activities of plant/ herb extracts are often explained by their total phenolics and flavonoid contents with good correlation.
To Know More About Current Research in Diabetes & Obesity Journal Please click on: https://juniperpublishers.com/crdoj/index.php
To Know More About Open Access Journals Please click on: https://juniperpublishers.com/index.php
0 notes
Text
A Novel Methodology for Correction of Cosmetic Problems via Secondary Eyebrow Transplantation - Juniper Publishers

A Novel Methodology for Correction of Cosmetic Problems via Secondary Eyebrow Transplantation - Juniper Publishers
Authored by Yi Jung Lin
Abstract
Eyebrows create a very imperative and noticeable feature of the face. With increasing information, eyebrow transplant has become a prevalent technique. Though it is a small area still requires a lot of precision, knowledge and aesthetic skill regarding anatomy, designing of brows, extraction and implantation technique. In this paper, we performed many cases of eyebrow reconstuction including revision by our own implanter. The cases analyzed in this paper were corrected only by transplantation of occipical donor hair without laser hair removal nor tattoos. This article gives a comprehensive view regarding how to correct previously unsatisfactory eyebrow transplant with special emphasis on several points as hair follicle density, eyebrow shape, entire or partially reconstruction, which has become the most skillful technique.
Keywords: Eyebrow Transplantation; Implanter; Hair Follicle Density; Hypothyroidism
Introduction
Eyebrows are the most communicative feature and form a masterline of the face. It is the orientation fact concerning which all other perspectives and outlines of the face are established. Repairing eyebrows have become a reworthing procedure of hair transplant because of the increasing information and exceptional results. However, eyebrow transplant requires a high degree of skill and experience, not to mention the reconstruction transplant under the condition of previously unsatisfactory eyebrow transplant. With the extensive experience of the author in the field of follicular unit extraction (FUE) and follicular unit transplant (FUT)/strip, especially in aesthetic facial hair restoration, it is feasible to perform high-quality surgical techniques creating satisfactory results and a happy outcomes to patients after previously eyebrow transplant under comprehensive communication.
Procedure evaluation before the transplant
Cosmetic is the most common signs of eyebrow transplant such as inherited absence or insufficient coverage, of a normal appearing eyebrow requiring darker colour or an uneven eyebrow with lack of lateral third or medial portion. The other uncommon indications are trichotillomania, scar due to trauma, burn or tumours, stable alopecia areata, madarosis due to hypothyroidism, leprosy, etc. [1]. Although a correct candidate is one who has accurate expectations, understands limits in density achieved, has a pronounced defect than purely cosmetic purposes and stable or treated disease, the patient still expects a near-perfect surgical result. Even well awaring the difficulties of the reconstruction of eyebrow transplant, after seeing the patients undergoing previous surgery, showing an extremely depressed and anxious state, the authors had to try to deal with the cosmetic problem secondary to previous eyebrow transplant.
Methods
The outline of the eyebrows comes from the arrangement and display of each hair follicle. The qulity and survival rate of the follicles implanted decide the appearance of the eyebrow. FUT/ strip with long hair has long been used using single or small hair grafts for brow transplant [2,3]. Persuing grafts of high quality, Graft quality index (GQI) of grade 1, can present the shape of the eyebrow more accurately. We prefer FUT with long hair to control the qulity of grafts, especially a grade 1 of GQI [4], and only a high surviral rate of hair follicle could show a beautiful outline of eyebrows. We use DIMIS-T 100A of high solution of digital Microscope and Samsung LED monitor for follicle dividing. Despite preparing graft using a dissecting microscope gives the dividing a little slower, however, it is worth the effort and much more perfect.
Case Analysis
Entire reconstruction
The patient received eyebrow transplantation by body hair (leg hair) one year before visiting the clinic. Occasionally, the implanted body hair was too thin and too sparse to connect the original eyebrow hair to present an intact curve. This time, we used the occipital donor hair to make an entire reconstruction. And the result gets more complete than the body hair (Figures 1 & 2).
Partially modified
The patient received eyebrow tattoo before eyebrow transplantion resulting in eyebrow hair lost and fibrosis under eyebrow area noted afterwards. She requested eyebrow implantation and liked it to go unnoticed. After the first implantation, partial eyebrow tail didn’t grow well. We checked the direction and quality of the eyebrow head and made a consecutive curve of the eyebrow. The result of integral contour presented after secondary remodification (Figures 3 & 4).
Shape adjustment
Some patients intend to change their eyebrow shape after transplantation. The stretching points of the eyebrow contour are mostly affected by the spots of brow’s peak. If the peaks’ position beyond the lateral canthus, the patient will appear angry and old look. Trying to enhance both brow heads and closer to the middle nose, it will lower down the arch of the eyebrow’s contour. After adjustment and strengthening the heads of the eyebrows, it would make the face appearing kinder, gentler, and more pleasant (Figures 5 & 6).
Density problem
The contour and shape of the eyebrow are built by several hundred hairs. To implant several hundred hairs onto this limited area is really an arduous and skillful technique. However, the patients often desire the evenly displayed eyebrow hairs without any interspace for the better homogeneous presentation. We used single hair and small 2- hair grafts interspersing in the original hairs, making it look more pleasing and homogeneous (Figures 7 & 8).
Curl direction
Generally, most common problems are related to direction and curl, colour and texture mismatch or lack of regrowth [5]. Despite of the shape design and point location, the curl direction is an important factor to make up the image of the eyebrow. Reverse or crooked direction would damage the smooth curve of the eyebrow. To remedy the interference of the bad curl, we implant more and thicker hairs inside and beside them to ease off the visual effects of the undesired curl directions as much as possible (Figures 9 & 10).
Shaft diameter
Compatible hair qualities are necessary in eyebrow revision, even though it is unreasonable in some case. Selection of shaft diameter is related to the eyebrow even face image before surgery. Thus, selecting compatible shaft diameter is important factor in eyebrow revision. It is more important to check the eyebrow shaft of previous implant by trichoscopy before eyebrow transplant, it could find a better reference for revision [6] (Figures 11 & 12).
Low survival rate
FUE is popular in recent years. Howeveer, unskilled physicians may have undesirable consequences. The patient received FUE eyebrow transplant one year before coming to our clinic. Unfortunately, the implanted follicles from FUE presented extremely low survival rate. And owing to the short shaft of follicle is difficult to orient the hair flow, the hairs growed in odd directions. Because of poor survival rate and different hair flow, it will not present a smooth curve of the eyebrow at all. The affected area is too large for the patient to distinguish between old and new hairs. So, the author has to implant the eyebrows with very high density to facilitate the patient trimming (Figures 13 & 14).
Post-operativecare
The patients are instructed not to wash the face and doing make-up on the periorbital area from the next post-operative day until all crusts have fallen off, about ten days after. After ten days, the implanted hair will start to fall off and nearly all brow transplanted hair fall due to anagen effluvium [7] until two months. Hair regrowth begins at 3-5 months. In next 6-8 months, number increases with more density.
Conclusion
The revision of eyebrow restoration is even more challenging than the virgin eyebrow implantation. The details include low follicle density, peculiar hair curl directions, unnatural looks, unsatisfied shapes, hair qulity and so on after implantation. Inspite of the above, sometimes it still varies regarding the personalities of the patients. To keep careful and conservative communication with the anxious patients is a main determinant before making decision. Overall, with the use of highest standards of techniques and with increasing experience, we provide excellent and beautiful results with patient’s accurate anticipations.
To Know More About JOJ Dermatology & Cosmetics Please click on: https://juniperpublishers.com/jojdc/index.php
For more Open Access Journals in Juniper Publishers please click on: https://juniperpublishers.com/index.php
#Juniper publishers#Open access Journals#Peer review journal#Juniper publisher reviews#Juniper publisher journals
0 notes
Text
Emulating Natural Morphology in Anterior Crown Fractures: Two Years Follow-up Report - Juniper

Emulating Natural Morphology in Anterior Crown Fractures: Two Years Follow-up Report - Juniper
Authored by Bora korkut
Abstract
Patients may suffer from undesirable aesthetic problems due to color, shape and structural or position abnormalities of anterior teeth. Crown fractures are one the most common reasons of these aesthetic complaints especially in young patients. Creating a conservative as well as powerful restoration against destructive occlusal forces while emulating similar outlook to natural dental tissues is the main objective of treatment of such cases. Direct composite resin restorations are one of the best possible treatment options for the anterior crown fractures. As the dental materials and techniques develop, the clinicians start to learn the physical and optical properties of these materials and use them with proper techniques to create more natural alike as well as long lasting restorations. These restorations are no longer named as 'day savior fillings' today but are called minimally invasive, functional and long lasting 'direct aesthetic restorations' that perfectly emulate natural dental tissues even in anterior area. This article illustrates how to perform a minimally invasive, long lasting, functional and natural alike direct aesthetic restorations in a single visit..
Keywords: Crown fracture; Direct aesthetic restorations; Emulating natural tissues
Objective
Performing a minimally invasive, long lasting, functional and natural alike direct composite resin restorations in a single visit.
Introduction
Aesthetic restoration of lost dental tissues of anterior teeth is a crucial challenge in restorative dentistry. Patients may suffer from undesirable esthetic problems due to color, shape, structural and position abnormalities of anterior teeth. Creating more conservative as well as more powerful restorations against occlusal, lateral and protrusive forces and emulating similar outlook to natural dental tissues is the main objective of up-to- date, contemporary dentistry [1]. An increasing number of dentists prefer minimal invasive and less time-consuming treatment options; as direct resin restorations compared to indirect ceramic restorations for the anterior dental aesthetics [2]. In order to create more natural-looking restorations, clinicians must learn and understand the physical properties of the dental tissues and restorative materials that they use and also interactions of these tissues and materials with light [3]. Various dental materials and techniques have been coming on the scene to improve both functional and aesthetic quality of the restorations. However a few of the esthetic resin materials on the market meet the expectant. The ones having such properties such as simplicity, structural stability, surface polish ability, masking discolorations, surface texturing and simulating natural dental color parameters such as hue, value and chrome are one step ahead [4,5].
Clinical considerations
In this report complex crown fractures due to dental trauma on maxillary right central and lateral incisors were corrected with minimally invasive direct composite resin restorations by using layering technique in a single appointment. The composite resin material used in this case study is a recently developed resin based restorative material, Estelite Asteria (Tokuyama, Japan) designed for emulating natural dental tissues.
Case Report
17 years old female patient applied to the clinic with aesthetic complaints due to dental trauma. He had direct trauma to the maxillary incisors a year ago and had no pain or any other symptoms. According to the intraoral examination complex crown fractures on maxillary right central and lateral incisors were determined (Figure 1,2).
According to the radiographic and vital metric analysis the injured teeth were considered as vital. The periodontal tissues were healthy and oral hygiene was in good condition. The patient' s age and the examinations were both taken into consideration and a conservative approach, minimal invasive direct aesthetic resin restorations were considered as the treatment plan.
Shades selected by using macro dental photography and composite shade samples which are also known as the 'Button Technique. Most appropriate body and translucent shade samples of Estelite Asteria (Tokuyama, Japan) were selected and located on the crown of left central incisor. The body shades were located on the mid-third and the translucent shades were located on the incisal-third of the crown. Then a macro photograph was taken from the labial view by using a professional camera set designed especially for dental photography. The set consist of a body (D700), a macro lens (Macro 100mml), a macro twin flash (MT- 24EX Macro Twin Late Flash), two-sided reflectors and a dual flash bracket mount (Novo Flex Unset). The picture taken was processed in a computer software program called Adobe Photoshop CC (Photoshop CC, Adobe Systems Software). A processed black and white form of the photograph was used to decide the translucent shade. Another processed copy on which contrast was increased and brightness was decreased, was used to decide the body shade (Figure 3). A1B and NE shades (Estelite Asteria, Tokuyama, Japan) were selected. Temporary restorations were prepared for the cracked teeth on a cast model and silicone impression was taken to create a palatal silicone index (Figure 4). Rubber dam was applied on maxillary incisors and canines for maximum isolation (Figure 5). 45 degree deep beveling were done on both incisors to cover the crack lines as minimally invasive preparations (Figure 6. One bottle universal adhesive agent (Bond Force II, Tokuyama, Japan) was used with selective etching. The translucent shade composite resin, NE shade, was used to create the palatal enamel wall. The resin was placed on incisallt on the silicone index and refined by using a composite brushed wetting resin. Then the resin and the silicone index were placed intraoral on the palatal surface of the teeth and polymerized. The index removed and palatal enamel wall was created (Figure 7).
The same resin was used to create marginal enamel walls of the restorations by using kidney-shaped metal matrix bandstand wedges (Figure 8). Body shade composite resin, A1B shade, was used to emulate dentin tissue (Figure 9). Labial surface was restored by using the translucent shade resin (NE) to create the surface enamel layer (Figure 10). In order to avoid overcontouring, composite brush was used with the wetting resin for layering. The surface structure was also created in final surface layering step. The resin used for emulating the enamel surface layer was applied in 3 steps; medial third, distal third and middle third, so that creating the surface grooves, ridges and also incisal notches while layering. The irregular scratches on the surface were emulated by using the composite brush gently without wetting resin (Figure 11).
After polymerization of the last layer, glycerin (Air Barrier, GC, Japan) was applied to whole the restoration surfaces and polymerized for 40 seconds to eliminate the oxygen inhibition layer. The surface cleaned with water spray and dried with air spray. Marginal adaptations and removal of excessive resins were done by a #12 lancet, a fine-grained composite polishing disk (Soflex, 3M, Japan) and interface sandpapers (Epitex, GC, Japan). The labial surface was polished by using only a fine-grained spiral rubber disc (Twist-Dia, light blue) in low speed and in dry condition (Figure 12,13).
The patient was informed about the oral hygiene and informed for recalls for every 6 months (Figure 14).
At 2years recall no sensitivities, fractures, secondary caries lesions were detected on both the teeth and the restorations. Also no discolorations or demarcation lines were detected (Figure 15,16).
On the other hand the micro surface morphology on the central incisor, created with brush touches while layering, was barely may observed. The patient reported that the restorations were fully functional during the time and he was also very satisfied with the aesthetic result. Oral hygiene and periodontal health were also in good condition (Figure 17).
Considering all, in 2 years follow-up the structural integrity, the color stability as well as the aesthetic outlook of the restorations was considered as satisfactory. The patient was called for further follow-ups.
Discussion
Ever increasing aesthetic demands of the patients require better dental materials and application techniques and also more clinical experience and knowledge. Natural-looking as well as functional and stable dental restorations may only be created only with the combination of these headlines. Natural dental tissues demonstrate translucency, opalescence, and fluorescence that must be imitated by the chosen restorative material in order to emulate the natural [6,7]. Especially translucency is recently accepted to have a key role in shade match of the restorative materials with natural dental tissues. Translucency is defined as the amount of light that passes through the dental tissues and may vary according to one of the parameters of color, value [8]. If the value of a tooth or dental material is high, lighter reflect from the surface, resulting in low translucency [9]. Taken this into consideration, some dental manufacturers have developed some new generation of aesthetic composite resins to emulate the natural dental tissues better than ever.
In the case presented a recently produced Estelite Asteria (Tokuyama, Japan) was used as the composite resin material which has supra-nano inorganic spherical fillers. Although this resin has an advantage for using as two-step layering, in this case conventional three-step layering was used to mimic the natural dental tissue layers. The composite brush manipulation was very easy and effective while layering as the consistency of the resin was soft enough. It is a fact that the composite layering procedures under reflector light takes much longer time that might be a problem. But the working time of the shades of this resin was also long enough. The polymerizing time for the shades used in this study was 10 seconds that is an advantage for the clinician. The natural surface morphology was emulated with gentle brush touches while surface layering. As the method used for layering depends on not creating over-contouring, the polishing procedures for restoration surfaces only done by a fine grained spiral polishing disc (Twist Dia, light blue). The surface texture created by composite brush hits could only be protected by using this polishing procedure [10]. This polishing material also creates a very shiny surface that is also very resistant to discolorations. Smooth adaptation between resin and dental tissues and having no micro-leakage due to the enhanced physical properties of the resin such as low polymerization shrinkage may describe having no sensitivities or secondary caries at 2 years recall [11]. As the correct indication of the case is an indispensable condition for direct anterior resin restorations, the stability of the restorations depends on having no devastating occlusal forces. The restorations were fully functional during the 2 years time and had no fractures as a result of that [12]. The enhanced fracture resistance of the composite resin might also positively affect the strength of the restorations. Also the glycerin (Air Barrier, GC, Japan) used for enhancing the physical properties of the surface layer made a positive effect on creating a more resistant surface layer to potential fractures and discolorations [13]. The loss in micro surface morphology on the central incisor that was created with brush touches may be related to the erosive or abrasive pattern of patient's diet and brushing style. It may be due to the surface roughness of the restoration which is related to the physical properties of the resin used. However that loss was insignificant for the aesthetic outlook in speaking distance. The patient was very satisfied with the durability, aesthetic outlook and especially the color harmony and gloss of the restorations. The specific spherical fillers and enhanced optical properties of the resin [14], the button technique used for selection of the shades [15], overcontour less layering technique [8,16] and detailed polishing procedures [17] are possibly played the key roles in this aesthetic outcome.
For years the anterior direct resin restorations compared to the indirect veneers and accepted as a loser in general. They were blamed as weak especially about durability and color resistance. However before criticizing, everyone must self-criticize him/ herself and ask the question: if these direct restorations were done correctly or not? Like all dental procedures, direct composite resin restorations have some indications and contra-indications. These can be aliened as; proper occlusal relations [18], correct shade selection [19], good isolation [20], good adhesion [21], detailed polishing [22], frequent recalls [18,21] quality materials [18] and also clinical experience. These are like rings of a circle and if one of them breaks, then the whole restoration fails. If the direct composite resin restorations were performed by taking these into consideration, the success rate of these restorations would definitely increase.
Conclusion
As a conclusion although 2 years times still a short term to evaluate, with correct indication, quality material and proper technique the direct resin restorations were seemed to be highly long lasting, color resistant and aesthetic under the conditions of this follow-up case study If direct restorations with composite resins are done by the rules, they are obviously one of the best treatment options for today's dentistry.
For more Open Access Journals in Juniper Publishers please click on: https://juniperpublishers.com/aboutus.php
For more articles in Open Access Journal of Dentistry & Oral Health please click on: https://juniperpublishers.com/adoh/index.php
To know more about Open Access Journals please click on: https://juniperpublishers.com/journals.php
#Juniper Publishers Review#Juniper Publishers group#Restorative Dentistry#dental sciences#peer reviewed journals
0 notes
Text
Primary Brain Ewing Sarcoma/pPNET in Elder Adult

Authored by Rato J
Abstract
The Ewing sarcoma/peripheral primitive neuroectodermal tumour type tumour (EWS/pPNET) group includes those small round blue cell tumours with morphological attributes of the germinal neuroepithelium. It represents a group of rare primary intracranial tumours, mostly described in paediatric population. There are very rare reports of primary intracranial EWS / pPNET in elders. We report the case of an 83-year- old man, where a cerebellar-pontine lesion mimicking a meningioma turned out to be a EWS/pPNET. Genetic studies were not performed, as he was not to be submitted to chemotherapy.
Keywords: EWS/pPNET; Ewing sarcoma; Peripheral primitive neuroectodermal tumour; Cerebellar-pontine angle
Go to
Introduction
Ewing sarcoma / peripheral primitive neuroectodermal tumour type tumour (EWS / pPNET) are very rare tumours (1% of all sarcomas); Ewing's sarcoma represents 5 to 15% of malignant bone and soft tissue tumours; two thirds of cases of Ewing's tumours occur before age 35 years, with a median age of 20 years [1]. Primary brain tumour cases in adults are found in reports literature [2,3]. Ewing sarcoma / peripheral primitive neuro ectodermal tumour type tumour (EWS / pPNET), belongs to a tumour family that shares clinicopathologic and molecular genetics features. Histologically, its family is recognized as a small, round, blue cell tumour, staining positively for CD99 and usual genetic features gene rearrangements between chromosome 22 and 11 (22q11 EWSR1/FLI1) or FUS (chromosome 16) [4]. Primary brain tumours of this sort are rare (a review of the literature revealed 19 cases), being the eldest a 67-year old female [5-22]. They are classified per the 2016 WHO Classification as mesenchymal, non-meningothelial tumours [4].
Go to
Review of the Case
We report the case of an 83-year-old man, autonomous, who presented at the emergency department with complaints of numbness on the right side of the face lasting 3 months. The patient underwent a head-CT, which demonstrated the presence of an extra-axial lesion on the right cerebellar-pontine angle, approximately 2cm wide, and was referred for a neurosurgical appointment. He returned a month later to the emergency department complaining of a severe loss of balance that deemed him unable to walk. He repeated the head-scan which showed that the lesion had doubled in size within this timespan. A head- MRI was performed and the lesion resembled a meningioma. The patient underwent surgery 2 weeks later and total removal of the lesion was achieved via retrosigmoid craniotomy. In the immediate postoperative period, he presented a right peripheral facial palsy, House-Brackman 4, and therefore a tarsorrhaphy was performed. He recovered partially of his facial palsy, and is now able to walk. No further lesions were found and he is scheduled to start radiotherapy [23].
Go to
Discussion
The histology of the lesion revealed a small, round cell tumour with an immunophenotype favouring the Ewing sarcoma / peripheral primitive neuroectodermal tumour type tumour (EWS / pPNET). Genetic studies were not performed in this case, since the patient was not to be submitted to chemotherapy. These are very rare tumours, mostly appearing on paediatric age and therefore the diagnosis and prognosis factors are unknown. Ibrahim et al. [24] in their recent review, proposed some possible prognostic factors, some of which are applicable to Ewing sarcoma in a broader sense. Specifically, age greater than 17 years, inaccessibility of the tumour for surgical resection, incomplete resection, multifocality, and tumour genetic factors (e.g. Type 1 fusion gene) appear to have negative prognostic implications. There is not enough data on the matter to draw a conclusion other than it is a diagnostical challenge to distinguish these tumours from other with similar characteristics; but it is fundamental to do so, ensuring that proper follow-up and complementary treatments are administered.
For more open access journals in juniper publishers please click https://juniperpublishers.com/
For more articles on Open Access Journal of Neurology & Neurosurgery Please click on https://juniperpublishers.com/oajnn/
Open Access Journal of Neurology & Neurosurgery in Full text in Juniper Publishers
https://juniperpublishers.com/oajnn/OAJNN.MS.ID.555611.php
#juniper publishers peer review#Juniper Publishers#Juniper Publishers group#juniper publishers Reviews
0 notes
Text
Light in My Heart

Perspective
Let noble thought come to us from all direction, Rigveda
Let noble thoughts Go from us in all directions, Quantum Rope
Big Bang led to creation of this world from Shunya in the form of light and clouds of waves and particles. Human beings arrived on the earth much later. They arose from the light and clouds of waves and particles. Thus, they are also product of creation from shunya and carry in their heart the sparks of the 'original light'. After their arrival, they were under wonderment and wondered at their own life and origin of the 'Original Light' as well as unfolding of Shunya in terms of matter, mind and consciousness.
Wonderment led to curiosity and later scientists started studying nature of Nature and nature of light. From their study they discovered that light is both wave and particle. Further, light led to an understanding of space and time. Newton concluded that space and time are Absolute. Einstein imagined moving with speed of light and from such an initial imagination came some interesting insights such as mass energy equivalence which found expression in famous equation, e = mc2. Space and time are not Absolute concepts but are relativistic concepts, he concluded. Further, light is the ultimate limit in the universe. His formulations led to a major paradigm shift in human thinking with respect to light, space, time and related concepts. In my book, Quantum Rope (1999) I suggested a more generic equation e = m cn (Sharma 1999), wherein e represents energy, m represents matter and c represents consciousness and n can be 1,2,3, ...representing the expanding circles of consciousness. At the physical level, consciousness (c ) is represented by light and thereby by speed of light (c). While Einstein's equation is at the physical level, e=mcn is at the generic level including all sheaths (koshas) of human existence and it represents equivalence of matter, energy and consciousness from the spiritual perspective. When consciousness expands like the oceanic waves, human beings reach higher levels of consciousness beyond the physical notions of space and time. In fact, e = mcn can be considered as a spiritual equation, as it suggests evolution towards nirvana (n) or 'zone of eternity’ (represented by n in this equation). It also represents the 'ahm brahmasmi' state of consciousness. In this equation, m, e, c, n also represent gross, subtle, supra-subtle and astral states of mind and these are broadly in consonance with waking, dream, deep sleep and trance (Samadhi) states of consciousness. In the equation, e = mcn, we find an interconnectivity among various states of consciousness.
Einstein imagined moving with 'speed of light' and gave us his famous ideas and theories. Once I took liberty of poetic imagination and this led to a poem under the title, “Velocity of Light’ that was published in my book, Quantum Rope (1999, p.13). In Physics, light is considered a scalar quantity, however, when viewed from spiritual perspective, light guides and provides a direction, hence, it can also be considered vector quantity. This provides the reason for title of the poem as “Velocity of light' instead of 'Speed of light’. In this poem Einstein’s idea of twin paradox is also captured. The poem is as follows:
You said long time and no see
I had met you tomorrow near the sea
You said we have met somewhere
I had met you in your future
Because I was travelling with velocity of light
And you were travelling with velocity of kite
I went out on a tour of galaxies
My classmates were still hiring taxies
When I returned home, I was in a younger mould
My classmates had grown very very old
Because I was travelling with velocity of light
And they were travelling with velocity of kite
(Velocity of light, quantum rope: science, mysticism and management, Subhash Sharma, 1999, p.13)
When you light a lamp or candle or switch on light, the darkness is removed. Thus light gives us a lesson that there is no need to Fight. In fact there are three types of individuals viz. those who use 'Fight' approach, those who use 'Flight' (Moving to another space or place/ Flight of Imagination) approach and those who use 'Light' approach to achieve success. Believers in Fight approach tend to give a negative meaning to Flight approach as they equate it with escapism. However, 'Flight' approach can also be a creative as example of Sri Krishna shows us. He took 'Flight' approach (left Mathura to create Dwarika) and used it in a creative way to create a new city and a new perspective. Further he also took the Light approach to enlighten the whole world through his new insights as is evident from Gita. When individuals take the Light approach, they act like the lamp or candle, spreading their ideas and wisdom to remove darkness. Buddha said, become a lamp and remove the darkness. In fact it is up to an individual to follow any of these paths. His/her choice depends on his/her awareness, awakening and self evolution stage. Through light of knowledge, wisdom and consciousness, ignorance is removed. Light is a symbol of noble thoughts. By lighting the lamp of knowledge ('knowledge lamp'), we spread the noble thoughts in all directions.
As I reflected and meditated on the deeper meaning of LIGHT in terms of five letters of its spelling, it led me to a new meaning of LIGHT in terms of Light (L), Infinity (I), God (G), Harmony (H), Truth (T). This LIGHT led me to the following LIGHT Equation:
L = I = G = H = T
Light (L) = Infinity (I) = God (G) = Harmony (H) = Truth (T)
Thus, Light is Infinity, Light is God, Light is Harmony and Light is Truth
This interpretation of LIGHT provides us a new vision and this vision can be expressed in terms of following four principles:
Light is Infinity, Infinity is Light ( L = I)
Light is God, God is Light (L = G)
Light is Harmony, Harmony is Light (L = H)
Light is Truth, Truth is Light (L = T)
It may be observed that Gandhi’s famous quote, God is Truth and Truth is God ( G = T) is a derivative of these principles. Further all religions refer to these principles in one form or other. In fact this interpretation of LIGHT provides us the Oneness vision of all religions and spiritual traditions.
I may indicate that the 'LIGHT Vision’ suggested here is essentially a realization of 'Light in our hearts'. In 1993, I wrote a song titled as 'Light in my Heart' and it was published in my book, Creation from Shunya. This song was adopted in 1996, by first batch students of WISDOM (Women’s Institute for Studies in Development Oriented Management), Banasthali University, Banasthali, Rajasthan, as 'Wisdom song'. This song can also be considered as a 'song of light'. Some lines of this song are as follows:
There is light in my heart
It is there from the start
Its mystery you want to know
It says hello hello ...
It give me a peep
Into things that are deep
It has a beautiful glow
It says hello hello .
It shows silver lines
Bending space and time
In nature's beauty show
It says hello hello .
This light is divine
It makes us fine
Its flow is very slow
It says hello hello ...
(Light in my heart, creation from Shunya, Subhash Sharma, 1993, p. 33)
Let this 'LIGHT Vision' in the form of 'LIGHT in our hearts', spread in all directions for the benefit of all. This vision represents the essence of the 'Wisdom, Consciousness and Light of India’ that many across the world are seeking to create a new vision for the world based on a consciousness shift from fight to light - from lower levels of consciousness to higher levels of consciousness. Realization of 'Light in My Heart' has the potential of transforming the world in to Pragyasthan(A Place of Wisdom), where Science (Scientific temper and scientific approach, Rationalistic worldview), Heart (Heartistic approach, Heart values, Human values) and Spirituality (Spiritual temperament and spiritual approach) find a new integration for the benefit of the whole world. In modern society, Head is given primacy over Heart even though Head owes its vitality to Heart because Heart is the source of blood supply to Head. This implies that science and rationality are incomplete without human values and spirituality. This realization dawns when we realize 'Light in our hearts'
Light in my heart as a step towards higher evolution
Darwin to divinity: Above discussion takes us towards a model of "Arrival of Human Beings and Self evolution". In the beginning of this article, we mentioned about creation of this world from the 'original light' and clouds of waves and particles that took shape in the form of Panchmahabhutas (Five elements). 'Natural interactions’ along with various 'permutations and combinations' among five elements combined with natural 'quantum churning’ arising from natural interactions, lead to creation of life in various forms. This led to 'arrival of human beings’ from the 'clouds’. This perspective based on 'creation from shunya' provides us a new approach to creation and evolution of life including human beings. Original Light is embedded in the heart of every human being and this provides the basis for higher evolution of human being towards realization of this light within. Darwin dealt with evolution through natural selection at the Biological level. It may be indicated that at biological level, human beings are no different from animals and are particularly very close to certain species. However, they differ from animals because of more developed neuron structures in human mind. Sri Aurobindo was concerned with human evolution at the mind and consciousness level. Dasavatara theory of evolution represents an integral approach to evolution wherein we find an integration of the matter, mind and consciousness (mmc) approaches to human evolution. This integration suggests that 'Shunya Unfolding’ (SU)' has been taking place in a natural way in terms of matter (gross level), mind (subtle level) and consciousness (supra-subtle level)) and this 'natural unfolding' is represented by Body, Heart and Spirit (BHS). As we transcend Body (gross), Heart (subtle) and Spirit (supra-subtle) levels, we realize our cosmic/ divine/astral nature that has been referred to as 'aham brahmasmi’. Thus, we have following perspectives on human evolution:
a. Creation from Shunya: Arrival of life from the clouds of waves and particles
b. Darwin’s theory of evolution: Biological perspective on evolution
c. Aurobindo’s perspective of mind evolution
d. Dasavatara 'theory'/ view of evolution
e. 'Aham brahmasmi’/ Divinity/ Divine being view of evolution
'Cloud theory’ of evolution suggests creation of life from the clouds of waves and particles, happens as a result of (i) natural interactions, (ii) permutations & combinations (iii) quantum churning. In contrast, Darwin’s biological evolution is result of nature's selection and biological fitness. Higher evolution among human beings is result of self effort and thereby self selection on the part of human beings. In consonance with the above, there are various stages of human evolution viz. shunya stage, biological stage, heart-mind awakening stage, consciousness enlightenment stage and cosmic being stage. While some persons remain at the biological stage, hence, their behaviour is driven by Biological (B) factors and they remain at Darwinian level of existence and believe in 'survival of the fittest to eliminate the rest’. Some move to next stage represented Heart’s Awakening (HA) and by Human values, heartfulness and heartistic approach to life and human existence, some move further to the next stage represented by Spiritual (S) values and spiritual temperament and a few reach the cosmic being level as they have inner desire for 'cosmic realization' of reaching Harmonic Oneness (HO) stage represented by 'aham brahmasmi’. YOGA, when defined as "Yearning for Oneness and Gaining Advancement" (Sharma 1996, in “Western Windows Eastern Doors’), helps our self evolution towards Harmonic Oneness (HO). According to Swami Vivekananda, every human being is potentially divine and aim of human, beings is to manifest this divinity within. Thus, human journey is a journey from 'Shunya Unfolding' (SU) through Biological (B), Heartfulness (H), Spiritual (S) stages and finally reaching Harmonic Oneness (HO) stage. In essence this represents evolution from Biological (B) being to Human (H) being ('being human’), Spiritual (S) and Cosmic being representing Harmonic Oneness (HO) with everything around us. These stages represent the expanding circles of human consciousness from biological state to cosmic/ divine being state. Hence, we refer this model as 'Darwin to Divinity’ and this four circles model of human evolution is presented in Figure 1.
Above presented model of human evolution is also captured in the following poem titled as 'I Am a New Religion’ (Shunya Poems, Subhash Sharma, 2010, p. 43):
I am a new religion, Higher than every religion,
A religion of being, being a human being,
Being a higher being, being a cosmic being,
I am a new science, Higher than every science,
A science of being, being a human being,
Being a higher being, being a cosmic being,
I am a new ism, Higher than every ism,
An ism of being, being a human being,
Being a higher being, being a cosmic being,
I am a new identity, Higher than every identity,
An identity of being, being a human being,
Being a higher being, being a cosmic being,
I am a new consciousness, a consciousness of being,
Being a higher being, being a cosmic being.
(I am a New Religion, Shunya Poems, Subhash Sharma, 2010, p. 43)
It may be indicated that this poem also traces the journey of human society since 'shunya unfolding' and the arrival of human beings on earth. This journey is a journey from Religion (s) to Science to Ideologies in the form of many Isms that originated in 19th and 20th century with their intellectual foundations in conflict and violence and to current focus on Identities (e.g. national identity, regional identity etc.). It also suggests future evolution towards a new consciousness of being a cosmic being. Realizing 'Light in our hearts' is a step in this direction.
For more articles in Journal of Yoga and Physiotherapy please click on https://juniperpublishers.com/jyp/index.php
For more about Juniper Publishers please click on https://juniperpublishers.com/index.php
#journal of yoga and physiotherapy#physiotherapy#physical health#juniper publishers#open access journals#juniper publishers high impact journals#high impact factor journals#peer review journals
2 notes
·
View notes