#http://hyperphysics.phy-astr.gsu.edu/hbase/wien.html
Explore tagged Tumblr posts
Visit Tumblr Blog
Explore Tumblr blogs with no restrictions, modern design and the best experience.
Last Seen Tumblr Blogs


Fun Fact
Tumblr.com rank in the US is 25.
Text
How Hot Can It Get?
How Hot Can It Get?
TEMPERATURES! Links to everything:
http://www.twitter.com/tweetsauce http://www.facebook.com/VsauceGaming
Thanks to http://www.youtube.com/minutephysics and http://www.youtube.com/user/phdcomics for their guidance on this video!
All music (except for the classical in the beginning) by Jake Chudnow: http://www.soundcloud.com/JakeChudnow
Human body temperature: http://antranik.org/regulation-of-body-…
View On WordPress
#Amazon.com#Astrophysics#Electromagnetism#Gases#http://blogs.discovermagazine.com/badastronomy/2008/03/03/wr-104-a-nearby-gamma-ray-burst/#http://forums.xkcd.com/viewtopic.php?f=18&t=39799#http://hyperphysics.phy-astr.gsu.edu/hbase/wien.html#http://www.amazon.com/The-Universe-Teacup-Mathematics-Beauty/dp/0151003238#http://www.youtube.com/watch?v=HVb7XzTbl2k&feature=BFa&list=PL5B111EE10D69CD6E#Internet & Mail Order Department Stores#MICROWAVE#Nature#Physics#Plasma#Technology Internet#Thermodynamic temperature
0 notes
Photo
EXPLAINING THE PLANCK’S CURVE OF THE BLACK-BODY RADIATIONPosted on
21st June 2019
by
theshan_weerasinghe
In this article, we will study the properties of Planck’s Intensity-Wavelength Curve of Black-Body Radiation. As usual, I will try to give more of a conceptual explanation rather than mathematical. But keep in mind that, in physics, especially in Quantum Mechanics, the involvement of mathematics is inevitable.
Now, If you take a look at the given figure, it is conspicuous that this curve is approximately a ‘Normal Distribution’. (Statistically)
If you’re familiar with the idea of a ‘Normal Distribution’, this article will be a piece of cake for you. But since everyone should be considered, we will first get familiar with the idea of a normal distribution.
What is a normal distribution?
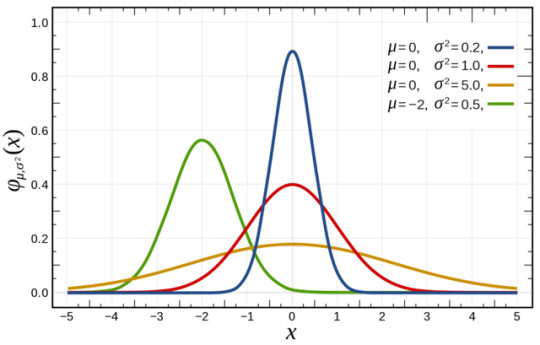
An ideal normal distribution is shown below.
https://en.wikipedia.org/wiki/Normal_distribution#/media/File:Normal_Distribution_PDF.svg
Above picture implements 3 ‘Probability Density Functions’ which gives out 3 normal distributions. Check out this awesome website for more info. Probability Density Function @mathinsight
An ideal normal distribution would consist of the following characteristics.
The mean, median and the mode are the same in the distribution. Here, it’s situated at the peak.
So obviously the graph is symmetric around the mean. That means, the areas right to the peak and left to the peak each represents 50% of the samples(whatever results of the experiment we implemented in the function).
Many numbers of these samples or experimental results are concentrated around the mean value and at the extremes, the numbers fall drastically. (we will discuss that later in the article)
Theoretically. the graph extends to infinity.
Alright, that would be enough for the discussion here.
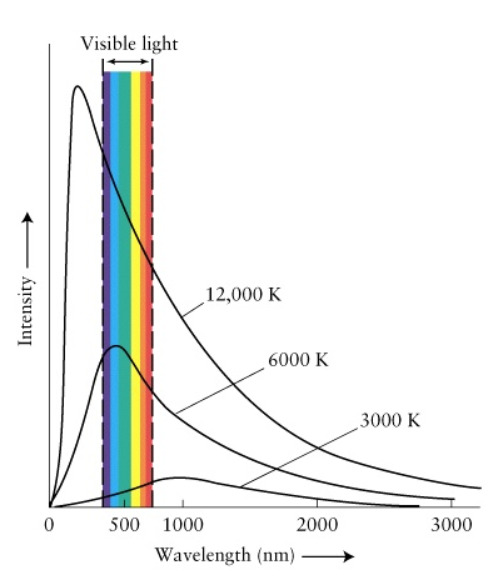
Here, in the Planck’s Black-Body Radiation distribution, the graph is drawn between the Intensity of the radiation and wavelength of that radiation for specific temperatures. For different temperatures, you get different graphs of the same family. Check out the picture below.
Source: https://sites.ualberta.ca/~pogosyan/teaching/ASTRO_122/lect4/lecture4.html
Here, you will see that at higher temperatures, the peak of the curve moves toward the lower wavelengths (higher frequencies). Also, the peak gets higher and higher when the temperature is high while increasing the area of the graph too. Why is that?
As more and more energy is supplied, the Black-Body gets warmer and warmer (emits more energy). As it’s temperature goes higher, the radiation it emits goes to higher frequencies. (more energetic radiation is emitted) So, with common sense, we can expect the peak to move towards the lower wavelength side. This was explained mathematically by Wilhelm Wien. (For the mathematical explanation go to http://hyperphysics.phy-astr.gsu.edu/hbase/wien.html)
Also, when more and more energy is supplied, the emission of radiation in numbers also increases. Therefore, at higher temperatures, we must expect the graph to increase in area.
The reason for the peak to be broader at lower temperatures and higher at higher temperatures is also a characteristic of a normal distribution. To explain the situation in a more understandable way, consider the Maxwell-Boltzmann curve of gas molecules. When the temperature goes high, you will see that the number of molecules that achieve those speeds within some range will be reduced. (Not every molecule can achieve that energy when the energy is higher). The same thing happens in Plank’s distribution too. Though the energy goes high, the number of peak radiations become lower in a specific range.
According to Planck, the energy must absorb and emit in discrete values called ‘quanta’. His idea was that the energy of these discrete ‘quanta’ was proportional to frequency. In the last article, we saw how Planck developed his theory. Now we will see how his idea explained the graph.
At that time, as far as I know, even though the electron was discovered, scientists did not have a clear idea about how it was situated or, how atoms absorb energies. Also, they argued about the wave and particle natures of the light. So the explanation of how atoms absorb and emit energy could not be explained very well even by Planck at that time. Anyhow, he said, according to his findings, the atoms must absorb and emit radiation in discrete numbers, not in a continuous manner. That means you can keep directing some source of energy towards a sample, but not until it receives some specific energy, will it absorb what you supply.
But now we believe that electrons absorb energies from ‘photons’ in specific numbers and achieve higher energy states and even get themselves removed from their atoms sometimes. The above curve gets its shape because the energy an electron can absorb and emit is limited. With that limitation at some point, it would stop absorbing and emitting energy. (we haven’t experienced that yet) But at this point, we consider the Black-Bodies would absorb and emit radiation of wavelengths or frequencies of infinite and infinitesimal discrete values.
Even though Plank’s formula explained the Black-Body radiation and everything in thermodynamics, there was still an unexplained phenomenon called ‘Photoelectric Effect’ which, even Plank couldn’t explain with his idea of ‘quanta’ which was really close to a little modification which Einstein did, which could’ve given the whole glory to Planck himself if he had realized it.
At that time, whether if the light was a wave or a particle was doubtable for scientists. (Like we’re in doubt with relativity and quantum mechanics where both of them explain different phenomena.) It was called ‘The wave-particle duality‘. (Guess what would be my next article. LOL)
Planck’s theory’s drawback was that it couldn’t explain a model for ‘quanta’. He only explained the phenomenon of Black-Body radiation but didn’t try to give a physical interpretation of how these energy transfers of quanta would happen.
Then came Einstein into play where he took over everything and invented a particle which has both wave and particle natures that solved everything that was in doubt, successfully interpreting quanta as particles of energy.
That will be for another day.
Until then keep reading stuff.
Will see you soon with another article.
#Quantum Theory#quantum physics#quantum mechanics#quantum#physics#chemistry#science#technology#innovation#education#thequantuminsight
1 note
·
View note
Text
EXPLAINING THE PLANCK’S CURVE OF THE BLACK-BODY RADIATIONPosted on
21st June 2019
by
theshan_weerasinghe
In this article, we will study the properties of Planck’s Intensity-Wavelength Curve of Black-Body Radiation. As usual, I will try to give more of a conceptual explanation rather than mathematical. But keep in mind that, in physics, especially in Quantum Mechanics, the involvement of mathematics is inevitable.
Now, If you take a look at the given figure, it is conspicuous that this curve is approximately a ‘Normal Distribution’. (Statistically)
If you’re familiar with the idea of a ‘Normal Distribution’, this article will be a piece of cake for you. But since everyone should be considered, we will first get familiar with the idea of a normal distribution.
What is a normal distribution?
An ideal normal distribution is shown below.
https://en.wikipedia.org/wiki/Normal_distribution#/media/File:Normal_Distribution_PDF.svg
Above picture implements 3 ‘Probability Density Functions’ which gives out 3 normal distributions. Check out this awesome website for more info. Probability Density Function @mathinsight
An ideal normal distribution would consist of the following characteristics.
The mean, median and the mode are the same in the distribution. Here, it’s situated at the peak.
So obviously the graph is symmetric around the mean. That means, the areas right to the peak and left to the peak each represents 50% of the samples(whatever results of the experiment we implemented in the function).
Many numbers of these samples or experimental results are concentrated around the mean value and at the extremes, the numbers fall drastically. (we will discuss that later in the article)
Theoretically. the graph extends to infinity.
Alright, that would be enough for the discussion here.
Here, in the Planck’s Black-Body Radiation distribution, the graph is drawn between the Intensity of the radiation and wavelength of that radiation for specific temperatures. For different temperatures, you get different graphs of the same family. Check out the picture below.
Source: https://sites.ualberta.ca/~pogosyan/teaching/ASTRO_122/lect4/lecture4.html
Here, you will see that at higher temperatures, the peak of the curve moves toward the lower wavelengths (higher frequencies). Also, the peak gets higher and higher when the temperature is high while increasing the area of the graph too. Why is that?
As more and more energy is supplied, the Black-Body gets warmer and warmer (emits more energy). As it’s temperature goes higher, the radiation it emits goes to higher frequencies. (more energetic radiation is emitted) So, with common sense, we can expect the peak to move towards the lower wavelength side. This was explained mathematically by Wilhelm Wien. (For the mathematical explanation go to http://hyperphysics.phy-astr.gsu.edu/hbase/wien.html)
Also, when more and more energy is supplied, the emission of radiation in numbers also increases. Therefore, at higher temperatures, we must expect the graph to increase in area.
The reason for the peak to be broader at lower temperatures and higher at higher temperatures is also a characteristic of a normal distribution. To explain the situation in a more understandable way, consider the Maxwell-Boltzmann curve of gas molecules. When the temperature goes high, you will see that the number of molecules that achieve those speeds within some range will be reduced. (Not every molecule can achieve that energy when the energy is higher). The same thing happens in Plank’s distribution too. Though the energy goes high, the number of peak radiations become lower in a specific range.
According to Planck, the energy must absorb and emit in discrete values called ‘quanta’. His idea was that the energy of these discrete ‘quanta’ was proportional to frequency. In the last article, we saw how Planck developed his theory. Now we will see how his idea explained the graph.
At that time, as far as I know, even though the electron was discovered, scientists did not have a clear idea about how it was situated or, how atoms absorb energies. Also, they argued about the wave and particle natures of the light. So the explanation of how atoms absorb and emit energy could not be explained very well even by Planck at that time. Anyhow, he said, according to his findings, the atoms must absorb and emit radiation in discrete numbers, not in a continuous manner. That means you can keep directing some source of energy towards a sample, but not until it receives some specific energy, will it absorb what you supply.
But now we believe that electrons absorb energies from ‘photons’ in specific numbers and achieve higher energy states and even get themselves removed from their atoms sometimes. The above curve gets its shape because the energy an electron can absorb and emit is limited. With that limitation at some point, it would stop absorbing and emitting energy. (we haven’t experienced that yet) But at this point, we consider the Black-Bodies would absorb and emit radiation of wavelengths or frequencies of infinite and infinitesimal discrete values.
Even though Plank’s formula explained the Black-Body radiation and everything in thermodynamics, there was still an unexplained phenomenon called ‘Photoelectric Effect’ which, even Plank couldn’t explain with his idea of ‘quanta’ which was really close to a little modification which Einstein did, which could’ve given the whole glory to Planck himself if he had realized it.
At that time, whether if the light was a wave or a particle was doubtable for scientists. (Like we’re in doubt with relativity and quantum mechanics where both of them explain different phenomena.) It was called ‘The wave-particle duality‘. (Guess what would be my next article. LOL)
Planck’s theory’s drawback was that it couldn’t explain a model for ‘quanta’. He only explained the phenomenon of Black-Body radiation but didn’t try to give a physical interpretation of how these energy transfers of quanta would happen.
Then came Einstein into play where he took over everything and invented a particle which has both wave and particle natures that solved everything that was in doubt, successfully interpreting quanta as particles of energy.
That will be for another day.
Until then keep reading stuff.
Will see you soon with another article.
#quantum mechanics#quantum physics#Quantum Theory#quantum#physics#nuclear physics#particle physics#logic#technology#innovation#education#chemistry#science
0 notes