#echosounder ship
Explore tagged Tumblr posts
Visit Tumblr Blog
Explore Tumblr blogs with no restrictions, modern design and the best experience.
Last Seen Tumblr Blogs


Fun Fact
Premium Tumblr themes are available from anywhere between $9 to $49.
Text
Indian Naval Ship INS Sandhayak Commissioned in Visakhapatnam with State-of-the-Art Sonar Systems
In a significant stride for India's maritime strength, the Indian Navy has proudly commissioned the advanced survey vessel INS Sandhayak in a grand ceremony in Visakhapatnam. Three more will follow. The vessel is equipped with sophisticated sonar systems from Teledyne Marine and represents the pinnacle of modern naval engineering. The Defense Minister, Rajnath Singh, officiated at the commissioning ceremony on Saturday, February 3, 2024. The INS Sandhayak, a 110-meter-long ship with a displacement of 3,400 tons, is powered by two diesel engines and can exceed speeds of 18 knots. Built by Garden Reach Shipbuilders & Engineers (GRSE), the vessel is the first to join the Indian Navy's fleet as part of this program. The commissioning event was graced by VIP guests from the Navy and the Indian Naval Hydrographic Office (NHO), including top-ranked Navy officers from the regional command. The current Chief Hydrographer of India, Vice Admiral Lochan Singh Pathania, and his predecessors were also in attendance to witness this milestone in Indian naval history. Teledyne Marine, a global leader in underwater technology, has been instrumental in providing a suite of advanced sonar systems. These include 4 HydroSweep DS Deep Water Multibeam Echosounders (MBES), 8 SeaBat T-Series Shallow Water Multibeam Echosounders (MBES), and 36 DESO 5 Single Beam Echosounders (SBES).
In a significant stride for India’s maritime strength, the Indian Navy has proudly commissioned the advanced survey vessel INS Sandhayak in a grand ceremony in Visakhapatnam. Three more will follow. The vessel is equipped with sophisticated sonar systems from Teledyne Marine and represents the pinnacle of modern naval engineering. The Defense Minister, Rajnath Singh, officiated at the…

View On WordPress
0 notes
Link
#sensor geoteknik#sensor#echosounder#echosounderkapal#echosounder laut#echosounderlaut#geotechnical#Geotechnical Instrumentation and Monitoring Market#fishfinder#fish finder#echosounder ship
0 notes
Text
Sound reveals giant blue whales dance with the wind to find food
https://sciencespies.com/environment/sound-reveals-giant-blue-whales-dance-with-the-wind-to-find-food/
Sound reveals giant blue whales dance with the wind to find food
A study by MBARI researchers and their collaborators published today in Ecology Letters sheds new light on the movements of mysterious, endangered blue whales. The research team used a directional hydrophone on MBARI’s underwater observatory, integrated with other advanced technologies, to listen for the booming vocalizations of blue whales. They used these sounds to track the movements of blue whales and learned that these ocean giants respond to changes in the wind.
Along California’s Central Coast, spring and summer bring coastal upwelling. From March through July, seasonal winds push the top layer of water out to sea, allowing the cold water below to rise to the surface. The cooler, nutrient-rich water fuels blooms of tiny phytoplankton, jumpstarting the food web in Monterey Bay, from small shrimp-like krill all the way to giant whales. When the winds create an upwelling event, blue whales seek out the plumes of cooler water, where krill are most abundant. When upwelling stops, the whales move offshore into habitat that is transected by shipping lanes.
“This research and its underlying technologies are opening new windows into the complex, and beautiful, ecology of these endangered whales,” said John Ryan, a biological oceanographer at MBARI and lead author of this study. “These findings demonstrate a new resource for managers seeking ways to better protect blue whales and other species.”
The directional hydrophone is a specialized underwater microphone that records sounds and identifies the direction from which they originate. To use this technology to study blue whale movements, researchers needed to confirm that the hydrophone reliably tracked whales. This meant matching the acoustic bearings to a calling whale that was being tracked by GPS. With confidence in the acoustic methods established, the research team examined two years of acoustic tracking of the regional blue whale population.
This study built upon previous research led by MBARI Senior Scientist Kelly Benoit-Bird, which revealed that swarms of forage species — anchovies and krill — reacted to coastal upwelling. This time, researchers combined satellite and mooring data of upwelling conditions and echosounder data on krill aggregations with the acoustic tracks of foraging blue whales logged by the directional hydrophone.
“Previous work by the MBARI team found that when coastal upwelling was strongest, anchovies and krill formed dense swarms within upwelling plumes. Now, we’ve learned that blue whales track these dynamic plumes, where abundant food resources are available,” explained Ryan.
advertisement
Blue whales recognize when the wind is changing their habitat and identify places where upwelling aggregates their essential food — krill. For a massive animal weighing up to 150 tonnes (165 tons), finding these dense aggregations is a matter of survival.
While scientists have long recognized that blue whales seasonally occupy Monterey Bay during the upwelling season, this research has revealed that the whales closely track the upwelling process on a very fine scale of both space (kilometers) and time (days to weeks).
“Tracking many individual wild animals simultaneously is challenging in any ecosystem. This is especially difficult in the open ocean, which is often opaque to us as human observers,” said William Oestreich, previously a graduate student at Stanford University’s Hopkins Marine Station and now a postdoctoral fellow at MBARI. “Integration of technologies to measure these whales’ sounds enabled this important discovery about how groups of predators find food in a dynamic ocean. We’re excited about the future discoveries we can make by eavesdropping on blue whales and other noisy ocean animals.”
Background
Blue whales (Balaenoptera musculus) are the largest animals on Earth, but despite their large size, scientists still have many unanswered questions about their biology and ecology. These gentle giants seasonally gather in the Monterey Bay region to feed on small shrimp-like crustaceans called krill.
advertisement
Blue whales are elusive animals. They can travel large distances underwater very quickly, making them challenging to track. MBARI researchers and collaborators employed a novel technique for tracking blue whales — sound.
MBARI’s MARS (Monterey Accelerated Research System) observatory offers a platform for studying the ocean in new ways. Funded by the National Science Foundation, the cabled observatory provides continuous power and data connectivity to support a variety of instruments for scientific experiments.
In 2015, MBARI researchers installed a hydrophone, or underwater microphone, on the observatory. The trove of acoustic data from the hydrophone has provided important insights into the ocean soundscape, from the migratory and feeding behaviors of blue whales to the impact of noise from human activities.
In 2019, MBARI and the Naval Postgraduate School installed a second hydrophone on the observatory. The directional hydrophone gives the direction from which a sound originated. This information can reveal spatial patterns for sounds underwater, identifying where sounds came from. By tracking the blue whales’ B call — the most powerful and prevalent vocalization among the regional blue whale population — researchers could follow the movements of individual whales as they foraged within the region.
Researchers compared the directional hydrophone’s recordings to data logged by tags that scientists from Stanford University had previously deployed on blue whales. Validating this new acoustic tracking method opens new opportunities for simultaneously logging the movements of multiple whales. It may also enable animal-borne tag research by helping researchers find whales to tag. “The integrated suite of technologies demonstrated in this paper represents a transformative tool kit for interdisciplinary research and mesoscale ecosystem monitoring that can be deployed at scale throughout protected marine habitats. This is a game changer and brings both cetacean biology and biological oceanography to the next level,” said Jeremy Goldbogen, an associate professor at Stanford University’s Hopkins Marine Station and a coauthor of the study.
This new methodology has implications not only for understanding how whales interact with their environment and one another but also for advancing management and conservation.
Despite protections, blue whales remain endangered, primarily from the risk of collisions with ships. This study showed that blue whales in Monterey Bay National Marine Sanctuary regularly occupy habitat transected by shipping lanes. Acoustic tracking of whales may provide real-time information for resource managers to mitigate risk, for example, through vessel speed reduction or rerouting during critical periods. “These kinds of integrated tools could allow us to spatially and temporally monitor, and eventually even predict, ephemeral biological hotspots. This promises to be a watershed advancement in the adaptive management of risks for protected and endangered species,” said Brandon Southall, president and senior scientist for Southall Environmental Associates Inc. and a coauthor of the research study.
Support for this research was provided by the David and Lucile Packard Foundation. The National Science Foundation funded the installation and maintenance of the MARS cabled observatory through awards 0739828 and 1114794. Directional acoustic processing work was supported by the Office of Naval Research, Code 32. Tag work was funded in part by the National Science Foundation (IOS-1656676), the Office of Naval Research (N000141612477), and a Terman Fellowship from Stanford University.
#Environment
#10-2022 Science News#2022 Science News#acts of science#Earth Environment#earth science#Environment and Nature#everyday items#Nature Science#New#News Science Spies#October 2022 Science News#Our Nature#planetary science#production line#sci_evergreen1#Science#Science Channel#science documentary#Science News#Science Spies#Science Spies News#Space Physics & Nature#Space Science#Environment
36 notes
·
View notes
Text
Let’s talk about living shipwrecks!
Do you often wonder what lies on the ocean floor? Or where fish and other sea life live?

In a collaborative research project between the National Centers for Coastal Ocean Science and Monitor National Marine Sanctuary, scientists have worked to answer these questions and more using cutting edge technology to explore under the ocean’s surface. With our nation’s long tradition of honoring and protecting special places that have defined our history, this research serves to commemorate and honor the service members who fought and died off the North Carolina coast in defense of freedom.

Off the North Carolina coast lie scores of ships that sank during the Civil War, World War I, and World War II. Since 2008, Monitor National Marine Sanctuary and partners have studied and documented these historically significant shipwrecks that serve as quiet witnesses to the valor and sacrifices of generations past.

During World War II, the area off Cape Hatteras, North Carolina, emerged as a strategic hotspot for German U-boat activity (see GIF below).
This activity resulted in a collection of shipwrecks unparalleled in the United States consisting of 78 merchant ships, eight Allied warships, and four German U-boats.These shipwrecks serve as gravesites for nearly 1,700 individuals and as a memorial to this history, particularly to the sacrifice of the U.S. Merchant Marine.


Today, these shipwrecks not only represent our nation’s rich maritime history, but they serve as artificial habitat for a diversity of marine life and important fish species!
Pictured below, researchers with the National Centers for Coastal Ocean Science work to document how and when fish use these artificial structures. Understanding how fish communities use these habitats can help researchers ensure that the reef ecosystems remain sustainable in support of the blue economy.

To better understand how these shipwrecks function as artificial habitats, scientists collect data using visual and acoustic methods, including high-resolution seafloor habitat mapping and surveys using echosounders (split beam and multibeam), remotely operated vehicles, time-lapse video, and scientific diving.

Pictured above is a high resolution image of U-352, a German U-boat, and the fish living on it. Individual fish are displayed as orange circles and are detected by an instrument called a split beam echosounder. Pretty cool right?
Want to learn more? Read the full story here: https://sanctuaries.noaa.gov/news/nov20/living-shipwrecks.html
#Shipwrecks#LivingShipwrecks3D#Wrecks#WWII#VeteransDay#Veterans#Maritime#History#MarineLife#MaritimeHistory#Research#Science#U-Boats#ROV#NCCOS#Technology#Mapping
142 notes
·
View notes
Photo

What do marine mammals eat? It’s a simple question with profound implications for marine-mammal conservation and fisheries research. But it can be a tough question for scientists to answer because they can’t see what these animals are doing underwater.

MBARI researcher Kelly Benoit-Bird is finding new ways to answer this question using specialized echosounders mounted on ships and undersea robots. In a recent paper, Benoit-Bird demonstrated for the first time how researchers can simultaneously measure the distribution, abundance, type, size, and movement of both predators and their prey in the deep sea. Read more about the study on MBARI’s web page: https://www.mbari.org/rissos-dolphin-foraging/

9 notes
·
View notes
Photo

Why do Beaked Whales Keep Returning to a Navy Sonar Range?
MAREX - January 29, 2019
Scientists have determined that beaked whales prefer to feed within parts of a Navy sonar test range off Southern California that have dense patches of deep-sea squid and that these prey hotspots are needed to survive. Similar patches do not exist in nearby sonar-free areas.
For decades, the U.S. Navy has used high-powered sonar during anti-submarine training and testing exercises in various ocean habitats, including the San Nicolas Basin off Southern California. Beaked whales are particularly sensitive to these kinds of military sonars, which the researchers say have sometimes resulted in mass stranding events. Following legal action from environmental activists related to these risks, the Navy modified some training activities, created sonar-free areas, and spent more than a decade and tens of millions of dollars trying to find ways to reduce the harm to beaked whales and other mammals.
The new research, led by Brandon Southall at the University of California, Santa Cruz, and Kelly Benoit-Bird at the Monterey Bay Aquarium Research Institute, set out to better understand why whales keep returning to the test range despite the risks.
The researchers equipped an underwater robot with echosounders to measure the abundance, density, and sizes of deep-sea squids in different parts of the Navy test range, as well as in nearby waters. They also developed an “energy budget” for beaked whales, showcasing the costs in time and calories of hunting for squid. This helped the researchers estimate how many dives the whales needed to make in order to get enough food to survive in different areas.
“Beaked whales work very hard to obtain their food. They are essentially living paycheck to paycheck,” said Benoit-Bird. Unlike many baleen whales with significant energy reserves, beaked whales can’t afford to expend too much energy on a dive that doesn’t result in capturing many squid. In areas where the concentration of prey is low, the beaked whales must work harder and expend more calories, making reproduction and raising young that much more challenging. Some of the areas under study were so poor in terms of prey that whales likely could not meet their basic energetic requirements if they only fed there.
A portion of the Navy test range off Southern California encompasses one of these hot spots. Squid were 10 times more abundant in the area preferred by the whales. In this preferred area, the whales could get enough food by making just one dive a day. In a nearby sonar-free area (established with the idea that beaked whales could shelter in these areas while the sonar tests were underway) the whales would need to make between 22 and 100 dives per day to get enough food - something that would be difficult or impossible to do.
This study is the first to link habitat quality with beaked whale behavior in such fine spatial scales. It also demonstrates that scientists can’t assess the quality of deep-sea habitats by simply making measurements at the ocean surface, or even by measuring the physical and chemical properties of the deep ocean. Direct measurements of the prey environment at the depths where animals are feeding, coupled with observations of when and where animals are foraging, are critical.
Until now, collecting such detailed data, even over small time and space scales, was virtually impossible. The researchers are now working on tools that will help them study predators and prey over longer time periods, and in other areas where the Navy operates high-powered sonar.
Similar field-research and modeling techniques could also be used to assess the potential impacts of other human activities that may disturb ocean animals, such as shipping traffic or offshore oil and gas development.
27 notes
·
View notes
Text
Antarctica: Southern Ocean floor mapped in greatest ever detail
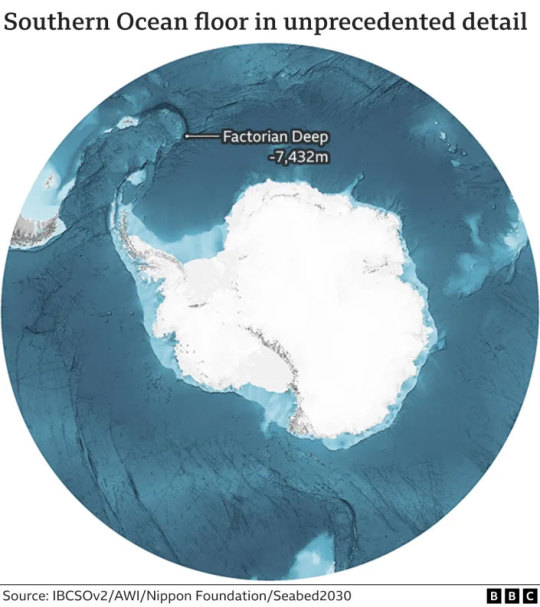
Scientists have made the most precise map yet of the mountains, canyons and plains that make up the floor of Antarctica's encircling Southern Ocean.
Covering 48 million sq km (18.5 million sq miles), this chart for the first time details a new deepest point - a depression lying 7,432m (24,383ft) down called the Factorian Deep.
Knowledge of the shape of the ocean's bottom is essential to safe navigation, marine conservation, and understanding Earth's climate and geological history.
But we still have much to learn.
Vast tracts of terrain have never been properly surveyed.
The International Bathymetric Chart of the Southern Ocean (IBCSO) has taken five years to compile and updates the first attempt at a comprehensive map, which was published in 2013.
The IBCSO project and others like it around the world are gradually filling in the gaps in our scant knowledge of the bottom of the world's oceans.
Ships and boats are being encouraged to routinely turn on their sonar devices to get depth (bathymetric) measurements; and governments, corporations, and institutions are being urged not to hide away data and put as much as possible into the public domain. This is paying dividends.
The new map covers all the Southern Ocean floor poleward of 50 degrees South. If you divide its 48 million sq km into 500m grid squares, 23% of these cells now have at least one modern depth measurement.
That's a big improvement on nine years ago.
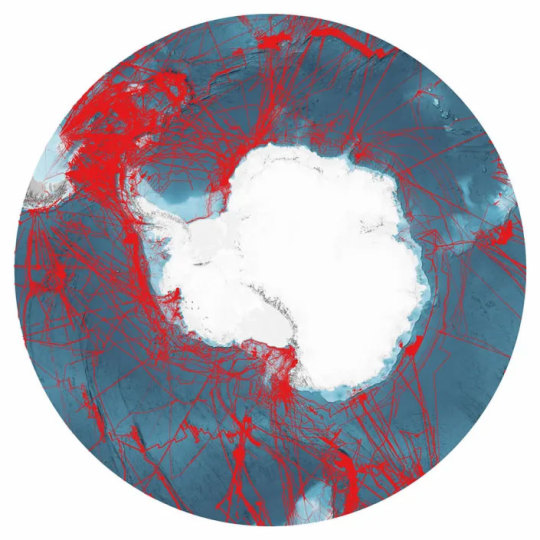
Back then, IBCSO began only at 60 degrees South, and less than 17% of its grid boxes had a modern measurement.
"You have to realise just what the change from 60 degrees to 50 degrees means; we've more than doubled the area of the chart," said Dr Boris Dorschel from Germany's Alfred Wegener Institute.
"So, we've increased the area coverage, but we've also increased the data density, because, in parallel, we've kept on acquiring new data and knocking on doors to free up existing data," he told BBC News.
Much of the information in the chart comes from the ice-strengthened ships that support scientific endeavours in Antarctica, including from the UK's former polar ship, the RRS James Clark Ross. (In future, this British contribution will come from its successor, the RRS Sir David Attenborough, affectionately known as Boaty McBoatface.)
As these vessels shuttle back and forth between the White Continent and the likes of Chile, South Africa and Tasmania - their echosounders make a habit of surveying the submerged terrain below.
And this activity is increasingly coordinated, with research organisations from different nations working together to try to offset slightly the routes taken by their icebreakers.
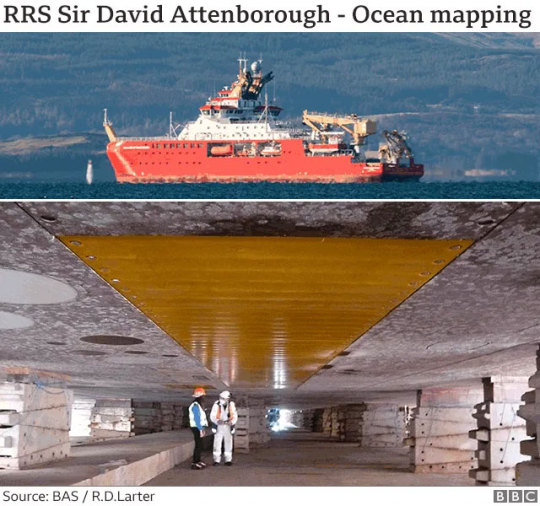
The UK's new polar ship, the RRS Sir David Attenborough, is equipped to map millions of sq km of ocean bottom over its career. The above image shows the ship's hull in dry dock. The yellow rectangle in the centre is a cover made of a synthetic material over the 8m-long array of transmitting transducers for the deep-water multibeam echosounding system.
Better seafloor maps are needed for a host of reasons.
They are essential for safe navigation, obviously, but also for fisheries management and conservation, because it is around the underwater mountains that marine wildlife tends to congregate. Each seamount is a biodiversity hotspot.
In addition, the rugged seafloor influences the behaviour of ocean currents and the vertical mixing of water. This is information required to improve the models that forecast future climate change - because it is the oceans that play a pivotal role in moving heat around the planet.
"We can also study how the Antarctic Ice Sheet has changed over thousands of years just by looking at the seafloor," explained Dr Rob Larter from the British Antarctic Survey.
"There's a record of where the ice flowed and where its grounded zones (places in contact with the seafloor) extended. This is beautifully preserved in the shape of the seafloor."
The new map was made possible by financing from Japan's Nippon Foundation and the support from Seabed2030, the international effort to properly chart Earth's ocean floor by the end of the decade.
Visit shopping bag printing homepage for more details.
At the moment, our knowledge of four-fifths of the planet's underwater terrain comes only from low-resolution satellite measurements that have inferred the presence of tall seamounts and deep valleys from the gravitational influence these features have on the sea surface. Water piles up over the mass of a large submarine mountain and dips slightly where there is a trench.
One key finding in the years between the first and second versions of IBCSO is the recognition of the Southern Ocean's deepest point. It's a depression called Factorian Deep at the far southern end of the South Sandwich Trench. It lies 7,432m down. It was measured and visited by the Texan adventurer Victor Vescovo in his submarine Limiting Factor in 2019.
The remote and often inhospitable nature of the Southern Ocean means substantial sections of it are unlikely to get mapped unless there is dedicated undertaking. There's high hope that an emerging class of robotic vessels could be given this task in the years ahead.
1 note
·
View note
Text
INS Sutlej, the sixth of Sandhayak class survey ship, was commissioned into the #IndianNavy on 19 February 1993 by the then Governor of Sikkim, Admiral RH Tahiliani. The name ‘Sutlej’ has a Vedic origin coined from the word ‘Satadru’ meaning confluence of a hundred rivers. The ship’s compliment comprises 19 officers and 180 sailors who relentlessly exhibit professionalism and ensure commitment to every task in keeping with ship’s motto ‘Excellence is a Tradition’. The primary role of the ship is hydrographic survey for which it is fitted with advanced Hydrographic Survey equipment like #Multibeam #Echosounder, Conductivity temperature depth probe, Side scan #sonar, single beam echo sounder and four survey motor boats fitted with state-of-the-art survey equipment. Some of the landmark survey operations undertaken by the ship include Survey at Oman, Indonesia, Galle Harbour (Sri Lanka) post Tsunami, Makaoni Harbour (Tanzania), Colombo Harbour (Sri Lanka) and Indo Myanmar Joint Hydrographic Survey off Myeik. The ship holds the distinction of being awarded Unit Citation twice in the year 2005 and 2014. The ship has also won Best Survey Ship award (Admiral Jal Cursetji Trophy) five times in the years 1995, 2009, 2010, 2016 and 2019. #ltcdrpravinsuryaask
https://www.instagram.com/tv/CaJmMP2I6PV/?utm_medium=share_sheet
0 notes
Text
Listening for History: Exploring Thunder Bay National Marine Sanctuary with Sound
How do you find a shipwreck in a 23,000-square-mile lake? For researchers, it can be like finding a needle in a haystack.
This spring, researchers in Thunder Bay National Marine Sanctuary undertook the second phase of a research expedition to find lost shipwrecks within sanctuary waters in Lake Huron. From May 15 through 26, they used acoustics to explore deep water areas off Presque Isle.
University of Delaware researchers monitor incoming survey data from R/V Laurentian's science lab. Photo: NOAA
Unlike on land, where features can be documented with aerial imagery or satellites equipped with cameras, visual survey isn’t practical underwater. In some cases the water is too murky, or turbid, to take photographs. At deeper depths there simply isn’t any ambient light. A camera, therefore, would only see darkness unless an array of lights was lowered down with it to illuminate the area.
Sound, however, is astonishingly efficient underwater. The density of water, both freshwater and saltwater, allows sound waves to travel great distances. When these waves encounter an object, they bounce off and in some cases reflect back in the direction of their original travel. In fact, by knowing the speed of sound through water, researchers can calculate how far away an object is. If the object being mapped is the lake floor, in this case the bottom of Lake Huron, the distance to the bottom, or water depth, can be determined by the time delay between a sound wave emitted at the surface and its travel to the lake floor and return back to the source at the surface.
The behavior of sound in water is so reliable that hydrographers can make detailed maps of the seafloor, accurate to within inches. Archaeologists can also use this technology to locate undiscovered shipwrecks. Where the lake bottom is flat and even, a historical shipwreck will appear as a large “anomaly” in the sonar data, a feature that sits upright off the bottom in stark contrast to the surrounding natural features. Once located, researchers can return with additional tools, such as underwater robots or divers, to further document a potential discovery.

University of Delaware sonar technicians Kenny Haulsee and Peter Barron route cables from the echosounder (yellow device in foreground) along a pole mount used to lower and secure the echosounder along the side of the vessel. The team installed and tested the entire sonar system while dockside to ensure proper operation before getting underway within the survey area. Photo: NOAA
Using sound to reveal lost shipwrecks
When researchers are first characterizing the lakebed or seafloor, we use a sonar system that can see a wide strip of the bottom at once. By running a pre-planned grid of overlapping passes -- a technique referred to as “mowing the lawn” for the pattern it creates -- researchers end up with a complete map of a given area. However, this wide-scanning sonar results in a less detailed image, or lower-resolution one, than a more focused sonar would reveal.
As a result, a dual-phase approach is often needed. That’s where the multiple phases of the Thunder Bay shipwreck expedition come in. In Phase II, completed in May, researchers used a wide-reaching sonar to scan large portions of the lake floor. By surveying large areas as quickly as possible, previously unexplored areas can be covered and new discoveries made.
Once surveyed, archaeologists will examine the data and tag anomalies against the surrounding lake floor. These may turn out to be lost shipwrecks. Then, in June’s Phase III, researchers will return to those targets with more detailed documentation methods.

University of Delaware sonar technician Peter Barron prepares to lower a device that will measure the speed of sound throughout the entire water column. These sound velocity profiles were collected once every four hours during the entire survey. Photo: NOAA
Presque Isle: The intersection of a maritime highway
The waters off Presque Isle in central Lake Huron form a sort of crossroads for the area’s shipping lanes. The lanes for vessels traveling up and down the lakes, whether to and from the Straits of Mackinaw or the Soo Locks, all converge within about 10 miles of the Presque Isle lighthouse. Within this area, many ships have collided and sunk during periods of bad weather or limited visibility. Dozens of known shipwrecks are spread across the lake floor off Presque Isle, and many more have yet to be found.

Many ships have met their end off the shores of Presque Isle in Lake Huron. Photo: David J. Ruck/NOAA
For this reason, researchers from Thunder Bay National Marine Sanctuary selected a large, 100 square mile area off Presque Isle for a wide-area exploratory survey. Partnering with the University of Delaware and using a research vessel from the NOAA’s Great Lakes Environmental Research Lab (GLERL), they conducted a two-week survey mission in May to search for undiscovered shipwrecks.
With a six-person survey crew, the mission involved 24-hour continuous operations for six days. Breaking into two-person watches, members of the team would spend four hours running the survey gear, followed by eight hours off, then another four hours on within a given 24-hour time period. That way, a team of researchers was constantly operating the sonar. The teams logged and organized data files, selected and managed survey scan lines, and communicated with the research vessel’s crew regarding navigation, survey speed, and general movement throughout the survey area.

A preliminary side scan sonar mosaic composed of 24 individual survey lines. Across the lake’s bottom, numerous features can be seen, including geological formations and variable bottom types. Image: University of Delaware.
As sonar data was logged, researchers also took additional measurements of the speed of sound through water. Approximately every four hours, a device was sent to the bottom of the lake. As it traveled, it measured the speed of sound and produced a sound velocity profile. By accurately measuring how fast sound was moving through the water, the researchers could accurately determine the distance to the bottom.
As six days passed, over 400GB of sonar data was logged and 100 square miles of area were covered. Now, researchers have to process all of the data and review it for anomalous objects that may turn out to be new shipwreck discoveries. During Phase III operations, these targets will be investigated with high-resolution sonar onboard an autonomous underwater vehicle operated by Michigan Technological University. Stay tuned for a recap of that leg of the expedition in a few weeks!
#science#archaeology#acoustics#stem#great lakes#shipwreck#history#maritime archaeology#exploration#lake huron#Thunder Bay National Marine Sanctuary#noaa
275 notes
·
View notes
Text
Acoustic Systems (Split Beam Echo Sounder) to Determine Abundance of Fish in Marine Fisheries- Juniper publishers
Abstract
Acoustic waves are transmitted into the subsurface ocean will experience (scattering) caused by marine organisms, material distributed in the ocean, the structure is not homogeneous in seawater, as well as reflections from the surface and the seabed. Estimation of fish stocks in the waters wide as in Indonesia have a lot of them are using the acoustic method. Acoustic method has high speed in predicting the size of fish stocks so as to allow acquiring data in real time, accurate and high speed so as to contribute fairly high for the provision of data and information of fishery resources. Split beam echo sounder comprises two aspects, and a transducer. First aspect is the high-resolution color display for displaying echogram at some observations and also serves as a controller in the operation of the echo sounder. The second aspect is tranciever consisting of transmitter and receiver. Echosunder divided bim first inserted into the ES 3800 by SIMRAD beginning of the 1980s and in 1985 was introduced to fishermen in Japan as a tool for catching up. Split beam transducer is divided into four quadrants. Factors that contribute affect the value of Target Strength (TS) fish Strength targer can generally be influenced by three factors: a target factor itself, environmental factors, and factors acoustic instrument. Factors include the size of the target, the anatomy of fish, swim bladder, the behavior of orientation
Keywords: Acoustic systems; Estimation of fish stocks; Split beam echo sounder; SIMRAD; Target strength
Go to
Introduction
Acoustic waves are transmitted into the subsurface ocean will experience (scattering) caused by marine organisms, material distributed in the ocean, the structure is not homogeneous in seawater, as well as reflections from the surface and the seabed. Part of the initial acoustic energy on an object and is reflected back to the source called backscattering [1]. According in [2], a good fisheries resource management must control the number of catches in conjunction with the number of stocks that can be exploited. It required an estimate of the number of fish stocks at the time and acoustic survey techniques can be used to estimate the abundance of fish at a time and under certain conditions. The use of echosounder and echo integrator for the purposes of exploration of fishery resources today are growing rapidly.
Hardware echo integrator aims to get the echo signal integration. The accouracy of this method is very high so it can be applied as estimate the abundance of fish in the waters [2]. According in [3], hydroacoustic method with detection backscatter value of mangrove crab (scylla sp.) using cruzpro fishfinder pcff-80 hydroacoustic instrument. According in [4,5] hydroacoustic method is an underwater detection methods that use acoustic devices, among others: echosounder, fish finder, sonar, and Acoustic Doppler Current Profiler (ADCP) (Figure 1).
According in MacLennan [6], a good fisheries resource management must control the number of catches in conjunction with the number of stocks that can be exploited. It required an estimate of the number of fish stocks at the time and acoustic survey techniques can be used to estimate the abundance of fish at a time and under certain conditions.
The use of echosounder and echo integrator for the purposes of exploration of fishery resources today are growing rapidly. Hardware echo integrator aims to get the echo signal integration. The accuracy of this method is very high so it can be applied as an estimate abundance of fish in the waters [2].
Estimation of fish stocks in the waters wide as in Indonesia have a lot of them are using the acoustic method. Acoustic method has high speed in predicting the size of fish stocks so as to allow acquiring data in real time, accurate and high speed so as to contribute fairly high for the provision of data and information of fishery resources [6].
The second aspect is tranciever consisting of transmitter and receiver. Echosunder divided bim first inserted into the ES 3800 by SIMRAD beginning of the 1980s and in 1985 was introduced to fishermen in Japan as a tool for catching up. Split beam transducer is divided into four quadrants [7-9], in which the transmitting wave conducted by the merger of four full beam. The signal reflected by the target is received by each quadrant and reassembled to form a full beam. Gilihat of direction on the ship split beam is divided into four i.e Fore, Aft, Port and Starboard. While in principle Split Beam is divided into four quadrants that FP.FS.AP and AS ( Figure 2-4).
Split beam echo sounder has the function of Time Varied Gain (TVG) in acoustic data acquisition system serves as a reliever TVG attenuation (Amplifier) whether caused by geometrical spreading and absorbs noise as it propagates into the water. There are two types of functions, namely TVG TVG function that works to echo a single fish called TVG 40 log R and a function for a group of fish that TVG 20 log R (Figure 5 & 6).
In (Figure 6) by Simrad, fish axis A located right above the maximum transducer gain, while fish B is located at the end (edge) transducer beam where the gain is lower. A fish echo thus more likely to result stronger than the backscatter echo in fish B. Although both of these fish are at the same depth and the same size. To determine the size of the fish from the echo strength alone is not enough, however, knowledge about the pattern beam transducer and the fish in the beam position is very important to correct transducer gain strength and determining the target value of real fish (Figure 7 &8).
An estimate obtained approximate angle of incidence and factors beam pattern in the acoustic signals can be obtained by using a processor of the split beam which has a signal source X leads to Phase detection and will produce energy or power by means of calculating the results of input and will generate output waveform display in Figure 8 (Table 1).
Go to
Target Strength
Target strength (TS) is the ability of the target to reflect a sound about it. Based domain is used, the target strength is defined into two, namely in the form of Target StrengthIntensity (TSi) and Energy Target Strength (TSE). Targeth strength (TS) can be defined as the quotient between the value of the intensity of the noise coming about the target and multiplied by the number of ten (10) in [10-12] is:
TSi =10 log Ir/Ii (1)
TSe =10 log Er/Ei (2)
Information:f
TSi: Intensity target of strength
Ii: Intensity of sound on targets
Ir: Reflected sound intensity targets
TSE: Energy Target Strength
Ei: Energy sound on targets
Er: Energy reflection sound at a distance of 1 meter from the target
According in [12] stated that the target strength (TS) is a measure decibel sound that is returned by the target as measured on a standard distance of 1 meter from the acoustic center of the target is located, relative to the intensity of sound that hit the target. A simple model to estimate the back scattering cross section based on the size of fish referred by [6]:
σbs= b0 L2(3)
TS = 20 Log L+ b0(4)
Then, according in [13] introduced the equation which connects the backscattering cross section (σ_bs), fish length (L) and wavelength (λ) by the following equation: σ_bs / λ^2 = a⟦(L/ λ) ⟧^b (dB) where a and b are constants that depend on the anatomy, fish size and wavelength. Equation (4) can be converted into a logarithmic form becomes:
TS = a Log(L) + b Log (f) + b0(5)
Information:
TS = Target strength (TS)
F = Sound frequency
A, b = Constant
Then obtained the possibility of the average best performing measurements on the measurement of the target strength of the dorsal aspect:
TSD = 19,1 log (L) - 0,9 (f) - 62 (6)
But according in [11] explains more about the similarities that show no difference in the comparison of results of different frequencies. Furthermore, the equation [11] to formulate relationships TS (Target Strength) to the length of the fish, namely:
TS= 20 Log (L) - 68 (dB) (7)
Conversions strength target value into a length (L) for pelagic fish used equation TS = 20 log L-73.97 [14]. Relations targets strength and OBS (backscattering cross-section, m2) is calculated based in [6] with equation:
TS=10 log Óbs (8)
equation for densitas ikan (ñA, ind./⟦nmi⟧^2) is :
ñA=sA /Óbs (9)
fish length (L) associated with Óbsis:
Óbs=aLb (10)
associated of target strength and L is:
TS=20 log L+A (11)
Where:
A = the value of the target strength to 1 cm long fish (normalized target of strength)
Conversions strength target value into a length (L) for pelagic fish used equation: TS = 20 log L-73.97 [14]. According in [15], the relationship length (L) and weight (W) of a species of fish that is: (Figure 9)
W=aLb(12)
In addition [14] has a long and weighs equation to convert length into weight alleged allegations are as follows:
Information:
Wt: Total weight (g)
Al: Class interval length (cm)
Li: The midpoint of the long-the grade (cm)
Ni: Number of individuals in the grade
a, b: Constants for certain species
Factors that contribute affect the value of Target Strength (TS) fish Strength targer can generally be influenced by three factors: a target factor itself, environmental factors, and factors acoustic instrument. Factors include the size of the target, the anatomy of fish, swim bladder, the behavior of orientation [16]. Factors such targets are:
Size of fish
There is a relationship between the size of the fish with a value of TS, but the relationship varies greatly depending on the species. Generally for fish species, the larger the fish the greater its value TS. This is especially true for the region of the graph geometrical relationship between the size of the target and TS, for the region, resonance, resonance region and the transition region, the tendency of the relationship is not valid [12]. Anatomy such as the head, body, tail and fins have a different sound reflections. Likewise, stomach, intestine, liver, bones, flesh and gills have a specific gravity = (ρ) and the speed of sound = (c) different so acoustically will have the ability to reflect a different sound.
Swimbladder of fish
Acoustically fish and marine organisms are divided into two major groups, namely blader fish (have a swim bladder). Fish that have a swim bladder generally do not have the right meksimum TS on the dorsal aspect, while fish that do not have a swim bladder with a maximum value of TS is generally right on the dorsal aspect. TS value of fish that have a swim bladder [17,18]. With deformed-cylinder model (DCM) with Approximation of>5 and the value of Tilt Angle was not until (<40°) according to [19] results from the resultant corner of a fish that has swim bladder that is:
Behavior / orientation fish
Results of a previous study conducted by [20,21] states that the value of Target Strength (TS) is determined by the orientation of the fish, especially the slope of the body to a line connecting between the head and tail. Fish orientation will include tilting, yawing and rolling along. Yawing no effect because generally spherical transducer position so that the fish does not cause changes in the angle when viewed from the transducer, for Rolling no real effect because the fish have a swim bladder due partly reflected energy is derived from the swim bladder did not come from the dorsal aspect. Tillting lead to a change in angle position transducer is good for fish that have a swim bladder or not [8].
Instrumental factor
The small big factor value Beam pattern depending on the extent of the transducer will be greater the beam angle of the transducer, and vice versa. Large beam angle changes cause TS great value, separately it is better to use a relatively narrow beam.
Acoustic reflections of fish and plankton that are returned in the form of echo is detected by the receiver has an appeal. Estimation of biomass can be seen from how much force the target and how to interpret it. TS plankton are numbers that indicate the size of the echo. The larger the value, the greater echo energy is returned to the receiver by the target. Unit of measure Standard International (SI) for the TS expressed in decibels (dB). The decibel is a logarithmic form of a comparison or ratio of the two intensities due to the values involved can be very large or very small. According in [22] TS formulated as backscattering cross-section of the target which returns a signal and is expressed in the equation:
TS = 10 log ( σ / 4Π ) (14)
Then the value of TS theoretical spherical object is:
TS = 10 Log a2/4 (15)
Where σ = Target strength individual or backscattering cross-section (σ bs) with TS according in [22,23] with equation :
TS = 10 log σ bs (16)
Go to
Volume Backscattering Strength (SV)
Volume Backscattering Strength (SV) is defined as the ratio between the intensity reflected by a group of single targets (target located at a water volume of certain diinsonifikasi instantaneously measured at a distance of 1m from target with the intensity of sound that hit the target. Definition Volume Backscattering Strength (SV) has the same meaning as the target strength for a single target, while Volume Backscattering strength (SV) for a group of fish.
Each individual targets is the source of the reflected sound wave, so that the output of the integration will be proportional to the quantity of fish in the group. Echo integration methods used to measure Volume Backscattering Strength (SV) based on the measurement of the total power backscattered on the transducer [8].
Volume Backscattering Strength (SV) is the ratio between the intensity reflected by a single group targets where the target is located at a water volume [24]. This is similar to the definition of TS where TS value is the result of the detection of a single organism, while SV is the value for mendetaksi organism groups. [25] states SV is defined into the equation:
SV = 10 log (Is i/ I) (17)
Information:
Is: Intensity scattering volume measured 1m from the center of the acoustic waves.
Ii: Scattering intensity emitted
Go to
Fish Density (Abundance Fish)
To date research on fish stock estimates done by cruise track using a SIMRAD EK 60 Scientific split beam echosounder system with a frequency of 70kHz and acoustic data acquisition is performed continuously during the day and night during the period boat cruise at speeds ranging between 7-8 knots. Trails include a data acquisition area of an area that allows the analysis of spatially made with zig-zag shape according to [6,26,27] with the length of each transect approximately 1nmi of bounds islands outwards. Density values for fish processing performed on Ms. Excel. The treatment may be carried out after the integration process SV and TS. Density is generated by using the formula [28,29]:
SV (dB) = 10 log (N Tbs) = 10 log N + TS (18)
Assuming the numerical density is proportional to the density of individuals, then the equation (1) can be rewritten as follows:
SV (dB) = 10 log ρ + A (19)
Where:
SV: Volume strength (dB)
ρ: Abundance / density of organisms (in d/m3)
A: Target average strength (dB)
To Know More About Journal of Oceanography Please Click on: https://juniperpublishers.com/ofoaj/index.php
To Know More About Open Access Journals Publishers Please Click on: Juniper Publishers
0 notes
Text
Week 1: Up up up and Underway
Breezy Grenier on the USCGC Healy: Departing for the High ArcticAfter 23 hours of travel time turns into 32 hours and finally arriving in Dutch Harbor, the internship begins! The next day the science party arrived, and we are finally underway heading towards the waters around Point Barrow.
The flights to Dutch Harbor are always a hit or miss, but with 4 legs of flights, the flight to Dutch was the only flight NOT delayed. The previously flight delays, just happened to cause me to miss that flight, luckily there was a flight later in the day. It feels good to be back in Alaska. I cannot believe how much has changed over the past 12 years.

It is funny, after previously serving in the Coast Guard, you forget how small of a world it really is. Upon arriving I immediately ran into the Commanding Officer of the Healy, whom happened to be my previous CO when I served on the USCGC Hickory as a non-rate. I also ran into my old roommate from TranCen Petaluma and another whom was my A-School instructor. It's a large ship, with about 120 souls on board, so I can only imagine whom else I might run into. After a good nights sleep, I hopped right in, learning the ship and where everything was, and what my duties and responsibilities would be. I am working with STARC (Shipbased Technical Support in the Arctic) as a Tech Watch stander, and WHOI (Woods Hole Oceanographic Institute) is our science team aboard the Coast Guard Polar Ice Breaker Healy. We will be doing mooring work on the continental shelf of the Alaska Beaufort Sea, along with CTD work spanning the Chukchi and Canadian Beaufort Sea. Immediately getting to work I got to fabricate a bracket to hold an instrument, the scientist wanted to add to the CTD. Loving puzzles, I got quickly figured out how we would attach the instrument close enough to their other sensor, but far enough to not cause interference.

Photo Credit: Matt Hirsch The other issue was creating a structure strong enough where it would not cause vibrations. A saw, dremel, and some scrap metal did the job! We are deploying two test casts later today, fingers crossed the fabrication works out.

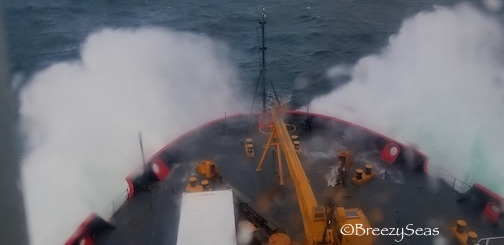
Once getting underway we booted up all the systems that would be running over the course of our voyage such as the multibeam, knudsen echosounder, EM122, ADCP, Hypack, QINSy, seawater flow through, pCO2, along with calibrating the instruments. Setting up, double, and triple checking the data flow, serial servers, and syncing the systems to ensure all the data is collected and it is being filed in an organized manor. Upon departing we had a good test to make sure all of our gear was secured for sea, heading straight into 6-8m seas. It looks like there is a high-pressure system on the horizon, so it’s forecasted to have smooth sailing as we go through the Bering Straight this weekend.
0 notes
Text
Due to COVID-19, NOAA Uses Drones Instead of Ships for Fishery Survey
Scientists are capitalizing on existing technological capabilities and partnerships to collect fisheries data. This will help fill the information gap resulting from the cancellation of FY20 ship-based surveys due to the COVID-19 pandemic. NOAA Fisheries plans to use autonomous surface vehicles to collect some critically needed data to support management of the nation’s largest commercial fishery for Alaska pollock.
“Extraordinary times require extraordinary measures,” said Alex De Robertis, NOAA Fisheries fisheries biologist and project lead for the Alaska Fisheries Science Center. “We knew there was a possibility that surveys may be cancelled this year, so we worked on a contingency plan to collect some data just in case. We were able to capitalize on our previous experience working closely with Saildrone and NOAA Research’s Pacific Marine Environmental Laboratory to get things off the ground quickly.”
This effort supports NOAA’s broader strategy to expand the use of emerging science and technologies, including unmanned systems.
“The Alaska Fisheries Science Center has been engaged in research and development efforts to test new technologies to both improve our operating efficiencies and enable us to quickly respond when situations like this arise,” said Robert Foy, Alaska Fisheries Science Center Director. “Providing the best available science to support management decisions is at the heart of our mission to ensure the health of marine ecosystems while supporting sustainable commercial and recreational fisheries and strong local economies.”

Alaska Pollock aggregation measured from a Saildrone in the eastern Bering Sea. Image credit: NOAA Fisheries
Measuring Fish Abundance Acoustically
Three saildrones, unmanned wind-powered surface vehicles, are en route. They are sailing autonomously, from Alameda, California on a six-week journey to the eastern Bering Sea. They are expected to reach Alaska in early July to begin a 60-day survey. The ocean-going robots will cover roughly the same area normally covered by standard research vessels to estimate pollock abundance.
Scientists and engineers integrated newly designed low-power sonar instruments, known as echosounders, into the saildrones. This fishfinder technology detects the presence of fish using sound. Echosounders send sound pulses into the water and measure how much of this energy echoes back from fish. From this, scientists are able to make an estimate of the population of fish below. Scientists from the Alaska Fisheries Science Center worked with Saildrone, the Pacific Marine Environmental Laboratory, and Kongsberg to develop this technology.
The technology is great at detecting fish. But, it is less effective at differentiating among species and fish sizes. That is why during standard acoustic-trawl surveys on research vessels, scientists also use a net to collect a sample of fish. From this, they are able to confirm the species, as well as the weight, length, and sex of individual fish.
Stock assessment scientists use these data together with other data collected from commercial fishing vessels to estimate fish population size each year.
De Robertis and colleagues have spent the past several years testing and validating this technology. They conducted side-by-side comparisons with a NOAA research vessel. They found that the saildrone-mounted echosounders produced equivalent acoustic measurements of pollock to NOAA’s fisheries survey vessels.
“In this part of the Bering Sea, pollock are by far the dominant midwater fish species. So, we are confident of getting a useful measure of pollock abundance from the echosounder, even if we can’t directly sample fish. Acoustic-only measurements from ships are already used to inform fisheries management, and we plan to do the same thing with the saildrones,” said De Robertis.
The saildrones are also equipped with solar-powered instruments to measure oceanographic and meteorological conditions. Wind, solar radiation, surface temperature, and salinity measurements will be made along the way.

Planned Saildrone survey transects. The colors indicate the tracks of different Saildrones. Image credit: NOAA Fisheries
Real-time Data to Inform Management Decisions
Throughout the survey, compressed summaries of the echosounder data and environmental conditions, and photos will be transmitted to shore via the saildrone’s satellite modem four times per hour.
With the real-time information, De Robertis and colleagues can monitor progress. Using the satellite link, they will be able to adjust the course of the saildrones, if necessary.
Scientists at the Pacific Marine Environmental Laboratory will process the oceanographic and meteorological data in real time.
“We will make data available to weather forecast centers worldwide via the World Meteorological Organization's Global Telecommunication System so that the observations can be incorporated into weather predictions,” said Eugene Burger, associate director for Information Technology, Pacific Marine Environmental Laboratory.
According to De Robertis what he once perceived as science fiction has become an operational reality. A lot of progress has been made in just a few short years using unmanned surface vehicles and associated technologies for studying the marine environment.
“If you had asked me six years ago, when I first heard about this, I wouldn’t have thought it possible. Now, I see it as a valuable tool for augmenting our standard research surveys.”
This is especially relevant this year. Unmanned vessel surveys are helping scientists provide some key scientific data at a time when it will be difficult to collect the data any other way.
This article appears courtesy of NOAA Fisheries and may be found in its original form here.
from Storage Containers https://www.maritime-executive.com/article/due-to-covid-19-noaa-uses-drones-instead-of-ships-for-fishery-survey via http://www.rssmix.com/
0 notes
Text
Due to COVID-19, NOAA Uses Drones Instead of Ships for Fishery Survey
Scientists are capitalizing on existing technological capabilities and partnerships to collect fisheries data. This will help fill the information gap resulting from the cancellation of FY20 ship-based surveys due to the COVID-19 pandemic. NOAA Fisheries plans to use autonomous surface vehicles to collect some critically needed data to support management of the nation’s largest commercial fishery for Alaska pollock.
“Extraordinary times require extraordinary measures,” said Alex De Robertis, NOAA Fisheries fisheries biologist and project lead for the Alaska Fisheries Science Center. “We knew there was a possibility that surveys may be cancelled this year, so we worked on a contingency plan to collect some data just in case. We were able to capitalize on our previous experience working closely with Saildrone and NOAA Research’s Pacific Marine Environmental Laboratory to get things off the ground quickly.”
This effort supports NOAA’s broader strategy to expand the use of emerging science and technologies, including unmanned systems.
“The Alaska Fisheries Science Center has been engaged in research and development efforts to test new technologies to both improve our operating efficiencies and enable us to quickly respond when situations like this arise,” said Robert Foy, Alaska Fisheries Science Center Director. “Providing the best available science to support management decisions is at the heart of our mission to ensure the health of marine ecosystems while supporting sustainable commercial and recreational fisheries and strong local economies.”

Alaska Pollock aggregation measured from a Saildrone in the eastern Bering Sea. Image credit: NOAA Fisheries
Measuring Fish Abundance Acoustically
Three saildrones, unmanned wind-powered surface vehicles, are en route. They are sailing autonomously, from Alameda, California on a six-week journey to the eastern Bering Sea. They are expected to reach Alaska in early July to begin a 60-day survey. The ocean-going robots will cover roughly the same area normally covered by standard research vessels to estimate pollock abundance.
Scientists and engineers integrated newly designed low-power sonar instruments, known as echosounders, into the saildrones. This fishfinder technology detects the presence of fish using sound. Echosounders send sound pulses into the water and measure how much of this energy echoes back from fish. From this, scientists are able to make an estimate of the population of fish below. Scientists from the Alaska Fisheries Science Center worked with Saildrone, the Pacific Marine Environmental Laboratory, and Kongsberg to develop this technology.
The technology is great at detecting fish. But, it is less effective at differentiating among species and fish sizes. That is why during standard acoustic-trawl surveys on research vessels, scientists also use a net to collect a sample of fish. From this, they are able to confirm the species, as well as the weight, length, and sex of individual fish.
Stock assessment scientists use these data together with other data collected from commercial fishing vessels to estimate fish population size each year.
De Robertis and colleagues have spent the past several years testing and validating this technology. They conducted side-by-side comparisons with a NOAA research vessel. They found that the saildrone-mounted echosounders produced equivalent acoustic measurements of pollock to NOAA’s fisheries survey vessels.
“In this part of the Bering Sea, pollock are by far the dominant midwater fish species. So, we are confident of getting a useful measure of pollock abundance from the echosounder, even if we can’t directly sample fish. Acoustic-only measurements from ships are already used to inform fisheries management, and we plan to do the same thing with the saildrones,” said De Robertis.
The saildrones are also equipped with solar-powered instruments to measure oceanographic and meteorological conditions. Wind, solar radiation, surface temperature, and salinity measurements will be made along the way.

Planned Saildrone survey transects. The colors indicate the tracks of different Saildrones. Image credit: NOAA Fisheries
Real-time Data to Inform Management Decisions
Throughout the survey, compressed summaries of the echosounder data and environmental conditions, and photos will be transmitted to shore via the saildrone’s satellite modem four times per hour.
With the real-time information, De Robertis and colleagues can monitor progress. Using the satellite link, they will be able to adjust the course of the saildrones, if necessary.
Scientists at the Pacific Marine Environmental Laboratory will process the oceanographic and meteorological data in real time.
“We will make data available to weather forecast centers worldwide via the World Meteorological Organization's Global Telecommunication System so that the observations can be incorporated into weather predictions,” said Eugene Burger, associate director for Information Technology, Pacific Marine Environmental Laboratory.
According to De Robertis what he once perceived as science fiction has become an operational reality. A lot of progress has been made in just a few short years using unmanned surface vehicles and associated technologies for studying the marine environment.
“If you had asked me six years ago, when I first heard about this, I wouldn’t have thought it possible. Now, I see it as a valuable tool for augmenting our standard research surveys.”
This is especially relevant this year. Unmanned vessel surveys are helping scientists provide some key scientific data at a time when it will be difficult to collect the data any other way.
This article appears courtesy of NOAA Fisheries and may be found in its original form here.
from Storage Containers https://maritime-executive.com/article/due-to-covid-19-noaa-uses-drones-instead-of-ships-for-fishery-survey via http://www.rssmix.com/
0 notes
Text
Due to COVID-19, NOAA Uses Drones Instead of Ships for Fishery Survey
Scientists are capitalizing on existing technological capabilities and partnerships to collect fisheries data. This will help fill the information gap resulting from the cancellation of FY20 ship-based surveys due to the COVID-19 pandemic. NOAA Fisheries plans to use autonomous surface vehicles to collect some critically needed data to support management of the nation’s largest commercial fishery for Alaska pollock.
“Extraordinary times require extraordinary measures,” said Alex De Robertis, NOAA Fisheries fisheries biologist and project lead for the Alaska Fisheries Science Center. “We knew there was a possibility that surveys may be cancelled this year, so we worked on a contingency plan to collect some data just in case. We were able to capitalize on our previous experience working closely with Saildrone and NOAA Research’s Pacific Marine Environmental Laboratory to get things off the ground quickly.”
This effort supports NOAA’s broader strategy to expand the use of emerging science and technologies, including unmanned systems.
“The Alaska Fisheries Science Center has been engaged in research and development efforts to test new technologies to both improve our operating efficiencies and enable us to quickly respond when situations like this arise,” said Robert Foy, Alaska Fisheries Science Center Director. “Providing the best available science to support management decisions is at the heart of our mission to ensure the health of marine ecosystems while supporting sustainable commercial and recreational fisheries and strong local economies.”

Alaska Pollock aggregation measured from a Saildrone in the eastern Bering Sea. Image credit: NOAA Fisheries
Measuring Fish Abundance Acoustically
Three saildrones, unmanned wind-powered surface vehicles, are en route. They are sailing autonomously, from Alameda, California on a six-week journey to the eastern Bering Sea. They are expected to reach Alaska in early July to begin a 60-day survey. The ocean-going robots will cover roughly the same area normally covered by standard research vessels to estimate pollock abundance.
Scientists and engineers integrated newly designed low-power sonar instruments, known as echosounders, into the saildrones. This fishfinder technology detects the presence of fish using sound. Echosounders send sound pulses into the water and measure how much of this energy echoes back from fish. From this, scientists are able to make an estimate of the population of fish below. Scientists from the Alaska Fisheries Science Center worked with Saildrone, the Pacific Marine Environmental Laboratory, and Kongsberg to develop this technology.
The technology is great at detecting fish. But, it is less effective at differentiating among species and fish sizes. That is why during standard acoustic-trawl surveys on research vessels, scientists also use a net to collect a sample of fish. From this, they are able to confirm the species, as well as the weight, length, and sex of individual fish.
Stock assessment scientists use these data together with other data collected from commercial fishing vessels to estimate fish population size each year.
De Robertis and colleagues have spent the past several years testing and validating this technology. They conducted side-by-side comparisons with a NOAA research vessel. They found that the saildrone-mounted echosounders produced equivalent acoustic measurements of pollock to NOAA’s fisheries survey vessels.
“In this part of the Bering Sea, pollock are by far the dominant midwater fish species. So, we are confident of getting a useful measure of pollock abundance from the echosounder, even if we can’t directly sample fish. Acoustic-only measurements from ships are already used to inform fisheries management, and we plan to do the same thing with the saildrones,” said De Robertis.
The saildrones are also equipped with solar-powered instruments to measure oceanographic and meteorological conditions. Wind, solar radiation, surface temperature, and salinity measurements will be made along the way.

Planned Saildrone survey transects. The colors indicate the tracks of different Saildrones. Image credit: NOAA Fisheries
Real-time Data to Inform Management Decisions
Throughout the survey, compressed summaries of the echosounder data and environmental conditions, and photos will be transmitted to shore via the saildrone’s satellite modem four times per hour.
With the real-time information, De Robertis and colleagues can monitor progress. Using the satellite link, they will be able to adjust the course of the saildrones, if necessary.
Scientists at the Pacific Marine Environmental Laboratory will process the oceanographic and meteorological data in real time.
“We will make data available to weather forecast centers worldwide via the World Meteorological Organization's Global Telecommunication System so that the observations can be incorporated into weather predictions,” said Eugene Burger, associate director for Information Technology, Pacific Marine Environmental Laboratory.
According to De Robertis what he once perceived as science fiction has become an operational reality. A lot of progress has been made in just a few short years using unmanned surface vehicles and associated technologies for studying the marine environment.
“If you had asked me six years ago, when I first heard about this, I wouldn’t have thought it possible. Now, I see it as a valuable tool for augmenting our standard research surveys.”
This is especially relevant this year. Unmanned vessel surveys are helping scientists provide some key scientific data at a time when it will be difficult to collect the data any other way.
This article appears courtesy of NOAA Fisheries and may be found in its original form here.
from Storage Containers https://www.maritime-executive.com/article/due-to-covid-19-noaa-uses-drones-instead-of-ships-for-fishery-survey via http://www.rssmix.com/
0 notes
Text
A Guide to Hydrographic Surveys
Earth’s water bodies cover over 70% of the planet. Along with building ships that travel over the surface of the oceans, it is important to learn about the seabed and sub-surface topography. This is achieved by conducting underwater studies known as Hydrographic Surveys.
In this article, we will look at hydrographic surveys, the different types of surveys, and the various equipment used.
Introduction to Surveying
Also known as underwater surveying, hydrography is the science of determining the features of an underwater area. The features to be studied include the water depth, topographic features, tide measurement etc. Simply put, being able to understand the contortions and elevations of the ocean floor has many practical uses.
An important type of hydrographic surveys is the bathymetric survey, which originates from the Greek terms bathus (deep) and metron (measurement). This is the underwater equivalent to a land survey operation known as hypsometry.
Unlike land surveys that use static or stationary equipment to conduct measurements, bathymetry involves a dynamic ship that is moving while carrying out observations. Thus, special allowances have to be made for any error that arises out of this motion. This type of surveying is covered in the next section.
The primary purpose of hydrographic surveying is in water depth estimation, which is achieved by bathymetric surveys. Some of the other most common uses of hydrographic surveying include waterway planning, dredging analysis, and wreck location.
Another application of surveying is in the construction and planning for docks, harbours, and dams. It is important to ensure that the water depth in and around ports are sufficient to allow for ships to safely enter and berth. Also, the portion of the seabed that supports floating structures must have a strong foundation. Dams also require adequate knowledge of the surrounding terrain to ensure structural strength.
Credits: Tomasz Sienicki/wikipedia.org
Surveying allows engineers to plan land reclamation activities. By revealing data on the seabed composition and topography, sites to carry out reclamation can be selected. In addition, engineers can determine the feasibility of projects in the planning phase itself. Surveying also aids in flood control systems, by predicting possible flooding zones and suggesting measures to effectively counter this. Flooding zones can be predicted by studying how the ocean floor changes around the coastline and by correlating this structure with any historic records of flooding or tsunamis.
Another application of underwater surveying is in determining shorelines that extend around a coast. Preparing shore line charts are useful in conducting studies on the effect of water bodies on land, and for determining the actual maritime border of countries. Surveying also determines the mean sea level that plays a very important role in almost every sphere of life. From aiding the government in charting coastlines, they also affect the launch of space shuttles and rockets.
Surveying also helps in ship navigation, by providing possible paths that a vessel can take. Certain ocean routes may lie at low depths or may have rocks and coral deposits. This poses a major danger to ships and hence needs to be recorded properly. By charting safe routes that do not cross any dangerous terrain, surveying helps the shipping industry. Surveying also has agricultural uses, by determining alluvial and silt deposits near water bodies. As deltas have incredibly fertile lands, such areas can be specifically allotted for farming activities. Also, by studying river discharge, erosion and its effects on arable land can be studied.
One of the most important purposes of hydrography is in the field of dredging. Dredging is defined as the removal of weeds, mud, and rocks at the seabed. This can be for creating inland waterways to promote the shipping industry. By creating sufficient depth in rivers, small ships can be used to supplement domestic trade. Dredging may also be carried out to change drainage patterns that affect irrigation, erosion etc. Underwater surveying collects information that is often the basis for approving capital projects. Surveying also aids in the offshore industry by allowing for remote maintenance checks on oil and gas structures. Hydrographic surveys can replace manual checks, by estimating wear and tear on the structure. Similarly, when laying seabed pipelines, surveying ensures that pipe tracks are constructed correctly.
Bathymetric Surveys
In this section, we will analyze bathymetry and its primary output- bathymetric charts. Bathymetric charts produce contour lines to show relative terrain relief. These contours are also known as isobaths, indicating relief using colour gradients.
The earliest technique to measuring ocean depth involved lowering a weighted cable until it made contact with the seabed. However, this is time-intensive in addition to being inaccurate. Thus, the present technique is to use depth sounding which uses sound waves. Bathymetric maps are produced by analyzing data from echo sounders located on research vessels. A beam of sound is pinged towards the seabed through a transducer, while a receiver is used to analyze the reflected beam. By measuring the time taken to bounce back, and accounting for appropriate corrections, the depth of the bed at that particular point can be measured. Modern echo sounders use multiple beams closely packed within an angle of 90⁰ to 170⁰. This results in high-resolution charts and also reduces the time taken to map a certain area.
Satellites can also be used to generate bathymetric plots, although it is a complex process. The method involves analyzing sea-level fluctuations caused by undersea terrains such as mountains and ridges. The sea level is higher over terrain changes such as mountains and ridges, as compared to trenches and plains.
Types of Surveys
There are five main types of hydrographic surveys, although other subsets of these surveys are also used.
General hydrographic surveys refer to studies of the water depth, mean sea level, determination of coastlines, and bathymetric plots. They are the most common type of survey. These surveys have applications in science and geological studies.
Harbor and port surveys are conducted to determine the ideal locations to build these structures. Undertaken by national governments, they analyze the best possible places that do not have draft restrictions on vessels. For instance, some lagoons may be surrounded by corals that prevent ships from approaching the mainland. These factors must be taken care of prior to constructing a port. Additionally, the underwater supports on which the pier floats must also be solidly supported. Loose mud or silt may tend to rock this foundation over time, and dredging may be required.
Passage surveys are used to determine the condition of inland waterways, with the aim of turning them into passages for ships to ply through. Undertaken to increase productivity and trade, this survey looks at analyzing mean draft, the width of the passage, and the restrictions that must be imposed on the size of the vessels. Additionally, passage surveys study the feasibility of creating straits, similar to the Panama or Suez Canal.
Coastal surveys are undertaken to study the coastline of a country and document the flora and fauna living near it. This survey is usually undertaken within the maritime boundaries of the nation extending up to 200 nautical miles beyond the coast. They also aid in studying possible land reclamation project.
Wreckage surveys are conducted to study the position of wreckage. It can be conducted as part of an investigative effort to determine the probable cause for the vessel to sink, or maybe a part of the salvage process. Vessels sink due to flooding that occurs through the hull. It is viable to have experienced hydrographers analyze the site of the wreckage. They can provide insight into the structural damage and possible reasons for flooding. During salvage operations, it is important to ensure that no damage occurs to both the vessel and the surrounding areas. Thus, by running tests on the regions on which the wreck sits, a viable method of salvaging can be chosen.
Equipment and Technology Used
Echosounders are a class of sonars that have been discussed in the section on bathymetric surveys. By using sound beams and measuring the time lag between transmitting and receiving a signal, the depth of any waterbody can be determined. A hydro-acoustic sounder can also be used to monitor marine fauna.
Echosounders can be a single or multibeam depending on the purpose. Single beam surveys are carried out by passing beams along parallel routes and then using approximations to map depths at adjacent points. This method is not very accurate when the seabed is covered with poor reflecting material such as mud. Multibeam sounders can use anywhere over 100 beams to conduct simultaneous mapping. By using seismic reflections, the seabed layer thickness can also be analyzed.
The Side Scan Sonar is used to image large areas of the seabed at one go. It is used mainly in navigation and the detection of dangerous underwater terrain. Another device is the Acoustic Doppler Current Profile (ADCP) which acts as a sonar transducer. This machine uses the doppler effect of sound that results in wave shifts. Sound beams are transmitted through the water at different angles such that there is some phase in the reflected beams. This method is commonly used to study discharge effects on canals and rivers. Most ADCPs are used for collecting historic data over time and are built to stay underwater for protracted periods using specialized batteries.
Another commonly used device is the LiDAR (Light Detection and Ranging). The LiDAR uses light pulses to analyze the bottom of a seabed. Using lasers, a 3D image of the ocean’s topography can be rendered. It is commonly used for dredging measurements and to correctly position underwater pipelines.
A Global Positioning System (GPS) is used to determine the accurate position of the sounding boat on which the equipment is loaded. This ensures that the vessel follows a path known as a sounding line. Modern advances in GPS technology have allowed for the sounding vessel to be purely automated.
Other equipments used include buoys. Buoys are used as markers to indicate the line along which sounding is to be carried out. This line must be maintained perpendicular to the shoreline at every point and is achieved using laser-guided signals. By keeping signals along a straight line, the position of the buoy can be fixed. It is then weighted at the bottom using guywires. Lights are usually used to ensure that it is visible even at night. These days, buoys have been replaced with GPS technology.
The vessels used to conduct echo sounding include small inflatable boats, Autonomous Underwater Vehicles (AUVs), and Unmanned Underwater Vehicles (UUVs). The various scanning equipment can be attached either at the stern or at the fore of the vessel. Attaching at the stern is safer since it prevents the equipment from being damaged in case of a collision. In such cases, the scanners may be floated on dredging hoppers, and then towed by the sounding vessel. On the other hand, attaching the equipment at the fore is preferable, as it allows the crew to preempt surrounding topography. AUVs and UUVs can produce high-resolution hydrographic charts and maps as they operate underwater.
Hydrographic Surveying Methods
Hydrographic surveys can be conducted using numerous methods depending on the type of resulting data. We will look at three methods of conducting underwater surveys- line and pole surveying, wire drag surveying, and modern surveying. Prior to any survey being carried out, a basic reconnaissance of the surrounding region is required. By doing so, the surveyors know the type of terrain to expect and can calibrate the equipment accordingly.
Line and pole surveying was one of the oldest systems of hydrography used. This method involved submerging a graduated lead line or a sounding pole into the water. Based on the depth at which the line or pole met the bottom, the readings were marked.
By travelling along parallel paths and taking continuous readings, a rough estimate of the underwater topography could be obtained. As it was a labour and time-intensive process, it became outdated with advances in echo sounding.
Echosounders became popular in the 1930s and allowed a single individual to record depths at a fast pace. The main issue with this method was that approximations were made for the region in between the parallel routes taken by the sounding vessel. This problem was solved using multi-beam sounders that captured large swathes of the surface in one pass.
Wire drag surveying is another old method of hydrographic mapping. Developed by Nicholas Heck between 1906 and 1916, this method relies on a system of boats and wires. In this method, a wire was attached between the sterns of two boats.
The horizontal wire further had vertical weighted wires that were kept submerged. Once the area to be surveyed had been identified, buoys would mark the tracks for each boat to follow. As they moved along their routes, the wires would be dragged along.
In case any rocky obstruction rose out of the seabed, the wire at that point would become entangled. As the boats moved away, that point would become apparent, by noting a sharp change in the wire’s direction. Once analyzed, the location could be marked on special charts. With the advent of the side scan devices and multi-beam sounders, wire drag surveying gradually become redundant by the 1990s.
Modern surveys use advanced technology such as LiDAR to map hydrographic surveys. Using small crafts, the equipment can be floated out to the required areas for mapping. Other commonly used equipment includes side-scan devices, single beam, and multi-beam sounders.
Occasionally, multiple devices are used simultaneously to ensure that the collected data is accurate. In case of any discrepancy between the multiple readings, that particular area can be remapped. On completion of sounding, the data collected from the various equipment needs to process.
Since several machines may be used for one area, the data points need to be correlated for the hydrographic survey. This data is presented in the form of navigational charts, Digital Terrain Models (DTMs), volume charts, and isobath plots. Errors pertaining to pitching, heaving, and yawing must also be corrected using suitable methods. The data is generally plotted in Computer-Aided Design (CAD) software which can output 3D models.
Organizations Dealing in Underwater Surveys
The primary organizations dealing in underwater surveys are national and international bodies attached to the various governments. For instance, the National Institute of Ocean Technology (NIOT) in India, the Instituto Hidrografico de la Marina in Spain, and the National Oceanic and Atmospheric Administration (NOAA) in the United States deal with domestic hydrographic surveys.
In the international sphere, the International Maritime Organization (IMO) oversees global underwater surveys. The International Hydrographic Organization (IHO), comprising 93 member countries (as of 2019), is an intergovernmental treaty regarding international efforts in the field of hydrography. It establishes standards to be followed by all member countries. It aims at encouraging hydrography amongst various nations by conducting training and certification programs. Founded in 1921, it is currently chaired by Secretary-General Dr. Mathias Jonas. The primary purpose of the IHO is to expand the realm of nautical and hydrographic standards. Since it is widely followed, most organizations attached to independent countries also use the same standards. The IHO also creates Regional Hydrographic Commissions to coordinate national charting and surveying activities. The IHO even maintains a base on the continent of Antarctica.
Often, local governments conduct hydrographic surveys for matters falling within their administrative jurisdiction. Although supervised by national organizations, they are conducted independently for a variety of purposes. It could entail dredging a river belonging to a reserved region or studying waterbody behaviour near private property.
Crowdsourced hydrography is a concept that is fast catching on. By increasing awareness amongst the general public, various scientific bodies aim to spread information about the benefits of hydrography. When undertaking crowdfunded projects, a large number of privately owned vessels are used along with echo-sounding equipment. Although boats belong to volunteers, the equipment is usually of the highest standards, often being provided by affluent sponsors.
These surveys are particularly helpful in research fields where rough estimates of hydrographic parameters are sufficient. Although the equipment might be of the highest quality, training and knowledge about operating the machinery will vary across individuals. Thus, crowd-funded surveys tend to have accuracies ranging within 4 to 8 inches of the actual value, which is acceptable for most purposes.
Lastly, hydrographic surveys are often conducted by private organizations. They are undertaken for geological reasons, to determine appropriate locations for oil and gas structures, to install underwater communication devices, and for military applications. These are usually undertaken by large companies that already own docks and ships. Occasionally, they may even hire other companies to perform their hydrographic surveys for them.
Disclaimer: The authors’ views expressed in this article do not necessarily reflect the views of Marine Insight. Data and charts, if used, in the article have been sourced from available information and have not been authenticated by any statutory authority. The author and Marine Insight do not claim it to be accurate nor accept any responsibility for the same. The views constitute only the opinions and do not constitute any guidelines or recommendation on any course of action to be followed by the reader.
The article or images cannot be reproduced, copied, shared or used in any form without the permission of the author and Marine Insight.
Report an Error
from Storage Containers https://www.marineinsight.com/tech/a-guide-to-hydrographic-surveys/ via http://www.rssmix.com/
0 notes
Text
Autonomous Vehicles Help Scientists Estimate Fish Abundance While Protecting Human Health and Safety
Scientists are capitalizing on existing technological capabilities and partnerships to collect fisheries data. This will help fill the information gap resulting from the cancellation of FY20 ship-based surveys due to the COVID-19 pandemic. NOAA Fisheries plans to use autonomous surface vehicles to collect some critically needed data to support management of the nation’s largest commercial fishery for Alaska pollock.
“Extraordinary times require extraordinary measures,” said Alex De Robertis, NOAA Fisheries fisheries biologist and project lead for the Alaska Fisheries Science Center. “We knew there was a possibility that surveys may be canceled this year, so we worked on a contingency plan to collect some data just in case. We were able to capitalize on our previous experience working closely with Saildrone and NOAA Research’s Pacific Marine Environmental Laboratory to get things off the ground quickly.”
This effort supports NOAA’s broader strategy to expand the use of emerging science and technologies including unmanned systems, artificial intelligence, and ‘omics to advance ocean research. NOAA released its strategy in February.
Image Credits: Saildrone | fisheries.noaa.gov
“The Alaska Fisheries Science Center has been engaged in research and development efforts to test new technologies to both improve our operating efficiencies and enable us to quickly respond when situations like this arise,” said Robert Foy, Alaska Fisheries Science Center Director. “Providing the best available science to support management decisions is at the heart of our mission to ensure the health of marine ecosystems while supporting sustainable commercial and recreational fisheries and strong local economies.”
Measuring Fish Abundance Acoustically
Three saildrones, unmanned wind-powered surface vehicles, are en route. They are sailing autonomously, from Alameda, California on a six-week journey to the eastern Bering Sea. They are expected to reach Alaska in early July to begin a 60-day survey. The ocean-going robots will cover roughly the same area normally covered by standard research vessels to estimate pollock abundance.
Image Credits: NOAA Fisheries
Scientists and engineers integrated newly designed low-power sonar instruments, known as echosounders, into the saildrones. This fishfinder technology detects the presence of fish using sound. Echosounders send sound pulses into the water and measure how much of this energy echoes back from fish. From this, scientists are able to make an estimate of the population of fish below. Scientists from the Alaska Fisheries Science Center worked with Saildrone, the Pacific Marine Environmental Laboratory, and Kongsberg to develop this technology.
The technology is great at detecting fish. But, it is less effective at differentiating among species and fish sizes. That is why during standard acoustic-trawl surveys on research vessels, scientists also use a net to collect a sample of fish. From this, they are able to confirm the species, as well as the weight, length, and sex of individual fish.
Stock assessment scientists use these data together with other data collected from commercial fishing vessels to estimate fish population size each year.
De Robertis and colleagues have spent the past several years testing and validating this technology. They conducted side-by-side comparisons with a NOAA research vessel. They found that the saildrone-mounted echosounders produced equivalent acoustic measurements of pollock to NOAA’s fisheries survey vessels.
“In this part of the Bering Sea, pollock are by far the dominant midwater fish species. So, we are confident of getting a useful measure of pollock abundance from the echosounder, even if we can’t directly sample fish. Acoustic-only measurements from ships are already used to inform fisheries management, and we plan to do the same thing with the saildrones,” said De Robertis.
The saildrones are also equipped with solar-powered instruments to measure oceanographic and meteorological conditions. Wind, solar radiation, surface temperature, and salinity measurements will be made along the way.
Real-time Data to Inform Management Decisions
Throughout the survey, compressed summaries of the echosounder data and environmental conditions, and photos will be transmitted to shore via the saildrone’s satellite modem four times per hour.
With the real-time information, De Robertis and colleagues can monitor progress. Using the satellite link, they will be able to adjust the course of the saildrones, if necessary.
Image Credits: NOAA Fisheries
Scientists at the Pacific Marine Environmental Laboratory will process the oceanographic and meteorological data in real time.
“We will make data available to weather forecast centers worldwide via the World Meteorological Organization’s Global Telecommunication System so that the observations can be incorporated into weather predictions,” said Eugene Burger, associate director for Information Technology, Pacific Marine Environmental Laboratory.
According to De Robertis what he once perceived as science fiction has become an operational reality. A lot of progress has been made in just a few short years using unmanned surface vehicles and associated technologies for studying the marine environment.
“If you had asked me six years ago, when I first heard about this, I wouldn’t have thought it possible. Now, I see it as a valuable tool for augmenting our standard research surveys.”
This is especially relevant this year. Unmanned vessel surveys are helping scientists provide some key scientific data at a time when it will be difficult to collect the data any other way.
Reference: fisheries.noaa.gov
Report an Error
from Storage Containers https://www.marineinsight.com/shipping-news/autonomous-vehicles-help-scientists-estimate-fish-abundance-while-protecting-human-health-and-safety/ via http://www.rssmix.com/
0 notes