#downwave
Explore tagged Tumblr posts
Visit Tumblr Blog
Explore Tumblr blogs with no restrictions, modern design and the best experience.
Last Seen Tumblr Blogs


Fun Fact
There are dozens of funny blogs to kill time on Tumblr.
Text

#facts#society#long term debt cycle#downwave#economic downturn#economics#economy#art#memes#best memes#meme
0 notes
Text
can we live live a wee bit less eventful year? k thx
#i know what i signed up for when entering epidemiology as a medical residency#but boy howdy#just riding the downwave at the hospital from covid and seeing the rise in panic because of monkeypox#even if it legit isn't#doesn't fit the diagnostic criteria#doesn't fit the timeline evolution#and if you read a wee bit it doesn't fit. at all.#but just because a patient arrives with skin lessions and shit the urgenciologists start flipping their shit#look here i'm trying to contain this fucking epidemic in the hospital and y'alls hollering ain't helping#ayuda#still got midterms to study for
1 note
·
View note
Text
Currently riding a downwave. Please be patient with me until it passes.
#if someone needs me in an urgent matter please say so in shaa Allah I will be able to help#but I can't do small talks I am so sorry#my wave is so down these days#just made it thru a stomach bug that all my family caught#things went bad but Alhamdulillah we are all okay now#si non I am super stressed about everything so#wass3ou belkom m3aya chwaya :)#life updates#stay safe yall#fi aman Allah
26 notes
·
View notes
Text
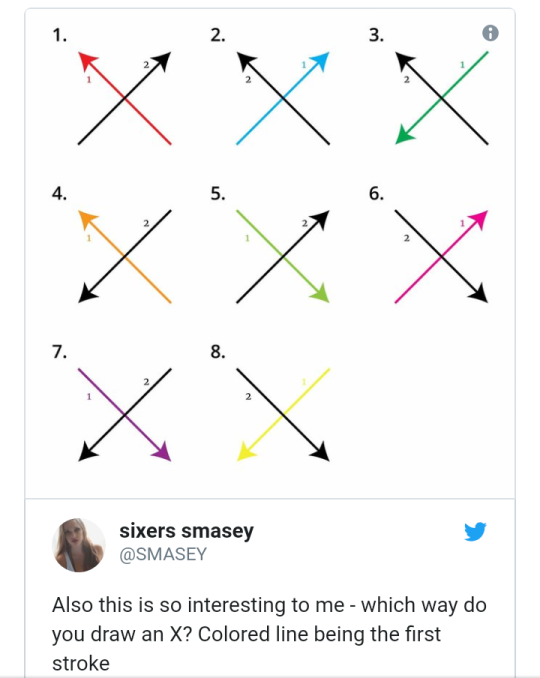
I don’t write anymore lmao. What I remember my regular stroke is 7.
For algebra, sometimes )(, sometimes this “-“ with little cursive at the beginning and the end of stroke one from 7. Upwave for the beginning, downwave for the end and it would be distinctive enough from ✖️.
Side note: when I’m feeling off with too many “x” there(cause tbh even cursive x has the shape “x”), I just use •, it’s the same.
Tag yourself I’m 5
130K notes
·
View notes
Text
Technical Analyst: Silver’s Massive Undervaluation Relative to Gold Makes It Irresistible
Source: Clive Maund for Streetwise Reports 05/11/2020
Technical analyst Clive Maund explains why he’s bullish on silver.
The way you see silver now depends on whether you see a glass that is half empty or half full. If you are a pessimist by nature you will be grumbling about its underperformance relative to gold up to this point, but if you are an optimist, as we certainly are with regards to silver, you will see it as maintaining the opportunity to pick it up cheap before it really takes off higher in a big way, which as we will now proceed to see is a fast growing probability.
We have been wary of silver and silver investments in the recent past with good reason, because if another deflationary downwave hit, silver was in position to get really beaten back down into the dust, as we can see on its latest 6-month chart below. After being smashed in March when the stock market tanked, it staged a recovery, but started looking decidedly timorous as it approached a zone of heavy resistance in April and its unfavorably aligned moving averages. It was set up to take another severe beating in the event of the stock market tipping into another downwave, especially as it has been forced gradually lower by its falling 50-day moving average over the past several weeks.
But during this period the Fed has been creating money at a stupendous rate to throw at the credit markets and the stock markets to prop them up, and there appear to be no limits to how far they will go in pursuit of this objective. Needless to say this action is hugely inflationary in its implications and will lead eventually to hyperinflation, although it won’t start to kick in until the velocity of money increases, and we can expect gold and silver to anticipate this. Right now there is no velocity of money because the economy is dead, but we can expect them to keep pumping money until they get things moving.
The ongoing money creation by the Fed is the reason that the stock market hasn’t tipped into another downwave, and the reason that gold has held up well in recent weeks. If it continues we can expect silver to take on the key resistance in the $16.50 area that it gapped below in March. If it should overcome it, it will change the trend from the current neutral 7 down to neutral, paving the way for a major uptrend to begin.
On the 2-year chart we can see why, at this juncture, we continue to have to classify the trend as neutral/down because of the quite strong resistance at the failed support in the $16.50 area and the still negatively aligned moving averages. A break above this resistance and the 200-day moving average just under $17.00 will improve the picture significantly
On the 13-year chart we can see how the breakdown in March caused by the stock market plunge broke silver down below the lows of a potential giant Double Bottom, and the fact that it has risen back into the pattern is positive, provided that it can hold recent gains and build on them. Volume indicators look positive relative to price, which is a good sign.
Silver’s latest COT looks much more positive than gold’s, which rather suggests that we can look forward to silver outperforming gold for a change before too much longer. This chart certainly indicates that there is plenty of room for silver to advance from here.
Just how undervalued silver is relative to gold is made dramatically clear by the 20-year chart for silver over gold shown below. Every time this ratio has dropped to a really low level it has led to a major sector bull market, but now it is much more extreme suggesting both that the looming bull market will be big and that it is likely to start soon.
With respect to silver’s relatively rotten performance compared to gold in the recent past, this is a good point at which to draw your attention to an excellent article by Jeff Clark on the subject entitled Why Is Silver Stagnant and When Will It Start Moving? I’m sure you will agree that this is most encouraging article for silver investors.
In addition to silver being very cheap relative to gold, there is now a big difference between the paper price for silver and the physical price for silver, which, as with gold, is viewed as a very auspicious development. IT IS VERY IMPORTANT NOT TO LET THIS LARGE PREMIUM PUT YOU OFF BUYING PHYSICAL SILVER IF YOU ARE MINDED TO, because this premium is likely to get even bigger, and if silver starts to take off higher again, physical silver could very quickly become impossible to obtain. Use the cloak of recent weakness to get it on board as fast as you can. Even if a worst case scenario eventuates and the stock market drops despite Fed pumping and silver drops back towards recent lows, so what? When the hyperinflation hits silver could easily end up at $100 or $200 an ounce, and maybe much higher, so why quibble about a possible $3 or $4 drop from here, which is any case is considered much less likely now?
Originally posted on CliveMaund.com on May 10, 2020.
Clive Maund has been president of http://www.clivemaund.com, a successful resource sector website, since its inception in 2003. He has 30 years’ experience in technical analysis and has worked for banks, commodity brokers and stockbrokers in the City of London. He holds a Diploma in Technical Analysis from the UK Society of Technical Analysts.
Sign up for our FREE newsletter at: www.streetwisereports.com/get-news
Disclosure: 1) Statements and opinions expressed are the opinions of Clive Maund and not of Streetwise Reports or its officers. Clive Maund is wholly responsible for the validity of the statements. Streetwise Reports was not involved in any aspect of the article preparation. Clive Maund was not paid by Streetwise Reports LLC for this article. Streetwise Reports was not paid by the author to publish or syndicate this article. 2) This article does not constitute investment advice. Each reader is encouraged to consult with his or her individual financial professional and any action a reader takes as a result of information presented here is his or her own responsibility. By opening this page, each reader accepts and agrees to Streetwise Reports’ terms of use and full legal disclaimer. This article is not a solicitation for investment. Streetwise Reports does not render general or specific investment advice and the information on Streetwise Reports should not be considered a recommendation to buy or sell any security. Streetwise Reports does not endorse or recommend the business, products, services or securities of any company mentioned on Streetwise Reports. 3) From time to time, Streetwise Reports LLC and its directors, officers, employees or members of their families, as well as persons interviewed for articles and interviews on the site, may have a long or short position in securities mentioned. Directors, officers, employees or members of their immediate families are prohibited from making purchases and/or sales of those securities in the open market or otherwise from the time of the interview or the decision to write an article until three business days after the publication of the interview or article. The foregoing prohibition does not apply to articles that in substance only restate previously published company releases.
Charts provided by the author.
CliveMaund.com Disclosure: The above represents the opinion and analysis of Mr Maund, based on data available to him, at the time of writing. Mr. Maund’s opinions are his own, and are not a recommendation or an offer to buy or sell securities. Mr. Maund is an independent analyst who receives no compensation of any kind from any groups, individuals or corporations mentioned in his reports. As trading and investing in any financial markets may involve serious risk of loss, Mr. Maund recommends that you consult with a qualified investment advisor, one licensed by appropriate regulatory agencies in your legal jurisdiction and do your own due diligence and research when making any kind of a transaction with financial ramifications. Although a qualified and experienced stock market analyst, Clive Maund is not a Registered Securities Advisor. Therefore Mr. Maund’s opinions on the market and stocks can only be construed as a solicitation to buy and sell securities when they are subject to the prior approval and endorsement of a Registered Securities Advisor operating in accordance with the appropriate regulations in your area of jurisdiction.
from The Gold Report – Streetwise Exclusive Articles Full Text https://ift.tt/2Tf7j9J
from WordPress https://ift.tt/3brxOir
0 notes
Text
Technical Analyst: Silver's Massive Undervaluation Relative to Gold Makes It Irresistible
Source: Clive Maund for Streetwise Reports 05/11/2020
Technical analyst Clive Maund explains why he's bullish on silver.
The way you see silver now depends on whether you see a glass that is half empty or half full. If you are a pessimist by nature you will be grumbling about its underperformance relative to gold up to this point, but if you are an optimist, as we certainly are with regards to silver, you will see it as maintaining the opportunity to pick it up cheap before it really takes off higher in a big way, which as we will now proceed to see is a fast growing probability.
We have been wary of silver and silver investments in the recent past with good reason, because if another deflationary downwave hit, silver was in position to get really beaten back down into the dust, as we can see on its latest 6-month chart below. After being smashed in March when the stock market tanked, it staged a recovery, but started looking decidedly timorous as it approached a zone of heavy resistance in April and its unfavorably aligned moving averages. It was set up to take another severe beating in the event of the stock market tipping into another downwave, especially as it has been forced gradually lower by its falling 50-day moving average over the past several weeks.
But during this period the Fed has been creating money at a stupendous rate to throw at the credit markets and the stock markets to prop them up, and there appear to be no limits to how far they will go in pursuit of this objective. Needless to say this action is hugely inflationary in its implications and will lead eventually to hyperinflation, although it won't start to kick in until the velocity of money increases, and we can expect gold and silver to anticipate this. Right now there is no velocity of money because the economy is dead, but we can expect them to keep pumping money until they get things moving.
The ongoing money creation by the Fed is the reason that the stock market hasn't tipped into another downwave, and the reason that gold has held up well in recent weeks. If it continues we can expect silver to take on the key resistance in the $16.50 area that it gapped below in March. If it should overcome it, it will change the trend from the current neutral 7 down to neutral, paving the way for a major uptrend to begin.
On the 2-year chart we can see why, at this juncture, we continue to have to classify the trend as neutral/down because of the quite strong resistance at the failed support in the $16.50 area and the still negatively aligned moving averages. A break above this resistance and the 200-day moving average just under $17.00 will improve the picture significantly
On the 13-year chart we can see how the breakdown in March caused by the stock market plunge broke silver down below the lows of a potential giant Double Bottom, and the fact that it has risen back into the pattern is positive, provided that it can hold recent gains and build on them. Volume indicators look positive relative to price, which is a good sign.
Silver's latest COT looks much more positive than gold's, which rather suggests that we can look forward to silver outperforming gold for a change before too much longer. This chart certainly indicates that there is plenty of room for silver to advance from here.
Just how undervalued silver is relative to gold is made dramatically clear by the 20-year chart for silver over gold shown below. Every time this ratio has dropped to a really low level it has led to a major sector bull market, but now it is much more extreme suggesting both that the looming bull market will be big and that it is likely to start soon.
With respect to silver's relatively rotten performance compared to gold in the recent past, this is a good point at which to draw your attention to an excellent article by Jeff Clark on the subject entitled Why Is Silver Stagnant and When Will It Start Moving? I'm sure you will agree that this is most encouraging article for silver investors.
In addition to silver being very cheap relative to gold, there is now a big difference between the paper price for silver and the physical price for silver, which, as with gold, is viewed as a very auspicious development. IT IS VERY IMPORTANT NOT TO LET THIS LARGE PREMIUM PUT YOU OFF BUYING PHYSICAL SILVER IF YOU ARE MINDED TO, because this premium is likely to get even bigger, and if silver starts to take off higher again, physical silver could very quickly become impossible to obtain. Use the cloak of recent weakness to get it on board as fast as you can. Even if a worst case scenario eventuates and the stock market drops despite Fed pumping and silver drops back towards recent lows, so what? When the hyperinflation hits silver could easily end up at $100 or $200 an ounce, and maybe much higher, so why quibble about a possible $3 or $4 drop from here, which is any case is considered much less likely now?
Originally posted on CliveMaund.com on May 10, 2020.
Clive Maund has been president of www.clivemaund.com, a successful resource sector website, since its inception in 2003. He has 30 years' experience in technical analysis and has worked for banks, commodity brokers and stockbrokers in the City of London. He holds a Diploma in Technical Analysis from the UK Society of Technical Analysts.
Sign up for our FREE newsletter at: www.streetwisereports.com/get-news
Disclosure: 1) Statements and opinions expressed are the opinions of Clive Maund and not of Streetwise Reports or its officers. Clive Maund is wholly responsible for the validity of the statements. Streetwise Reports was not involved in any aspect of the article preparation. Clive Maund was not paid by Streetwise Reports LLC for this article. Streetwise Reports was not paid by the author to publish or syndicate this article. 2) This article does not constitute investment advice. Each reader is encouraged to consult with his or her individual financial professional and any action a reader takes as a result of information presented here is his or her own responsibility. By opening this page, each reader accepts and agrees to Streetwise Reports' terms of use and full legal disclaimer. This article is not a solicitation for investment. Streetwise Reports does not render general or specific investment advice and the information on Streetwise Reports should not be considered a recommendation to buy or sell any security. Streetwise Reports does not endorse or recommend the business, products, services or securities of any company mentioned on Streetwise Reports. 3) From time to time, Streetwise Reports LLC and its directors, officers, employees or members of their families, as well as persons interviewed for articles and interviews on the site, may have a long or short position in securities mentioned. Directors, officers, employees or members of their immediate families are prohibited from making purchases and/or sales of those securities in the open market or otherwise from the time of the interview or the decision to write an article until three business days after the publication of the interview or article. The foregoing prohibition does not apply to articles that in substance only restate previously published company releases.
Charts provided by the author.
CliveMaund.com Disclosure: The above represents the opinion and analysis of Mr Maund, based on data available to him, at the time of writing. Mr. Maund's opinions are his own, and are not a recommendation or an offer to buy or sell securities. Mr. Maund is an independent analyst who receives no compensation of any kind from any groups, individuals or corporations mentioned in his reports. As trading and investing in any financial markets may involve serious risk of loss, Mr. Maund recommends that you consult with a qualified investment advisor, one licensed by appropriate regulatory agencies in your legal jurisdiction and do your own due diligence and research when making any kind of a transaction with financial ramifications. Although a qualified and experienced stock market analyst, Clive Maund is not a Registered Securities Advisor. Therefore Mr. Maund's opinions on the market and stocks can only be construed as a solicitation to buy and sell securities when they are subject to the prior approval and endorsement of a Registered Securities Advisor operating in accordance with the appropriate regulations in your area of jurisdiction.
from https://www.streetwisereports.com/article/2020/05/11/technical-analyst-silvers-massive-undervaluation-relative-to-gold-makes-it-irresistible.html
0 notes
Photo

Look for exhausting of volume on 1-2-3 downwaves. Then you'ss (Not always) Final Trap 4. Enter on the upwave 5 with SL under 4. This is a simple schematic. Price has enough room to rally overhead.
0 notes
Text
BTCUSD Supply/Demand Zones, Going to Retest Local High
New Post has been published on http://bitcoingape.com/btcusd-supply-demand-zones-going-to-retest-local-high/
BTCUSD Supply/Demand Zones, Going to Retest Local High
BTCUSD Supply/Demand Zones, Going to Retest Local High
Bitcoin / Dollar BITFINEX:BTCUSD
Silvertoe
Firstly, I’m in no position to teach anyone. The only reason i make this public is so hopefully more experienced traders can weigh in and hopefully help me if they would be so kind :). Anyways i won’t really be able to describe it in a way that would really help most and i lack a lot of the verbage still, so on to what I’m seeing.
On the chart you can see the Fibonacci levels from the most recent wave up, as well as where i believe the supply and demand levels are for a longer time frame. If this were the stock market, this is where the banks are buying. For crypto they are just called whales. I’m using the most recent downwave’s fibonacci levels to project where i think price will meet strong resistance, which the 3.618 level matches up with the most recent high further strengthening my view. I think bull flags will start to succeed and reach the new local high, we may dip back into the demand zone a bit. I have the stop set at what seems to be the local low. You can see on the DMI a divergence of bullish pressure to the upside and bearish divergence on bearish pressure. If we go below that level my view is negated and i think we will retest lows.
What do you think? Source link
0 notes
Link
US Stock Market in Position for Downwave #2
0 notes
Text
Technical Analyst: Silver's Massive Undervaluation Relative to Gold Makes It Irresistible
Source: Clive Maund for Streetwise Reports 05/11/2020
Technical analyst Clive Maund explains why he's bullish on silver.
The way you see silver now depends on whether you see a glass that is half empty or half full. If you are a pessimist by nature you will be grumbling about its underperformance relative to gold up to this point, but if you are an optimist, as we certainly are with regards to silver, you will see it as maintaining the opportunity to pick it up cheap before it really takes off higher in a big way, which as we will now proceed to see is a fast growing probability.
We have been wary of silver and silver investments in the recent past with good reason, because if another deflationary downwave hit, silver was in position to get really beaten back down into the dust, as we can see on its latest 6-month chart below. After being smashed in March when the stock market tanked, it staged a recovery, but started looking decidedly timorous as it approached a zone of heavy resistance in April and its unfavorably aligned moving averages. It was set up to take another severe beating in the event of the stock market tipping into another downwave, especially as it has been forced gradually lower by its falling 50-day moving average over the past several weeks.
But during this period the Fed has been creating money at a stupendous rate to throw at the credit markets and the stock markets to prop them up, and there appear to be no limits to how far they will go in pursuit of this objective. Needless to say this action is hugely inflationary in its implications and will lead eventually to hyperinflation, although it won't start to kick in until the velocity of money increases, and we can expect gold and silver to anticipate this. Right now there is no velocity of money because the economy is dead, but we can expect them to keep pumping money until they get things moving.
The ongoing money creation by the Fed is the reason that the stock market hasn't tipped into another downwave, and the reason that gold has held up well in recent weeks. If it continues we can expect silver to take on the key resistance in the $16.50 area that it gapped below in March. If it should overcome it, it will change the trend from the current neutral 7 down to neutral, paving the way for a major uptrend to begin.
On the 2-year chart we can see why, at this juncture, we continue to have to classify the trend as neutral/down because of the quite strong resistance at the failed support in the $16.50 area and the still negatively aligned moving averages. A break above this resistance and the 200-day moving average just under $17.00 will improve the picture significantly
On the 13-year chart we can see how the breakdown in March caused by the stock market plunge broke silver down below the lows of a potential giant Double Bottom, and the fact that it has risen back into the pattern is positive, provided that it can hold recent gains and build on them. Volume indicators look positive relative to price, which is a good sign.
Silver's latest COT looks much more positive than gold's, which rather suggests that we can look forward to silver outperforming gold for a change before too much longer. This chart certainly indicates that there is plenty of room for silver to advance from here.
Just how undervalued silver is relative to gold is made dramatically clear by the 20-year chart for silver over gold shown below. Every time this ratio has dropped to a really low level it has led to a major sector bull market, but now it is much more extreme suggesting both that the looming bull market will be big and that it is likely to start soon.
With respect to silver's relatively rotten performance compared to gold in the recent past, this is a good point at which to draw your attention to an excellent article by Jeff Clark on the subject entitled Why Is Silver Stagnant and When Will It Start Moving? I'm sure you will agree that this is most encouraging article for silver investors.
In addition to silver being very cheap relative to gold, there is now a big difference between the paper price for silver and the physical price for silver, which, as with gold, is viewed as a very auspicious development. IT IS VERY IMPORTANT NOT TO LET THIS LARGE PREMIUM PUT YOU OFF BUYING PHYSICAL SILVER IF YOU ARE MINDED TO, because this premium is likely to get even bigger, and if silver starts to take off higher again, physical silver could very quickly become impossible to obtain. Use the cloak of recent weakness to get it on board as fast as you can. Even if a worst case scenario eventuates and the stock market drops despite Fed pumping and silver drops back towards recent lows, so what? When the hyperinflation hits silver could easily end up at $100 or $200 an ounce, and maybe much higher, so why quibble about a possible $3 or $4 drop from here, which is any case is considered much less likely now?
Originally posted on CliveMaund.com on May 10, 2020.
Clive Maund has been president of www.clivemaund.com, a successful resource sector website, since its inception in 2003. He has 30 years' experience in technical analysis and has worked for banks, commodity brokers and stockbrokers in the City of London. He holds a Diploma in Technical Analysis from the UK Society of Technical Analysts.
Sign up for our FREE newsletter at: www.streetwisereports.com/get-news
Disclosure: 1) Statements and opinions expressed are the opinions of Clive Maund and not of Streetwise Reports or its officers. Clive Maund is wholly responsible for the validity of the statements. Streetwise Reports was not involved in any aspect of the article preparation. Clive Maund was not paid by Streetwise Reports LLC for this article. Streetwise Reports was not paid by the author to publish or syndicate this article. 2) This article does not constitute investment advice. Each reader is encouraged to consult with his or her individual financial professional and any action a reader takes as a result of information presented here is his or her own responsibility. By opening this page, each reader accepts and agrees to Streetwise Reports' terms of use and full legal disclaimer. This article is not a solicitation for investment. Streetwise Reports does not render general or specific investment advice and the information on Streetwise Reports should not be considered a recommendation to buy or sell any security. Streetwise Reports does not endorse or recommend the business, products, services or securities of any company mentioned on Streetwise Reports. 3) From time to time, Streetwise Reports LLC and its directors, officers, employees or members of their families, as well as persons interviewed for articles and interviews on the site, may have a long or short position in securities mentioned. Directors, officers, employees or members of their immediate families are prohibited from making purchases and/or sales of those securities in the open market or otherwise from the time of the interview or the decision to write an article until three business days after the publication of the interview or article. The foregoing prohibition does not apply to articles that in substance only restate previously published company releases.
Charts provided by the author.
CliveMaund.com Disclosure: The above represents the opinion and analysis of Mr Maund, based on data available to him, at the time of writing. Mr. Maund's opinions are his own, and are not a recommendation or an offer to buy or sell securities. Mr. Maund is an independent analyst who receives no compensation of any kind from any groups, individuals or corporations mentioned in his reports. As trading and investing in any financial markets may involve serious risk of loss, Mr. Maund recommends that you consult with a qualified investment advisor, one licensed by appropriate regulatory agencies in your legal jurisdiction and do your own due diligence and research when making any kind of a transaction with financial ramifications. Although a qualified and experienced stock market analyst, Clive Maund is not a Registered Securities Advisor. Therefore Mr. Maund's opinions on the market and stocks can only be construed as a solicitation to buy and sell securities when they are subject to the prior approval and endorsement of a Registered Securities Advisor operating in accordance with the appropriate regulations in your area of jurisdiction.
from The Gold Report - Streetwise Exclusive Articles Full Text https://ift.tt/2Tf7j9J
0 notes
Text
The Second Massive Downwave Is Almost Upon Us
Source: Clive Maund for Streetwise Reports 05/04/2020
Technical analyst Clive Maund charts the markets and discusses what he believes is ahead for stocks, the dollar and commodities.
Notwithstanding the Fed’s seemingly limitless ability to create money to throw at the stock market, which has caused it to rally in recent weeks in the face of a dead economy and apocalyptic jobs data and earnings, etc., all the charts we are going to look at here point to another severe downleg soon.
My attention was drawn to a bearish Rising Wedge completing in the London FTSE index by a colleague in England. So I took a look at it, and sure enough it is. So, I thought I’d take a look at a couple of other European indices, the CAC 40 in France and the German DAX Composite, which showed a very similar picture. Their charts are shown below and as you will see, they are both very bearish, and point to a break lower soon leading to a severe decline.
You will recall that we were thrown somewhat a week or two ago, when the main U.S. indices, the Dow Jones Industrials and the S&P500 index, broke down from their bearish Rising Wedges but then didn’t follow through, and instead rose to new highs for the rally from the March lows, which caused us to dump our Puts and then bide our time to see what transpired. The sharp drop at the end of the monththis past Fridayjolted me into action and prompted me to hunt around in a quest for greater clarity regarding what is going on, and it has turned out to be a rewarding search.
While it’s not exactly clear what is going on with the main U.S. indices, the picture becomes much clearer when we look at the broader but much less used Wilshire 5000 index. Take a look at this first of allit’s a 5-month chart for the Wilshire 5000 that reveals that it didn’t break down from its Rising Wedge about 10 days ago, unlike the Dow Industrials and the S&P500 index, but it did last Friday, which happened to be the end of the month, by a significant margin. This is regarded as an ominous development that probably marks the start of the second major downleg of this bear market. We can also see that the countertrend rally got stopped by the important resistance level shown.
Now take a look at this. The following chart shows that the breakdown from the Wedge happened just two days after the Wilshire 5000 had arrived at an upper range Fibonacci target at a retracement level of 61.8% of the preceding first leg down of the bear market. This is normally as far as a retracement following the first leg down of a bear market gets, and the same happened following the Tech bubble peak in 2000 and the start of the 20072008 meltdown.
If we now compare the Wilshire charts above with the S&P500 index chart we realize that the breakdown by the latter about 10 days ago was a false breakdown, inasmuch as, as we have just seen, the Wilshire did not break down at that time.
If we see another heavy drop in the broad stock market shortly, it is of course reasonable to presume that it will coincide with a strong rally in the dollar, so how does that look now? On the following 5-month chart for the dollar index, which has the S&P500 index placed above and gold below for direct comparison, there are several very important points to observe. The first is that when the market tanked into mid-March, the dollar soared just as we would expect it to and as happened in 2008. Then it dropped back sharply later in March as the market rebounded, but it has since been tracking sideways in a trading range marking time as the stock market continued to ascend to complete its relief rally. Right now it is at the support at the bottom of this range where a doji candle formed on Friday suggesting that it is about to start higher again. If the market now proceeds to tank in a second major downwave then we can expect the dollar to soar again, bust out of the top of the current range and probably exceed its mid-March highs.
If the dollar soars then commodities are likely to take another broadside, just as in the first half of March, and just as in 2008, and gold and silver are unlikely to be sparedthe Gold Miners Bullish Percent Index is now at an extreme reading of 92% bullish. Copper in particular looks like it will get crushed by another downwave that should take it to new bear market lows by a wide margin.
Originally posted on CliveMaund.com at 4.35 pm EDT on 2nd May 2020.
Clive Maund has been president of http://www.clivemaund.com, a successful resource sector website, since its inception in 2003. He has 30 years’ experience in technical analysis and has worked for banks, commodity brokers and stockbrokers in the City of London. He holds a Diploma in Technical Analysis from the UK Society of Technical Analysts.
Sign up for our FREE newsletter at: www.streetwisereports.com/get-news
Disclosure: 1) Statements and opinions expressed are the opinions of Clive Maund and not of Streetwise Reports or its officers. Clive Maund is wholly responsible for the validity of the statements. Streetwise Reports was not involved in any aspect of the article preparation. Clive Maund was not paid by Streetwise Reports LLC for this article. Streetwise Reports was not paid by the author to publish or syndicate this article. 2) This article does not constitute investment advice. Each reader is encouraged to consult with his or her individual financial professional and any action a reader takes as a result of information presented here is his or her own responsibility. By opening this page, each reader accepts and agrees to Streetwise Reports’ terms of use and full legal disclaimer. This article is not a solicitation for investment. Streetwise Reports does not render general or specific investment advice and the information on Streetwise Reports should not be considered a recommendation to buy or sell any security. Streetwise Reports does not endorse or recommend the business, products, services or securities of any company mentioned on Streetwise Reports. 3) From time to time, Streetwise Reports LLC and its directors, officers, employees or members of their families, as well as persons interviewed for articles and interviews on the site, may have a long or short position in securities mentioned. Directors, officers, employees or members of their immediate families are prohibited from making purchases and/or sales of those securities in the open market or otherwise from the time of the interview or the decision to write an article until three business days after the publication of the interview or article. The foregoing prohibition does not apply to articles that in substance only restate previously published company releases.
Charts provided by the author.
CliveMaund.com Disclosure: The above represents the opinion and analysis of Mr Maund, based on data available to him, at the time of writing. Mr. Maund’s opinions are his own, and are not a recommendation or an offer to buy or sell securities. Mr. Maund is an independent analyst who receives no compensation of any kind from any groups, individuals or corporations mentioned in his reports. As trading and investing in any financial markets may involve serious risk of loss, Mr. Maund recommends that you consult with a qualified investment advisor, one licensed by appropriate regulatory agencies in your legal jurisdiction and do your own due diligence and research when making any kind of a transaction with financial ramifications. Although a qualified and experienced stock market analyst, Clive Maund is not a Registered Securities Advisor. Therefore Mr. Maund’s opinions on the market and stocks can only be construed as a solicitation to buy and sell securities when they are subject to the prior approval and endorsement of a Registered Securities Advisor operating in accordance with the appropriate regulations in your area of jurisdiction.
from The Gold Report – Streetwise Exclusive Articles Full Text https://ift.tt/2yvcfzV
from WordPress https://ift.tt/35wZ65B
0 notes
Text
The Second Massive Downwave Is Almost Upon Us
Source: Clive Maund for Streetwise Reports 05/04/2020
Technical analyst Clive Maund charts the markets and discusses what he believes is ahead for stocks, the dollar and commodities.
Notwithstanding the Fed's seemingly limitless ability to create money to throw at the stock market, which has caused it to rally in recent weeks in the face of a dead economy and apocalyptic jobs data and earnings, etc., all the charts we are going to look at here point to another severe downleg soon.
My attention was drawn to a bearish Rising Wedge completing in the London FTSE index by a colleague in England. So I took a look at it, and sure enough it is. So, I thought I'd take a look at a couple of other European indices, the CAC 40 in France and the German DAX Composite, which showed a very similar picture. Their charts are shown below and as you will see, they are both very bearish, and point to a break lower soon leading to a severe decline.
You will recall that we were thrown somewhat a week or two ago, when the main U.S. indices, the Dow Jones Industrials and the S&P500 index, broke down from their bearish Rising Wedges but then didn't follow through, and instead rose to new highs for the rally from the March lows, which caused us to dump our Puts and then bide our time to see what transpired. The sharp drop at the end of the monththis past Fridayjolted me into action and prompted me to hunt around in a quest for greater clarity regarding what is going on, and it has turned out to be a rewarding search.
While it's not exactly clear what is going on with the main U.S. indices, the picture becomes much clearer when we look at the broader but much less used Wilshire 5000 index. Take a look at this first of allit's a 5-month chart for the Wilshire 5000 that reveals that it didn't break down from its Rising Wedge about 10 days ago, unlike the Dow Industrials and the S&P500 index, but it did last Friday, which happened to be the end of the month, by a significant margin. This is regarded as an ominous development that probably marks the start of the second major downleg of this bear market. We can also see that the countertrend rally got stopped by the important resistance level shown.
Now take a look at this. The following chart shows that the breakdown from the Wedge happened just two days after the Wilshire 5000 had arrived at an upper range Fibonacci target at a retracement level of 61.8% of the preceding first leg down of the bear market. This is normally as far as a retracement following the first leg down of a bear market gets, and the same happened following the Tech bubble peak in 2000 and the start of the 20072008 meltdown.
If we now compare the Wilshire charts above with the S&P500 index chart we realize that the breakdown by the latter about 10 days ago was a false breakdown, inasmuch as, as we have just seen, the Wilshire did not break down at that time.
If we see another heavy drop in the broad stock market shortly, it is of course reasonable to presume that it will coincide with a strong rally in the dollar, so how does that look now? On the following 5-month chart for the dollar index, which has the S&P500 index placed above and gold below for direct comparison, there are several very important points to observe. The first is that when the market tanked into mid-March, the dollar soared just as we would expect it to and as happened in 2008. Then it dropped back sharply later in March as the market rebounded, but it has since been tracking sideways in a trading range marking time as the stock market continued to ascend to complete its relief rally. Right now it is at the support at the bottom of this range where a doji candle formed on Friday suggesting that it is about to start higher again. If the market now proceeds to tank in a second major downwave then we can expect the dollar to soar again, bust out of the top of the current range and probably exceed its mid-March highs.
If the dollar soars then commodities are likely to take another broadside, just as in the first half of March, and just as in 2008, and gold and silver are unlikely to be sparedthe Gold Miners Bullish Percent Index is now at an extreme reading of 92% bullish. Copper in particular looks like it will get crushed by another downwave that should take it to new bear market lows by a wide margin.
Originally posted on CliveMaund.com at 4.35 pm EDT on 2nd May 2020.
Clive Maund has been president of www.clivemaund.com, a successful resource sector website, since its inception in 2003. He has 30 years' experience in technical analysis and has worked for banks, commodity brokers and stockbrokers in the City of London. He holds a Diploma in Technical Analysis from the UK Society of Technical Analysts.
Sign up for our FREE newsletter at: www.streetwisereports.com/get-news
Disclosure: 1) Statements and opinions expressed are the opinions of Clive Maund and not of Streetwise Reports or its officers. Clive Maund is wholly responsible for the validity of the statements. Streetwise Reports was not involved in any aspect of the article preparation. Clive Maund was not paid by Streetwise Reports LLC for this article. Streetwise Reports was not paid by the author to publish or syndicate this article. 2) This article does not constitute investment advice. Each reader is encouraged to consult with his or her individual financial professional and any action a reader takes as a result of information presented here is his or her own responsibility. By opening this page, each reader accepts and agrees to Streetwise Reports' terms of use and full legal disclaimer. This article is not a solicitation for investment. Streetwise Reports does not render general or specific investment advice and the information on Streetwise Reports should not be considered a recommendation to buy or sell any security. Streetwise Reports does not endorse or recommend the business, products, services or securities of any company mentioned on Streetwise Reports. 3) From time to time, Streetwise Reports LLC and its directors, officers, employees or members of their families, as well as persons interviewed for articles and interviews on the site, may have a long or short position in securities mentioned. Directors, officers, employees or members of their immediate families are prohibited from making purchases and/or sales of those securities in the open market or otherwise from the time of the interview or the decision to write an article until three business days after the publication of the interview or article. The foregoing prohibition does not apply to articles that in substance only restate previously published company releases.
Charts provided by the author.
CliveMaund.com Disclosure: The above represents the opinion and analysis of Mr Maund, based on data available to him, at the time of writing. Mr. Maund's opinions are his own, and are not a recommendation or an offer to buy or sell securities. Mr. Maund is an independent analyst who receives no compensation of any kind from any groups, individuals or corporations mentioned in his reports. As trading and investing in any financial markets may involve serious risk of loss, Mr. Maund recommends that you consult with a qualified investment advisor, one licensed by appropriate regulatory agencies in your legal jurisdiction and do your own due diligence and research when making any kind of a transaction with financial ramifications. Although a qualified and experienced stock market analyst, Clive Maund is not a Registered Securities Advisor. Therefore Mr. Maund's opinions on the market and stocks can only be construed as a solicitation to buy and sell securities when they are subject to the prior approval and endorsement of a Registered Securities Advisor operating in accordance with the appropriate regulations in your area of jurisdiction.
from The Gold Report - Streetwise Exclusive Articles Full Text https://ift.tt/2yvcfzV
0 notes
Text
The Second Massive Downwave Is Almost Upon Us
Source: Clive Maund for Streetwise Reports 05/04/2020
Technical analyst Clive Maund charts the markets and discusses what he believes is ahead for stocks, the dollar and commodities.
Notwithstanding the Fed's seemingly limitless ability to create money to throw at the stock market, which has caused it to rally in recent weeks in the face of a dead economy and apocalyptic jobs data and earnings, etc., all the charts we are going to look at here point to another severe downleg soon.
My attention was drawn to a bearish Rising Wedge completing in the London FTSE index by a colleague in England. So I took a look at it, and sure enough it is. So, I thought I'd take a look at a couple of other European indices, the CAC 40 in France and the German DAX Composite, which showed a very similar picture. Their charts are shown below and as you will see, they are both very bearish, and point to a break lower soon leading to a severe decline.
You will recall that we were thrown somewhat a week or two ago, when the main U.S. indices, the Dow Jones Industrials and the S&P500 index, broke down from their bearish Rising Wedges but then didn't follow through, and instead rose to new highs for the rally from the March lows, which caused us to dump our Puts and then bide our time to see what transpired. The sharp drop at the end of the monththis past Fridayjolted me into action and prompted me to hunt around in a quest for greater clarity regarding what is going on, and it has turned out to be a rewarding search.
While it's not exactly clear what is going on with the main U.S. indices, the picture becomes much clearer when we look at the broader but much less used Wilshire 5000 index. Take a look at this first of allit's a 5-month chart for the Wilshire 5000 that reveals that it didn't break down from its Rising Wedge about 10 days ago, unlike the Dow Industrials and the S&P500 index, but it did last Friday, which happened to be the end of the month, by a significant margin. This is regarded as an ominous development that probably marks the start of the second major downleg of this bear market. We can also see that the countertrend rally got stopped by the important resistance level shown.
Now take a look at this. The following chart shows that the breakdown from the Wedge happened just two days after the Wilshire 5000 had arrived at an upper range Fibonacci target at a retracement level of 61.8% of the preceding first leg down of the bear market. This is normally as far as a retracement following the first leg down of a bear market gets, and the same happened following the Tech bubble peak in 2000 and the start of the 20072008 meltdown.
If we now compare the Wilshire charts above with the S&P500 index chart we realize that the breakdown by the latter about 10 days ago was a false breakdown, inasmuch as, as we have just seen, the Wilshire did not break down at that time.
If we see another heavy drop in the broad stock market shortly, it is of course reasonable to presume that it will coincide with a strong rally in the dollar, so how does that look now? On the following 5-month chart for the dollar index, which has the S&P500 index placed above and gold below for direct comparison, there are several very important points to observe. The first is that when the market tanked into mid-March, the dollar soared just as we would expect it to and as happened in 2008. Then it dropped back sharply later in March as the market rebounded, but it has since been tracking sideways in a trading range marking time as the stock market continued to ascend to complete its relief rally. Right now it is at the support at the bottom of this range where a doji candle formed on Friday suggesting that it is about to start higher again. If the market now proceeds to tank in a second major downwave then we can expect the dollar to soar again, bust out of the top of the current range and probably exceed its mid-March highs.
If the dollar soars then commodities are likely to take another broadside, just as in the first half of March, and just as in 2008, and gold and silver are unlikely to be sparedthe Gold Miners Bullish Percent Index is now at an extreme reading of 92% bullish. Copper in particular looks like it will get crushed by another downwave that should take it to new bear market lows by a wide margin.
Originally posted on CliveMaund.com at 4.35 pm EDT on 2nd May 2020.
Clive Maund has been president of www.clivemaund.com, a successful resource sector website, since its inception in 2003. He has 30 years' experience in technical analysis and has worked for banks, commodity brokers and stockbrokers in the City of London. He holds a Diploma in Technical Analysis from the UK Society of Technical Analysts.
Sign up for our FREE newsletter at: www.streetwisereports.com/get-news
Disclosure: 1) Statements and opinions expressed are the opinions of Clive Maund and not of Streetwise Reports or its officers. Clive Maund is wholly responsible for the validity of the statements. Streetwise Reports was not involved in any aspect of the article preparation. Clive Maund was not paid by Streetwise Reports LLC for this article. Streetwise Reports was not paid by the author to publish or syndicate this article. 2) This article does not constitute investment advice. Each reader is encouraged to consult with his or her individual financial professional and any action a reader takes as a result of information presented here is his or her own responsibility. By opening this page, each reader accepts and agrees to Streetwise Reports' terms of use and full legal disclaimer. This article is not a solicitation for investment. Streetwise Reports does not render general or specific investment advice and the information on Streetwise Reports should not be considered a recommendation to buy or sell any security. Streetwise Reports does not endorse or recommend the business, products, services or securities of any company mentioned on Streetwise Reports. 3) From time to time, Streetwise Reports LLC and its directors, officers, employees or members of their families, as well as persons interviewed for articles and interviews on the site, may have a long or short position in securities mentioned. Directors, officers, employees or members of their immediate families are prohibited from making purchases and/or sales of those securities in the open market or otherwise from the time of the interview or the decision to write an article until three business days after the publication of the interview or article. The foregoing prohibition does not apply to articles that in substance only restate previously published company releases.
Charts provided by the author.
CliveMaund.com Disclosure: The above represents the opinion and analysis of Mr Maund, based on data available to him, at the time of writing. Mr. Maund's opinions are his own, and are not a recommendation or an offer to buy or sell securities. Mr. Maund is an independent analyst who receives no compensation of any kind from any groups, individuals or corporations mentioned in his reports. As trading and investing in any financial markets may involve serious risk of loss, Mr. Maund recommends that you consult with a qualified investment advisor, one licensed by appropriate regulatory agencies in your legal jurisdiction and do your own due diligence and research when making any kind of a transaction with financial ramifications. Although a qualified and experienced stock market analyst, Clive Maund is not a Registered Securities Advisor. Therefore Mr. Maund's opinions on the market and stocks can only be construed as a solicitation to buy and sell securities when they are subject to the prior approval and endorsement of a Registered Securities Advisor operating in accordance with the appropriate regulations in your area of jurisdiction.
from https://www.streetwisereports.com/article/2020/05/04/the-second-massive-downwave-is-almost-upon-us.html
0 notes