#chartformatting
Explore tagged Tumblr posts
Text
How to Make Chart in Excel [Easy and Practical] 2021

In this article, we will discuss how to make charts in Excel from various types of charts in excel, such as Graphs charts, bar charts, line charts, pie charts, and others. As you all know, Microsoft Corporation as the owner of the Excel application has made many improvements to its applications. This is evident from the many versions of Microsoft Excel that are sold in the market. However, is the way to make a chart in Excel the same in different versions? The answer is yes, almost the same. The only difference lies in the Excel ribbon menu used. But basically, the way of making it is the same. Then, do you already know how to make charts in Excel? If not, you are lucky to have found this article.

How to make charts in Excel from various types of charts in excel But before that, it would be better if you know the function of each type of graph so you don't use it wrong.
About Microsoft Excel
Microsoft Excel is a useful and powerful program for data analysis and documentation. It is a spreadsheet program, containing a series of columns and rows, where each intersection of column and row is a "cell". Each cell contains a data point or piece of information.
Types of charts in excel
Did you know that each type of charts in Excel tends to have a different function? Also, learn excel formulas to make it easier for you to process data. So here, there are types of charts in Excel that we have mention below for you and if you want to know about the full explanation on the type of charts in Excel then read the full article below. - Column Chart - Line Chart - Pie Charts (Circle Chart) - Bar Charts - Surface Charts - Stock Charts Here are some explanations about the type of charts in Excel that are suitable for certain data. 1. Column Chart (Chart Column) A column chart is a data visualization where each category is represented by a rectangle, the height of the rectangle is proportional to the plotted value. Column charts are also known as vertical bar charts. This type of graph is very suitable for comparing data or showing a change in data over a certain period of time. For example, a chart of brand preference with the type of cola.
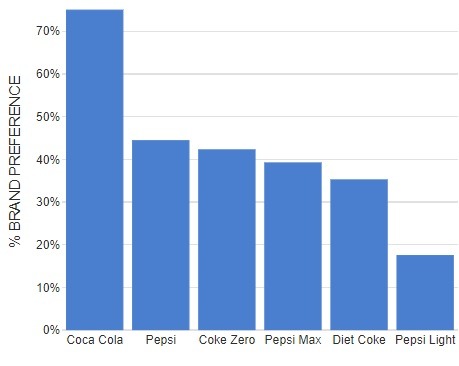
Column Chart-Image source: displayr.com 2. Line Chart (Figure Line) This chart is suitable for displaying continuous data and is very effective in identifying a pattern or trend. Therefore, it is common for people to use these graphs to display data trends at certain time intervals. For example, to display the Wildlife population.
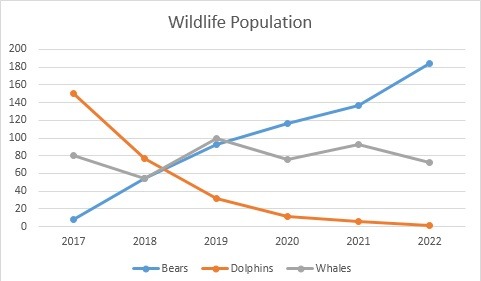
Line Chart 3. Pie Charts (Circle Chart) Next up is the circle chart type. This circle graph is used to show the proportion of an item in the data. Usually, the value of the items in the data is shown as a percentage. For example, the percentage of Pet ownership.
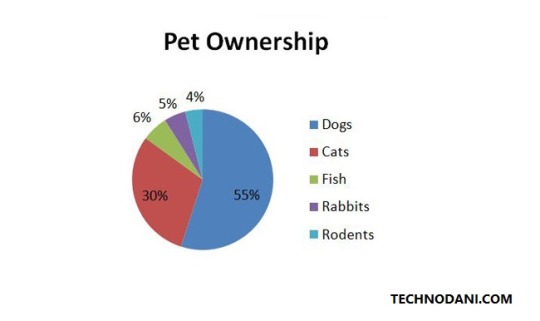
Pie Charts 4. Bar Charts This graph is usually used to compare several items. For example, to graph about Directors with the greatest Number of Award Wins.
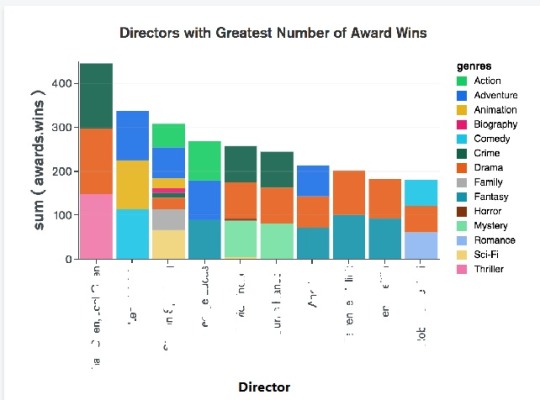
Bar Charts 5. Surface Charts (Graph Surface) This type of graph is very suitable to be used to find the optimal combination of two data sets. For example, in a topographic map or to illustrate the effect of Rainfall (CM) by city Long and Lat.
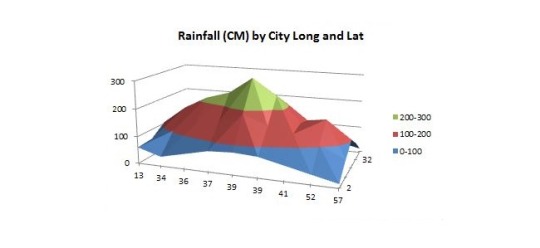
Surface Charts 6. Stock Charts (Graph Stock) Next are stock charts or stock charts. Usually, this type of chart is widely used to describe fluctuations in stock prices. However, not only for describing stocks, but you can also use this type of graph for scientific data, for example, to show temperature fluctuations.
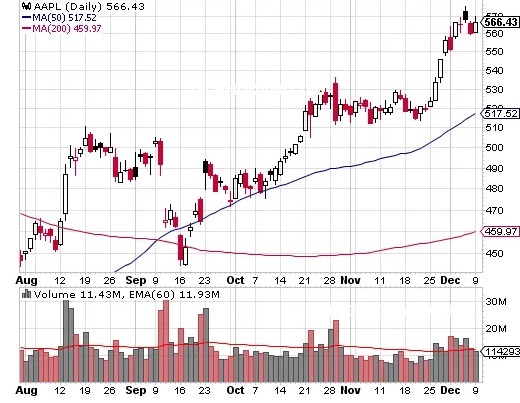
Stock Charts
How to Make Various Types of Charts in Excel
- Open your Microsoft Excel on your System. - Select "Blank Workbook". This means that you will create new data on a blank Excel sheet.
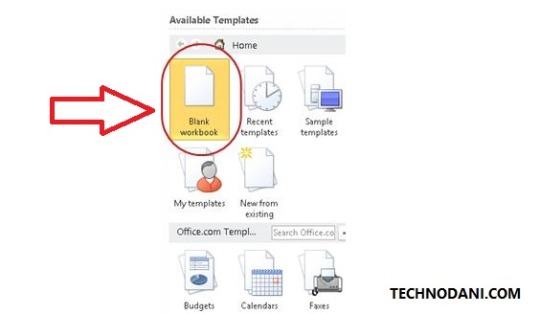
How to Make Various Types of Charts in Excel - Enter the data for which you want to graph. For example, here is made the sales data for several types of cars from January to April. - When all the data is ready, block all the tables you want to chart and select "Insert" from the menu. Now, on the "Insert" menu there are many types of charts that you can choose from. If you are confused about which one, you can try clicking "Recommended Charts".
How to Make Various Types of Charts in Excel - The "Insert Chart" window will automatically appear. In this window, you can see the recommended chart forms and all the chart types available in Excel. The sample chart will also automatically fill in the data from the table that you have created.
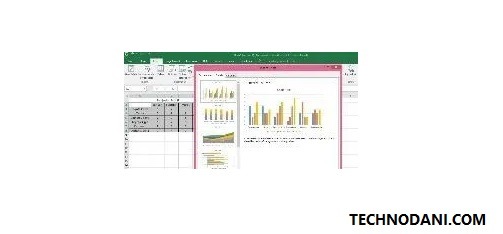
Insert chart - If you feel that the chart options on the "Recommended Charts" tab are not suitable, you can select the "All Charts" tab. You can see all types of charts in Excel on that tab. After selecting a suitable chart, press "OK".
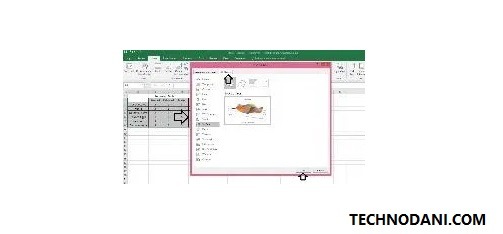
All Charts - After pressing "OK", your chart will automatically appear along with a menu to design it. On the "Design" menu, you can choose the color you want to use along with the table forms. Try them one by one and choose according to your needs.
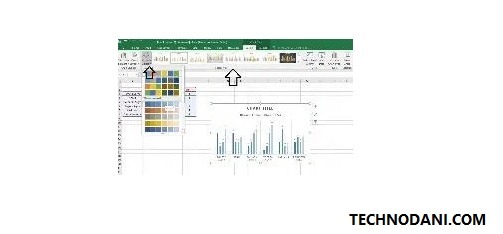
the process of making charts in excel - In the example table, the chart generated automatically by Excel has no title so it says "Chart Title", you can edit it by hovering over the text and pressing it.
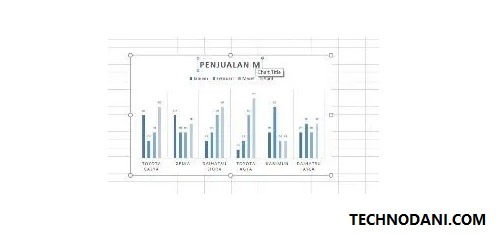
Chart Title - Apart from editing the chart title, you can also change the existing content on the chart through the table that has been created. Once you edit the data in the table, the graph will automatically update the data. You can see the result as an example below.
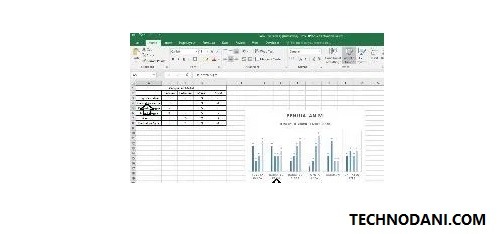
how to make a chart in excel finished
How to Make a Chart in Excel
Graphs or sparklines in Excel are great for showing trends in a series of values, such as highlighting minimum and maximum value cycles, economic cycles, sales results, and more. In addition, it is also great to use sparklines when you don't have enough space to place a large chart. Adding sparklines to the data you are working with will further clarify what is contained therein. Here's how to add sparklines. - Select a blank cell where you want to place the sparkline.
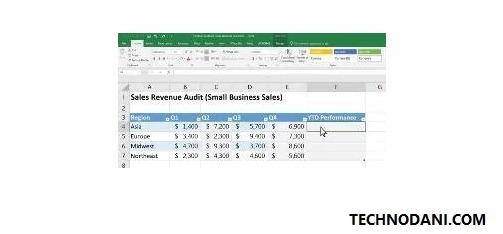
How to Make a Chart in Excel - empty cells - Select "Insert"> "Sparkline". After that, select the sparkline type you want to create such as rows or columns.
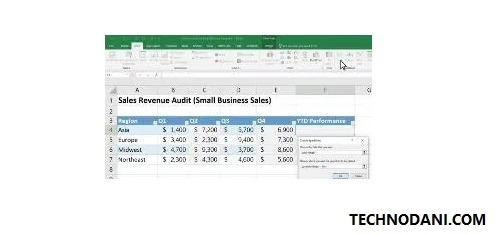
select the sparkline type - Then, select the cells in the row or column you want to chart and press "Ok" when you're done.
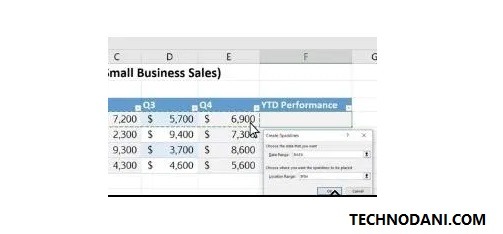
select the cells in the row - If you want all the data in the table to have sparklines, you can simply position the cursor in the lower-left corner of the cell that already contains the graph. When the black plus sign (+) appears, drag it down. Then, automatically all your data will have a sparkline.
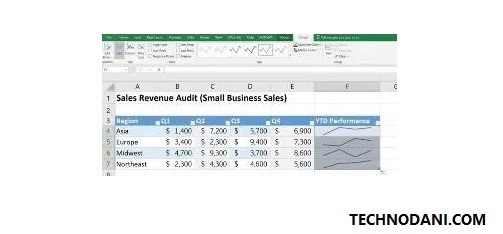
How to Make a Chart in Excel - After all, sparklines have been created, you can also customize the design by pressing the "Design" menu. In the design menu, you can choose the color of the graphic, the shape of the graphic, and so on according to your needs.
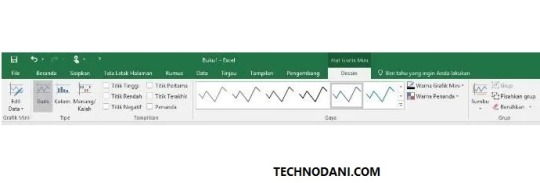
Sparkline design Related Article: How To Draw A Graph In Microsoft Word In 2020 Easily
How to Make a Chart in Excel with 2 Data
- Open Excel and create the data you want to graph. This time we will make an example of temperature comparison data that is measured with different tools.
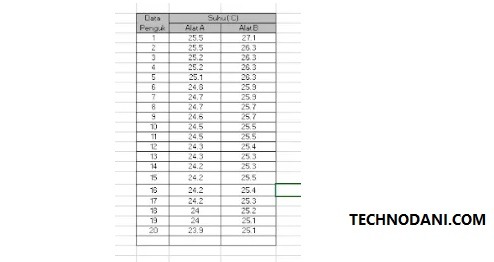
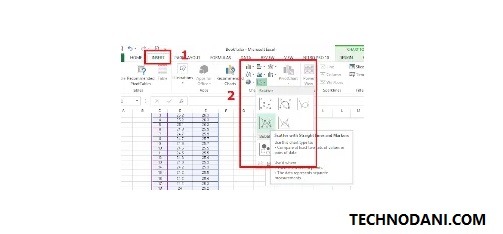
temperature comparison data - Then, place the cursor outside the table and click the "Insert" menu. Then select the desired chart type. In this example, the chart with the type Scatter will be selected.
select the chart type - After that, a blank chart will appear on the worksheet. Click on the graphic and open the "Design" menu. Choose "Select Data".
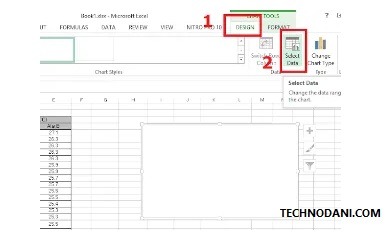
Click the graph - Then "Select Data Source" window will automatically appear. After that, press "Add" and enter your data. In series name, fill in the name of the data, fill in series X with values on the X-axis, and series Y fill with values on the Y-axis. After that, click "OK".
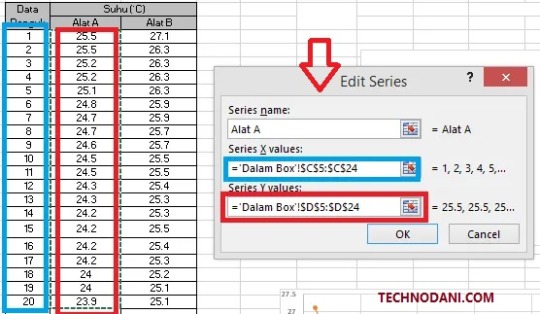
Select Data Source - Do the same for the second data.
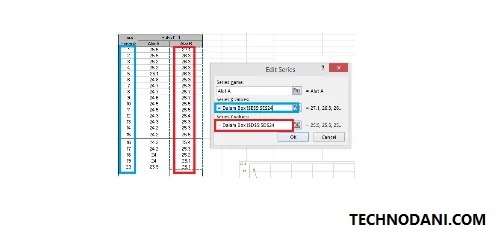
Insert second data - After all, data has been added, click "OK" on the "Select Data Source" window and the chart will appear on your worksheet.
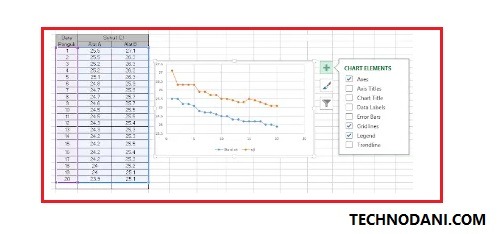
Select Data Source Else watch the video tutorial on how to make Graphs in Excel or How to Make a Chart in Excel.
Conclusion
Well, guys, Graphs in Excel are very widely used by people to explain the data they create. With graphs, people tend to find it easier to read data because it contains text and images. Hopefully, this way of making charts in Excel can help you. Also Read: What is ping test in Games, Internet Speed Test 2021 How to Reduce Photo Size on Computer, Mac, and Android 2021 How to Repair External Hard Drive Corrupted and Unreadable Fix Win & Mac 2021 Read the full article
#BarCharts#chart#chartappearance#chartformatting#chartsinexcel#chooseadesign#CircleChart#ColumnChart#create#createadatatable#different#education#excel#excel2007tutorial#excel2010#excelchartexamples#excelcreatecharts#excelfordummies#exceltutorials#fetchdataintothechart#graph#graphs#how#howto#howtocreateachartinexcel2010#howtocreateachartinexcel2016#howtocreateagraph#howtocreateagraphinexcel#howtocreateapiechartinexcel#HowtoMakeaChartinExcel
0 notes
Text
EJAY DANCE 7 FREE KOSTENLOS DOWNLOADEN
Sie sollte hauptsächlich die Jugendkultur ansprechen. Die Samples ähnelten einzelnen Bausteinen, die per Mausklick je nach Kategorie entweder einen kurzen Rhythmus , ein Bassriff , Effekte , eine Melodie oder irgendwelchen anderen kurzen Instrumentalisierungen oder Sounds abspielten. Mit der Nutzung dieser Website erklären Sie sich damit einverstanden, dass wir Cookies verwenden. Die offizielle URL www. Mixe deine eigenen Dance Hits ganz einfach und in Minuten. Komponiere eigene Bassläufe im Bass Juli um
Name: ejay dance 7 free Format: ZIP-Archiv Betriebssysteme: Windows, Mac, Android, iOS Lizenz: Nur zur personlichen verwendung Größe: 43.40 MBytes
Juli um Die offizielle URL www. Mit dem Programm war es möglich, eigene Musik zu komponieren und zu mischen sowie zu verwalten, hauptsächlich je nach VersionMusikrichtungen wie TechnoRaveDanceHip-Hopaber auch Rock- und Popmusik. Komponiere eigene Bassläufe im Bass Die Version Dance eJay enthält bis zu lizenzfreie Samples, die im so genannten Wave – Editor bearbeitet und verändert frfe können.
Die Software, die weltweit Fans begeistert hat, ist jetzt besser als je zuvor. Durch die Nutzung dieser Website erklären Sie sich mit den Nutzungsbedingungen und der Datenschutzrichtlinie einverstanden.
Nahezu jedes Audioformat können Sie in das Juli um Mit dem Programm war es möglich, eigene Musik zu komponieren und zu mischen sowie zu verwalten, hauptsächlich je nach VersionMusikrichtungen wie TechnoRaveDanceHip-Hopaber auch Rock- und Popmusik.
Ejay Dance | heise Download
Die offizielle URL www. Das Programm bestand aus einer bestimmten Anzahl von Tonspurenauf denen schon fertiggestellte Samples eingesetzt werden können.
Ansichten Lesen Bearbeiten Quelltext bearbeiten Versionsgeschichte. Die Software gilt als besonders benutzerfreundlich und leicht bedienbar und wird deshalb öfters Anfängern und Laien empfohlen.
Erstelle dajce 32 Tonspuren eigene, professionellen Techno-Hits im Chartformat!
youtube
Machen Sie sich nicht verrückt mit den vielen unterschiedlichen Audio-Formaten oder der Frage ob Ihr Abspielgerät diese oder jene Datei lesen kann. Schaffen Sie Platz in Ihrer Tasche! Coole Beatz für Deinen PC!
Die Musik kann auf Rechner exportiert und auf eine CD kopiert werden. Die Samples sind lizenzfrei und werden im Sample-Archiv im Internet kostenlos zur Verfügung gestellt.
eJay Audio Software
Komponiere eigene Bassläufe im Bass August wurde die Internetpräsenz von eJay, als auch die von Empire Interactive entfernt. Du kannst jetzt Deine eigene Sounds kreieren und professionell scratchen. Erstelle ganz einfach deine eigenen Scratches in der Scratch Box.
Dafür musst Du kein Benutzer dieser Software konnten ihre eigenen Tracks auf der Website www. Machen Sie sich nicht verrückt mit den vielen unterschiedlichen Audio-Formaten.
youtube
Mit der Nutzung dieser Website erklären Sie sich damit einverstanden, dass wir Cookies verwenden. Die neue verbesserte Version gibt Dir alles an die Hand um coole und mitreisende Hiermit verwandelst Du jeden PC oder Notebook in In der Datenschutzerklärung erfahren Sie mehr. Mixe deine eigenen Dance Hits ganz einfach und in Minuten.
Möglicherweise unterliegen die Inhalte jeweils zusätzlichen Bedingungen.
Ejay Dance
Die Version Dance eJay enthält bis zu lizenzfreie Samples, die im so genannten Wave – Editor bearbeitet und verändert werden können. Die Samples ähnelten einzelnen Bausteinen, die per Mausklick je nach Kategorie entweder einen kurzen Rhythmusein BassriffEffekteeine Melodie oder irgendwelchen anderen kurzen Instrumentalisierungen oder Sounds abspielten. Diese Seite wurde zuletzt am Dabei hast Du Zugriff auf über Wöchentlich werden 20 neue Sounds hinzugefügt und können in die Software eingebunden werden.
Mixe deine eigenen Dance Hits ganz einfach und in Minuten auf 48 Tonspuren, mit 5. Sie sollte hauptsächlich die Jugendkultur ansprechen.
youtube
The post EJAY DANCE 7 FREE KOSTENLOS DOWNLOADEN appeared first on Mezitli.
source http://mezitli.info/ejay-dance-7-free-80/
0 notes