#but id guess the on ice has to do with the way theyre impacting teammates/setting ppl up/making smart decisions
Explore tagged Tumblr posts
Visit Tumblr Blog
Explore Tumblr blogs with no restrictions, modern design and the best experience.
Last Seen Tumblr Blogs


Fun Fact
Mobile Tumblr US users spend an average of 4.04 minutes per session on the app.
Note
could you pls explain the bar graph thingy that you post after games? i can’t for the life of me figure it out and i feel silly…like is ‘longer’ a good thing? like mo and mr liljegren had very long ones tonight does that mean they were playing the best or the most or neither or both??

LOLLLL, it's okay. it's a pretty simplistic chart to break down player performance per game and it's done by @ hockeystatcard on twitter, who's great. they use this guy's algorithm and this account's data to visualize players impacts on the game.

so looking at tonight's chart... the y axis has all the players names and if you look along the bottom (x axis), there are numbers from -3 to 1.5. being in the negative quite literally means they're having a negative impact in the areas as indicated by the colors. the key along the bottom tells you what those colors mean. so like brodie and liljegren were both particularly terrible with on ice offense AND on ice defense, more so than anyone else on the team.... by a lot. if you go to the top, jt had almost an entirely positive impact on the team and was statistically the best player (players are in order of their 'gamescore' which is like a composite number based on their positive and negative impacts on the game). you could infer this because he scored the only goal, but it's not JUST that that contributes to the score. even less flashy stats like being defensively responsible (aka if the other team is getting less grade a chances when ur out there or if youre blocking shots or taking pucks away or whatever.. all that goes into it i believe) or penalty killing
i'm not a statistician, nor do i look at natural stat trick's individual data, so i'm not the best at discerning every individual stat that goes into those bars bc it can get really complicated. i mostly just use those charts as a gauge to see if the eye test as i was watching matches what the stats say in terms of the players who were the most influential and impactful on the game in both positive and negative ways. like two players had a terrible impact on us tonight sadly and it cost us.... many goals. i'd guess based on that chart that tj and lily were out there for multiple goals against.
if you want to see some examples from the other night... here are the stat cards of the oilers and the penguins game that ended up being 6-1 oilers
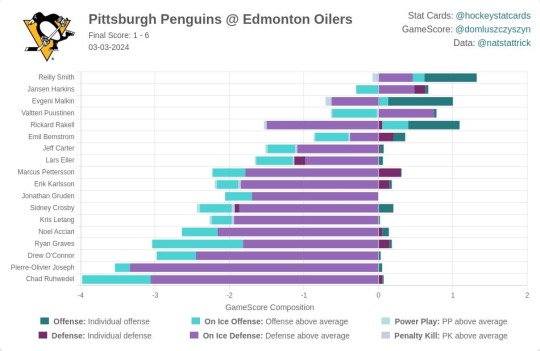

the pens are almost all net negative, with the biggest bar reaching into the negatives being purple aka defense, and the oilers are almost all net positive, with a lot of bars into the positive being defense (bc they didnt let the pens score much) but ALSO offense bc they scored a lot of goals.
i hope any of this makes sense. i'm half asleep and very removed from schooling of any kind at this point, so i fear i'm not the best at explaining and prob have a rather simplistic understanding of this but..... data isn't EVERYTHING, but i do feel like these can explain player performance and production.
#easks#anyway#hockeystats#if i were more awake#id go onto naturalstattrick and look at the individual stats that go into that stuff but fbemfhekdhdek#data can be so fascinating and useful hekkd but VIBES ALSO ACCOUNT FOR SOME THINGS#SOME GAMES i just watch someone and i know theyre doing awful and this confirms it for me a LOT hfjsjd or vice versa#also dont ask me the exact different between 'on ice' vs 'individual' for offense and defense#individual obv means like . are they shooting at the net by themselves. are they blocking shots#but id guess the on ice has to do with the way theyre impacting teammates/setting ppl up/making smart decisions#that lead to good ozone time or no high danger chances defensively
14 notes
·
View notes