#assignment9
Explore tagged Tumblr posts
Visit Tumblr Blog
Explore Tumblr blogs with no restrictions, modern design and the best experience.
Last Seen Tumblr Blogs


Fun Fact
In 2020, 27% of US Tumblr users had an annual household income of over $100,000.
Text
Module 9 Assignment
Question 1:
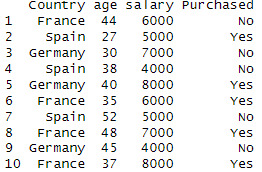
Generate a simple table in R that consists of four rows: Country, age, salary, and purchased.
Using the "data.frame" input provided, R computes a table with 10 rows and 4 columns. To convert this into a table with 4 rows and 10 columns, we use the "t()" function, which transposes our data frame. To keep both forms of the data, I stored "t(assignment_data)" inside a new variable called "tassignment_data". The result is shown below.

Question 2:
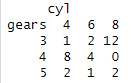
Generate contingency table also known as rx C table using mtcars dataset.
Using the code "assignment9 < - table(mtcars$gear, mtcars$cyl, dnn=c("gears", "cyl"))" I created the following contingency table:

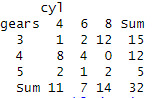
2.1) Add the addmargins() function to report on the sum totals of the rows and columns of the assignment9 table.
The sum of each row and column is shown at the bottom/far right end of each.

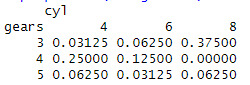
2.2) Add prop.table() function, and report on the proportional weight of each value in the assignment9 table.
Using "prop.table(assignment9)", the proportional weight of each value is calculated and shown below.

2.3) Add margin = 1 to the argument under prop.table() function, and report on the row proportions found in assignment9 table.
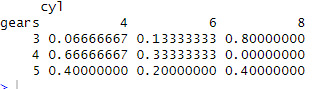
I used the input "prop.table(assignment9, margin = 1)" to calculate and report the row proportions. The result is shown below.

0 notes
Text
Module 9 Assignment
assignment_data <- data.frame( Country = c("France","Spain","Germany","Spain","Germany", "France","Spain","France","Germany","France"), age = c(44,27,30,38,40,35,52,48,45,37), salary = c(6000,5000,7000,4000,8000), Purchased=c("No","Yes","No","No","Yes", "Yes","No","Yes","No","Yes"))
data <- assignment_data data
assignment9 <- table(mtcars$gear, mtcars$cyl, dnn =c("gears","cyl")) assignment9
addmargins(assignment9)
prop.table(assignment9)
prop.table(assignment9,margin = 1)
0 notes


Text
Assignment #9
Permanence - In our particular set-up, we invite the audience to come and occupy chairs to sit around other actors in the scene. This will hopefully allow audience members to feel like they are not being spectated, but rather are actual participants in the scene.
Play Space Transformation - Because our scene takes place in a classroom, we've added a classroom background, and plan to play "Exam noises" aka pencil tapping, paper flipping, etc. We've also instructed our actors to behave like they were in an classroom to enhance the ambiance.
Spatial Layout - I mentioned this above but we've integrated audience seats within the actors seats in a "classroom" setting. This, we hope, will make audience members less nervous about participating because they aren't being watched.
Light and Sound - Whenever we have a a character speaking to the other audience members, we plan to preface it with a "PSST" and hopefully aim a spotlight at that character. We want to avoid breaking the fourth wall (because the audience is a part of the scene) but we have to try to establish rules for player/audience interaction.
Temperature - We haven't thought much about this! I'm not sure how we might control the temperature in our theater space.
Visual Management - I don't believe memory tax will be an issue because all audience members will be immersed within the scene.
The L Train Shutdown
-I chose the L train shut down because of the rapidly changing decisions being made about that particular line and how its effecting the lives of folks who live along those lines. While the residents of NYC are almost unanimously outraged, figures like Cuomo have different opinions, and even further, the MTA has another perspective. Also, I wanted to see how the opinions of other states or even countries might react to something as local as a NYC subway issue, thought ultimately I had a hard time finding outside NY commentary.
- https://www.nytimes.com/2019/04/01/realestate/moving-for-the-l-train.html?searchResultPosition=27
- http://library.rpa.org/pdf/RPA-Improving-the-L-train-Shutdown.pdf
- https://www.nydailynews.com/new-york/ny-metro-l-train-slow-down-20190111-story.html
https://www.nbcnewyork.com/news/local/L-Train-Shutdown-Repair-Project-Governor-Cuomo-Tours-Canarsie-Tunnel-502746952.html
Show review
My favorite show to date is Say Something Bunny. The audience are all assigned characters and sat around a table with a script in front of them. Even though audience members are assigned characters they aren't required to speak or perform, but rather, are gestured to when they speak their roles. Assigning these roles dramatically helped bring audience members closer into the story, in my experience. Talking to other audience members after the show, it seemed that we all felt particularly drawn to our character and invested in the story for that reason. The show was also so incredible because of the multi media used. Alison uses props, real voice recordings, and photos to further the narrative. She manages to make the story feel as if it’s a mystery to be solved with the audience, and she's presenting you with evidence along the way. An incredible show! I highly recommend it.
0 notes
Text
module 9, assignment 9, tabular data
in this module we learned about representing tabular data using R, learning the differences between contingency tables and data frames.
1. Your data.frame is
> assignment_data <- data.frame( Country = c("France","Spain","Germany","Spain","Germany", "France","Spain","France","Germany","France"), age = c(44,27,30,38,40,35,52,48,45,37), salary = c(6000,5000,7000,4000,8000), Purchased=c("No","Yes","No","No","Yes", "Yes","No","Yes","No","Yes"))
Generate simple table in R that consists of four rows: Country, age, salary and purchased.

2. Generate contingency table also know as r x c table (Chapter 7, p.135) using mtcars dataset.
>assignment9 <- table(mtcars$gear, mtcars$cyl, dnn=c("fill out here")

2.1 Add the addmargins() function to report on the sum totals of the rows and columns of assignment9 table >addmargins(assignment9)

2.2 Add prop.tables() function, and report on the proportional weight of each value in a assignment9 table

2.3 Add margin = 1 to the argument under prop.table() function, and report on the row proportions found in assignment9 table.

0 notes
Text
Module # 9 assignment: LIS4273.720F21
Q1:
With the provided dataframe a four row table can be produced resulting in this structure:
, , salary = 4000, Purchased = No age Country 27 30 35 37 38 40 44 45 48 52 France 0 0 0 0 0 0 0 0 0 0 Germany 0 0 0 0 0 0 0 1 0 0 Spain 0 0 0 0 1 0 0 0 0 0
, , salary = 5000, Purchased = No age Country 27 30 35 37 38 40 44 45 48 52 France 0 0 0 0 0 0 0 0 0 0 Germany 0 0 0 0 0 0 0 0 0 0 Spain 0 0 0 0 0 0 0 0 0 1
, , salary = 6000, Purchased = No age Country 27 30 35 37 38 40 44 45 48 52 France 0 0 0 0 0 0 1 0 0 0 Germany 0 0 0 0 0 0 0 0 0 0 Spain 0 0 0 0 0 0 0 0 0 0
, , salary = 7000, Purchased = No age Country 27 30 35 37 38 40 44 45 48 52 France 0 0 0 0 0 0 0 0 0 0 Germany 0 1 0 0 0 0 0 0 0 0 Spain 0 0 0 0 0 0 0 0 0 0
, , salary = 8000, Purchased = No age Country 27 30 35 37 38 40 44 45 48 52 France 0 0 0 0 0 0 0 0 0 0 Germany 0 0 0 0 0 0 0 0 0 0 Spain 0 0 0 0 0 0 0 0 0 0
, , salary = 4000, Purchased = Yes age Country 27 30 35 37 38 40 44 45 48 52 France 0 0 0 0 0 0 0 0 0 0 Germany 0 0 0 0 0 0 0 0 0 0 Spain 0 0 0 0 0 0 0 0 0 0
, , salary = 5000, Purchased = Yes age Country 27 30 35 37 38 40 44 45 48 52 France 0 0 0 0 0 0 0 0 0 0 Germany 0 0 0 0 0 0 0 0 0 0 Spain 1 0 0 0 0 0 0 0 0 0
, , salary = 6000, Purchased = Yes age Country 27 30 35 37 38 40 44 45 48 52 France 0 0 1 0 0 0 0 0 0 0 Germany 0 0 0 0 0 0 0 0 0 0 Spain 0 0 0 0 0 0 0 0 0 0
, , salary = 7000, Purchased = Yes age Country 27 30 35 37 38 40 44 45 48 52 France 0 0 0 0 0 0 0 0 1 0 Germany 0 0 0 0 0 0 0 0 0 0 Spain 0 0 0 0 0 0 0 0 0 0
, , salary = 8000, Purchased = Yes age Country 27 30 35 37 38 40 44 45 48 52 France 0 0 0 1 0 0 0 0 0 0 Germany 0 0 0 0 0 1 0 0 0 0 Spain 0 0 0 0 0 0 0 0 0 0
Despite the large size of the table it contains all of the necessary information that was in the dataframe in a format that can be relatively easily scanned through. I believe this is as simple as a four dimensional table can be represented.
As extra information each of the individual dataframe columns are represented as a table with their structure as such:
Country France Germany Spain 4 3 3
Age 27 30 35 37 38 40 44 45 48 52 1 1 1 1 1 1 1 1 1 1
Salary 4000 5000 6000 7000 8000 2 2 2 2 2
Purchased No Yes 5 5
Q2:
The table of the mtcars$gears vector and the mtcars$cyl vector results in a table of this structure: cyl gears 4 6 8 3 1 2 12 4 8 4 0 5 2 1 2
2.1 The assignment9 table run through the addmargins function results in a table with row sums of 15,12,5 column sums of 11,7,14 and a total sum of 32 as shown below. cyl gears 4 6 8 Sum 3 1 2 12 15 4 8 4 0 12 5 2 1 2 5 Sum 11 7 14 32
2.2 The prop.table function on the assignment9 table provided the proportion that each index is over the whole. There are 1 four cylinder 3 gear vehicle and 32 total vehicles, 1/32 = 0.03125 which is the result in the first index. This process is repeated for all indexes. cyl gears 4 6 8 3 0.03125 0.06250 0.37500 4 0.25000 0.12500 0.00000 5 0.06250 0.03125 0.06250
2.3 Much like 2.2 the same function is called but thistime with a margin of one, the causes the function to take the part over the sum of the row rather than the whole such that instead of index one being 1/32 it is now 1/15 resulting in the shown 0.06666667. This process is repeated for all indexes and their current row. cyl gears 4 6 8 3 0.06666667 0.13333333 0.80000000 4 0.66666667 0.33333333 0.00000000 5 0.40000000 0.20000000 0.40000000
Code:
cat("\014")
#Q1 assignment_data <- data.frame(Country = c("France","Spain","Germany","Spain","Germany", "France","Spain","France","Germany","France"), age = c(44,27,30,38,40,35,52,48,45,37), salary = c(6000,5000,7000,4000,8000), Purchased=c("No","Yes","No","No","Yes", "Yes","No","Yes","No","Yes")) print(table(assignment_data)) print(table(assignment_data$Country)) print(table(assignment_data$age)) print(table(assignment_data$salary)) print(table(assignment_data$Purchased))
#Q2 assignment9 <- table(mtcars$gear, mtcars$cyl, dnn=c("gears","cyl")) print(assignment9) #Q2.1 print(addmargins(assignment9)) #Q2.2 print(prop.table(assignment9)) #Q2.3 print(prop.table(assignment9, margin=1))
0 notes
Text
1. Your data.frame is
> assignment_data <- data.frame( Country = c("France","Spain","Germany","Spain","Germany", "France","Spain","France","Germany","France"), age = c(44,27,30,38,40,35,52,48,45,37), salary = c(6000,5000,7000,4000,8000), Purchased = c("No","Yes","No","No","Yes", "Yes","No","Yes","No","Yes"))
Generate simple table in R that consists of four rows: Country, age, salary and purchased.

2. Generate contingency table also known as rx C table using mtcars dataset.
>assignment9 <- table(mtcars$gear, mtcars$cyl, dnn=c("gears",”cyl”)) a. Add the addmargins() function to report on the sum totals of the rows and columns of assignment9 table >addmargins(assignment9)
b. Add prop.tables() function, and report on the proportional weight of each value in assignment9 table c. Add margin = 1 to the argument under prop.table() function, and report on the row proportions found in assignment9 table.

0 notes
Text
ITIS/CS 5180 Assignment9-Google Maps Solved
ITIS/CS 5180 Assignment9-Google Maps Solved
In this assignment you will interface Google Maps into your app, and include poly lines and markers in the app. Part 1: Create an activity and include Google maps in this activity. Follow all the instructions indicated in the Google Maps documentation. Part 2: You are provided with a “trip.json” file, which should be added to your project as follows: Create a “raw” folder under the “res”…

View On WordPress
0 notes
Photo

ASSIGNMENT9, WEEK 12: Don’t Forget About Light
ISO 100, 30mm, f4.5, 1/160
I liked the contrast in these next two that the light created. I emphasized the contrast in my edits of these two photos.
0 notes

Text
Day 9 Reflection- also on doc
Today, in class, we watched 2 Ted Talk videos on how to be successful. Both videos talked about the same concept of how grit, passion, and perseverance are the main driving forces behind success. It also talks about how people who have been through hard times react better to failure and can endure worse conditions because they have experienced and learned from their past. The speaker of the first video emphasized on grit and how some of her less intelligent did better on tests than her more intelligent ones because they seemed to have more grit. I agree with her argument, but only to some extent. I think that test scores only prove intelligence to some extent and don’t necessarily reflect on how successful someone is going to be in the future. For example, many of the most successful people in the world such as Mark Zuckerberg and Steve Jobs are actually college dropouts. However, it is important to know that it is not because they dropped out and had grit that they succeeded, but rather because they already had the passion and were persevered to fulfill their goals. Steve Jobs once said that it is really important to have passion “because it is so hard that if you don’t, any rational person would give up”. This is very true because to succeed, you have to do something so an extended period of time and it is really hard to not give up something that you are not very passionate about. The second video was more about comparing the differences between people who are ‘silver spoons’ and ‘scrappers’. Silver spoons are people who think that they area under all the right circumstances to succeed and follow the existing system and follow the ‘safe road’. Scrappers are people who fight their way through and therefore are better with enduring hard times. She says that people should be scrappers because they are the ones that succeed. I think her argument is only somewhat valid because there are also many scrappers who don’t succeed. I think that when scrappers do succeed, they succeed largely, but also when they fail, they fail hard. However, the people who she considers ‘silver spoons’ take a safer road and have a higher chance of succeeding although they may not be extremely successful. Frankly, I feel that I am more of a silver spoon than a scrapper. I think that, although I don’t want to be a complete scrapper, I should take more risks and get involved in new experiences. After watching the videos we began our University research. The university that I chose was UC Berkeley because it is among the less expensive out of the top engineering schools in the world. Also, it is in California which is where I would like to go for university. Making the poster based on the university was the most challenging and took the most amount of work. I didn’t necessarily enjoy doing the research for it, but did learn lots about UC Berkeley because I had to probe to lots and lots of different websites to gain the necessary information. Overall, the assignment was very strenuous and probably the most taxing moment of Planning 10, but because of this I feel that I also gained a lot of insight.
0 notes
Text
COL216 Assignment9-Overcoming Data Hazards in a Pipelined Processor Solved
COL216 Assignment9-Overcoming Data Hazards in a Pipelined Processor Solved
Overcoming Data Hazards in a Pipelined Processor The pipelined processor does not function efficiently if it is stalled on every hazard. Use the ideas discussed in class to overcome data hazards in your processor simulation. (Ignore branch hazards). Compare the performance (in clock cycles) of the two processors simulated in Assignments 8 and

View On WordPress
0 notes
Link
*
0 notes
