#and only roughly 200 kilowatt hours for each person
Explore tagged Tumblr posts
Visit Tumblr Blog
Explore Tumblr blogs with no restrictions, modern design and the best experience.
Last Seen Tumblr Blogs


Fun Fact
The Tumblr office adopted Tommy, an 11-year-old Pomeranian.
Text


🙃
#the silt verses#tsv#tsv spoilers#it's only lights#not even people#and only roughly 200 kilowatt hours for each person#i'm fine it's fine
53 notes
·
View notes
Text
Sustainable Web Design, An Excerpt
In the 1950s, many in the elite running community had begun to believe it wasn’t possible to run a mile in less than four minutes. Runners had been attempting it since the late 19th century and were beginning to draw the conclusion that the human body simply wasn’t built for the task.
But on May 6, 1956, Roger Bannister took everyone by surprise. It was a cold, wet day in Oxford, England—conditions no one expected to lend themselves to record-setting—and yet Bannister did just that, running a mile in 3:59.4 and becoming the first person in the record books to run a mile in under four minutes.
This shift in the benchmark had profound effects; the world now knew that the four-minute mile was possible. Bannister’s record lasted only forty-six days, when it was snatched away by Australian runner John Landy. Then a year later, three runners all beat the four-minute barrier together in the same race. Since then, over 1,400 runners have officially run a mile in under four minutes; the current record is 3:43.13, held by Moroccan athlete Hicham El Guerrouj.
We achieve far more when we believe that something is possible, and we will believe it’s possible only when we see someone else has already done it—and as with human running speed, so it is with what we believe are the hard limits for how a website needs to perform.
Establishing standards for a sustainable web
In most major industries, the key metrics of environmental performance are fairly well established, such as miles per gallon for cars or energy per square meter for homes. The tools and methods for calculating those metrics are standardized as well, which keeps everyone on the same page when doing environmental assessments. In the world of websites and apps, however, we aren’t held to any particular environmental standards, and only recently have gained the tools and methods we need to even make an environmental assessment.
The primary goal in sustainable web design is to reduce carbon emissions. However, it’s almost impossible to actually measure the amount of CO2 produced by a web product. We can’t measure the fumes coming out of the exhaust pipes on our laptops. The emissions of our websites are far away, out of sight and out of mind, coming out of power stations burning coal and gas. We have no way to trace the electrons from a website or app back to the power station where the electricity is being generated and actually know the exact amount of greenhouse gas produced. So what do we do?
If we can’t measure the actual carbon emissions, then we need to find what we can measure. The primary factors that could be used as indicators of carbon emissions are:
Data transfer
Carbon intensity of electricity
Let’s take a look at how we can use these metrics to quantify the energy consumption, and in turn the carbon footprint, of the websites and web apps we create.
Data transfer
Most researchers use kilowatt-hours per gigabyte (kWh/GB) as a metric of energy efficiency when measuring the amount of data transferred over the internet when a website or application is used. This provides a great reference point for energy consumption and carbon emissions. As a rule of thumb, the more data transferred, the more energy used in the data center, telecoms networks, and end user devices.
For web pages, data transfer for a single visit can be most easily estimated by measuring the page weight, meaning the transfer size of the page in kilobytes the first time someone visits the page. It’s fairly easy to measure using the developer tools in any modern web browser. Often your web hosting account will include statistics for the total data transfer of any web application (Fig 2.1).

Fig 2.1: The Kinsta hosting dashboard displays data transfer alongside traffic volumes. If you divide data transfer by visits, you get the average data per visit, which can be used as a metric of efficiency.
The nice thing about page weight as a metric is that it allows us to compare the efficiency of web pages on a level playing field without confusing the issue with constantly changing traffic volumes.
Reducing page weight requires a large scope. By early 2020, the median page weight was 1.97 MB for setups the HTTP Archive classifies as “desktop” and 1.77 MB for “mobile,” with desktop increasing 36 percent since January 2016 and mobile page weights nearly doubling in the same period (Fig 2.2). Roughly half of this data transfer is image files, making images the single biggest source of carbon emissions on the average website.
History clearly shows us that our web pages can be smaller, if only we set our minds to it. While most technologies become ever more energy efficient, including the underlying technology of the web such as data centers and transmission networks, websites themselves are a technology that becomes less efficient as time goes on.
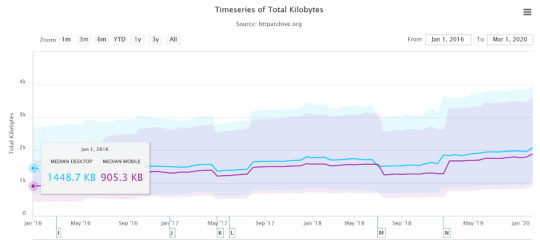
Fig 2.2: The historical page weight data from HTTP Archive can teach us a lot about what is possible in the future.
You might be familiar with the concept of performance budgeting as a way of focusing a project team on creating faster user experiences. For example, we might specify that the website must load in a maximum of one second on a broadband connection and three seconds on a 3G connection. Much like speed limits while driving, performance budgets are upper limits rather than vague suggestions, so the goal should always be to come in under budget.
Designing for fast performance does often lead to reduced data transfer and emissions, but it isn’t always the case. Web performance is often more about the subjective perception of load times than it is about the true efficiency of the underlying system, whereas page weight and transfer size are more objective measures and more reliable benchmarks for sustainable web design.
We can set a page weight budget in reference to a benchmark of industry averages, using data from sources like HTTP Archive. We can also benchmark page weight against competitors or the old version of the website we’re replacing. For example, we might set a maximum page weight budget as equal to our most efficient competitor, or we could set the benchmark lower to guarantee we are best in class.
If we want to take it to the next level, then we could also start looking at the transfer size of our web pages for repeat visitors. Although page weight for the first time someone visits is the easiest thing to measure, and easy to compare on a like-for-like basis, we can learn even more if we start looking at transfer size in other scenarios too. For example, visitors who load the same page multiple times will likely have a high percentage of the files cached in their browser, meaning they don’t need to transfer all of the files on subsequent visits. Likewise, a visitor who navigates to new pages on the same website will likely not need to load the full page each time, as some global assets from areas like the header and footer may already be cached in their browser. Measuring transfer size at this next level of detail can help us learn even more about how we can optimize efficiency for users who regularly visit our pages, and enable us to set page weight budgets for additional scenarios beyond the first visit.
Page weight budgets are easy to track throughout a design and development process. Although they don’t actually tell us carbon emission and energy consumption analytics directly, they give us a clear indication of efficiency relative to other websites. And as transfer size is an effective analog for energy consumption, we can actually use it to estimate energy consumption too.
In summary, reduced data transfer translates to energy efficiency, a key factor to reducing carbon emissions of web products. The more efficient our products, the less electricity they use, and the less fossil fuels need to be burned to produce the electricity to power them. But as we’ll see next, since all web products demand some power, it’s important to consider the source of that electricity, too.
Carbon intensity of electricity
Regardless of energy efficiency, the level of pollution caused by digital products depends on the carbon intensity of the energy being used to power them. Carbon intensity is a term used to define the grams of CO2 produced for every kilowatt-hour of electricity (gCO2/kWh). This varies widely, with renewable energy sources and nuclear having an extremely low carbon intensity of less than 10 gCO2/kWh (even when factoring in their construction); whereas fossil fuels have very high carbon intensity of approximately 200–400 gCO2/kWh.
Most electricity comes from national or state grids, where energy from a variety of different sources is mixed together with varying levels of carbon intensity. The distributed nature of the internet means that a single user of a website or app might be using energy from multiple different grids simultaneously; a website user in Paris uses electricity from the French national grid to power their home internet and devices, but the website’s data center could be in Dallas, USA, pulling electricity from the Texas grid, while the telecoms networks use energy from everywhere between Dallas and Paris.
We don’t have control over the full energy supply of web services, but we do have some control over where we host our projects. With a data center using a significant proportion of the energy of any website, locating the data center in an area with low carbon energy will tangibly reduce its carbon emissions. Danish startup Tomorrow reports and maps this user-contributed data, and a glance at their map shows how, for example, choosing a data center in France will have significantly lower carbon emissions than a data center in the Netherlands (Fig 2.3).
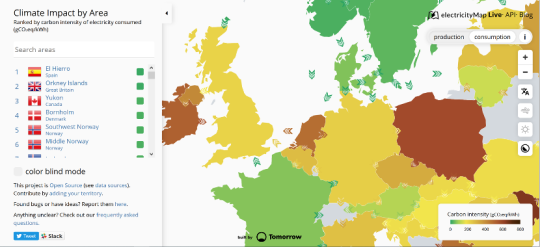
Fig 2.3: Tomorrow’s electricityMap shows live data for the carbon intensity of electricity by country.
That said, we don’t want to locate our servers too far away from our users; it takes energy to transmit data through the telecom’s networks, and the further the data travels, the more energy is consumed. Just like food miles, we can think of the distance from the data center to the website’s core user base as “megabyte miles”—and we want it to be as small as possible.
Using the distance itself as a benchmark, we can use website analytics to identify the country, state, or even city where our core user group is located and measure the distance from that location to the data center used by our hosting company. This will be a somewhat fuzzy metric as we don’t know the precise center of mass of our users or the exact location of a data center, but we can at least get a rough idea.
For example, if a website is hosted in London but the primary user base is on the West Coast of the USA, then we could look up the distance from London to San Francisco, which is 5,300 miles. That’s a long way! We can see that hosting it somewhere in North America, ideally on the West Coast, would significantly reduce the distance and thus the energy used to transmit the data. In addition, locating our servers closer to our visitors helps reduce latency and delivers better user experience, so it’s a win-win.
Converting it back to carbon emissions
If we combine carbon intensity with a calculation for energy consumption, we can calculate the carbon emissions of our websites and apps. A tool my team created does this by measuring the data transfer over the wire when loading a web page, calculating the amount of electricity associated, and then converting that into a figure for CO2 (Fig 2.4). It also factors in whether or not the web hosting is powered by renewable energy.
If you want to take it to the next level and tailor the data more accurately to the unique aspects of your project, the Energy and Emissions Worksheet accompanying this book shows you how.

Fig 2.4: The Website Carbon Calculator shows how the Riverford Organic website embodies their commitment to sustainability, being both low carbon and hosted in a data center using renewable energy.
With the ability to calculate carbon emissions for our projects, we could actually take a page weight budget one step further and set carbon budgets as well. CO2 is not a metric commonly used in web projects; we’re more familiar with kilobytes and megabytes, and can fairly easily look at design options and files to assess how big they are. Translating that into carbon adds a layer of abstraction that isn’t as intuitive—but carbon budgets do focus our minds on the primary thing we’re trying to reduce, and support the core objective of sustainable web design: reducing carbon emissions.
Browser Energy
Data transfer might be the simplest and most complete analog for energy consumption in our digital projects, but by giving us one number to represent the energy used in the data center, the telecoms networks, and the end user’s devices, it can’t offer us insights into the efficiency in any specific part of the system.
One part of the system we can look at in more detail is the energy used by end users’ devices. As front-end web technologies become more advanced, the computational load is increasingly moving from the data center to users’ devices, whether they be phones, tablets, laptops, desktops, or even smart TVs. Modern web browsers allow us to implement more complex styling and animation on the fly using CSS and JavaScript. Furthermore, JavaScript libraries such as Angular and React allow us to create applications where the “thinking” work is done partly or entirely in the browser.
All of these advances are exciting and open up new possibilities for what the web can do to serve society and create positive experiences. However, more computation in the user’s web browser means more energy used by their devices. This has implications not just environmentally, but also for user experience and inclusivity. Applications that put a heavy processing load on the user’s device can inadvertently exclude users with older, slower devices and cause batteries on phones and laptops to drain faster. Furthermore, if we build web applications that require the user to have up-to-date, powerful devices, people throw away old devices much more frequently. This isn’t just bad for the environment, but it puts a disproportionate financial burden on the poorest in society.
In part because the tools are limited, and partly because there are so many different models of devices, it’s difficult to measure website energy consumption on end users’ devices. One tool we do currently have is the Energy Impact monitor inside the developer console of the Safari browser (Fig 2.5).
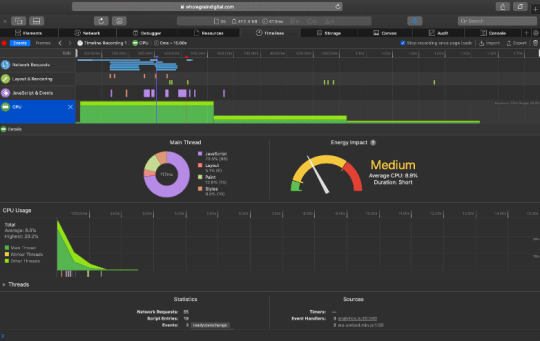
Fig 2.5: The Energy Impact meter in Safari (on the right) shows how a website consumes CPU energy.
You know when you load a website and your computer’s cooling fans start spinning so frantically you think it might actually take off? That’s essentially what this tool is measuring.
It shows us the percentage of CPU used and the duration of CPU usage when loading the web page, and uses these figures to generate an energy impact rating. It doesn’t give us precise data for the amount of electricity used in kilowatts, but the information it does provide can be used to benchmark how efficiently your websites use energy and set targets for improvement.
Sustainable Web Design, An Excerpt published first on https://deskbysnafu.tumblr.com/
0 notes
Text
Our love of the cloud is making a green energy future impossible
Mark Mills Contributor
Share on Twitter
Mark Mills is the author of the book, “Digital Cathedrals: The Information Infrastructure Era,” and is a senior fellow at the Manhattan Institute, a Faculty Fellow at Northwestern University’s McCormick School of Engineering, and a partner in Cottonwood Venture Partners, an energy-tech venture fund.
An epic number of citizens are video-conferencing to work in these lockdown times. But as they trade in a gas-burning commute for digital connectivity, their personal energy use for each two hours of video is greater than the share of fuel they would have consumed on a four-mile train ride. Add to this, millions of students ‘driving’ to class on the internet instead of walking.
Meanwhile in other corners of the digital universe, scientists furiously deploy algorithms to accelerate research. Yet, the pattern-learning phase for a single artificial intelligence application can consume more compute energy than 10,000 cars do in a day.
This grand ‘experiment’ in shifting societal energy use is visible, at least indirectly, in one high-level fact set. By the first week of April, U.S. gasoline use had collapsed by 30 percent, but overall electric demand was down less than seven percent. That dynamic is in fact indicative of an underlying trend for the future. While transportation fuel use will eventually rebound, real economic growth is tied to our electrically fueled digital future.
The COVID-19 crisis highlights just how much more sophisticated and robust the 2020 internet is from what existed as recently as 2008 when the economy last collapsed, an internet ‘century’ ago. If a national lockdown had occurred back then, most of the tens of millions who now telecommute would have joined the nearly 20 million who got laid off. Nor would it have been nearly as practical for universities and schools to have tens of millions of students learning from home.
Analysts have widely documented massive increases in internet traffic from all manner of stay-at-home activities. Digital traffic measures have spiked for everything from online groceries to video games and movie streaming. So far, the system has ably handled it all, and the cloud has been continuously available, minus the occasional hiccup.
There’s more to the cloud’s role during the COVID-19 crisis than one-click teleconferencing and video chatting. Telemedicine has finally been unleashed. And we’ve seen, for example, apps quickly emerge to help self-evaluate symptoms and AI tools put to work to enhance X-ray diagnoses and to help with contact tracing. The cloud has also allowed researchers to rapidly create “data lakes” of clinical information to fuel the astronomical capacities of today’s supercomputers deployed in pursuit of therapeutics and vaccines.
The future of AI and the cloud will bring us a lot more of the above, along with practical home diagnostics and useful VR-based telemedicine, not to mention hyper-accelerated clinical trials for new therapies. And this says nothing about what the cloud will yet enable in the 80 percent of the economy that’s not part of healthcare.
For all of the excitement that these new capabilities offer us though, the bedrock behind all of that cloud computing will remain consistent — and consistently increasing — demand for energy. Far from saving energy, our AI-enabled workplace future uses more energy than ever before, a challenge the tech industry rapidly needs to assess and consider in the years ahead.
The new information infrastructure
The cloud is vital infrastructure. That will and should reshape many priorities. Only a couple of months ago, tech titans were elbowing each other aside to issue pledges about reducing energy usage and promoting ‘green’ energy for their operations. Doubtlessly, such issues will remain important. But reliability and resilience — in short, availability — will now move to the top priority.
As Fatih Birol, Executive Director of the International Energy Agency (IEA) last month reminded his constituency, in a diplomatic understatement, about the future of wind and solar: “Today, we’re witnessing a society that has an even greater reliance on digital technology” which “highlights the need for policy makers to carefully assess the potential availability of flexibility resources under extreme conditions.” In the economically stressed times that will follow the COVID-19 crisis, the price society must pay to ensure “availability” will matter far more.
It is still prohibitively expensive to provide high reliability electricity with solar and wind technologies. Those that claim solar/wind are at “grid parity” aren’t looking at reality. The data show that overall costs of grid kilowatt-hours are roughly 200 to 300 percent higher in Europe where the share of power from wind/solar is far greater than in the U.S. It bears noting that big industrial electricity users, including tech companies, generally enjoy deep discounts from the grid average, which leaves consumers burdened with higher costs.
Put in somewhat simplistic terms: this means that consumers are paying more to power their homes so that big tech companies can pay less for power to keep smartphones lit with data. (We will see how tolerant citizens are of this asymmetry in the post-crisis climate.)
Many such realities are, in effect, hidden by the fact that the cloud’s energy dynamic is the inverse of that for personal transportation. For the latter, consumers literally see where 90 percent of energy is spent when filling up their car’s gas tank. When it comes to a “connected” smartphone though, 99 percent of energy dependencies are remote and hidden in the cloud’s sprawling but largely invisible infrastructure.
For the uninitiated, the voracious digital engines that power the cloud are located in the thousands of out-of-sight, nondescript warehouse-scale data centers where thousands of refrigerator-sized racks of silicon machines power our applications and where the exploding volumes of data are stored. Even many of the digital cognoscenti are surprised to learn that each such rack burns more electricity annually than 50 Teslas. On top of that, these data centers are connected to markets with even more power-burning hardware that propel bytes along roughly one billion miles of information highways comprised of glass cables and through 4 million cell towers forging an even vaster invisible virtual highway system.
Thus the global information infrastructure — counting all its constituent features from networks and data centers to the astonishingly energy-intensive fabrication processes — has grown from a non-existent system several decades ago to one that now uses roughly 2,000 terawatt-hours of electricity a year. That’s over 100 times more electricity than all the world’s five million electric cars use each year.
Put in individual terms: this means the pro rata, average electricity used by each smartphone is greater than the annual energy used by a typical home refrigerator. And all such estimates are based on the state of affairs of a few years ago.
A more digital future will inevitable use more energy
Some analysts now claim that even as digital traffic has soared in recent years, efficiency gains have now muted or even flattened growth in data-centric energy use. Such claims face recent countervailing factual trends. Since 2016, there’s been a dramatic acceleration in data center spending on hardware and buildings along with a huge jump in the power density of that hardware.
Regardless of whether digital energy demand growth may or may not have slowed in recent years, a far faster expansion of the cloud is coming. Whether cloud energy demand grows commensurately will depend in large measure in just how fast data use rises, and in particular what the cloud is used for. Any significant increases in energy demand will make far more difficult the engineering and economic challenges of meeting the cloud’s central operational metric: always available.
More square feet of data centers have been built in the past five years than during the entire prior decade. There is even a new category of “hyperscale” data centers: silicon-filled buildings each of which covers over one million square feet. Think of these in real-estate terms as the equivalent to the dawn of skyscrapers a century ago. But while there are fewer than 50 hyper-tall buildings the size of the Empire State Building in the world today, there are already some 500 hyperscale data centers across the planet. And the latter have a collective energy appetite greater than 6,000 skyscrapers.
We don’t have to guess what’s propelling growth in cloud traffic. The big drivers at the top of the list are AI, more video and especially data-intense virtual reality, as well as the expansion of micro data centers on the “edge” of networks.
Until recently, most news about AI has focused on its potential as a job-killer. The truth is that AI is the latest in a long line of productivity-driving tools that will replicate what productivity growth has always done over the course of history: create net growth in employment and more wealth for more people. We will need a lot more of both for the COVID-19 recovery. But that’s a story for another time. For now, it’s already clear that AI has a role to play in everything from personal health analysis and drug delivery to medical research and job hunting. The odds are that AI will ultimately be seen as a net “good.”
In energy terms though, AI is the most data hungry and power intensive use of silicon yet created — and the world wants to use billions of such AI chips. In general, the compute power devoted to machine learning has been doubling every several months, a kind of hyper version of Moore’s Law. Last year, Facebook, for example, pointed to AI as a key reason for its data center power use doubling annually.
In our near future we should also expect that, after weeks of lockdowns experiencing the deficiencies of video conferencing on small planar screens, consumers are ready for the age of VR-based video. VR entails as much as a 1000x increase in image density and will drive data traffic up roughly 20-fold. Despite fits and starts, the technology is ready, and the coming wave of high-speed 5G networks have the capacity to handle all those extra pixels. It requires repeating though: since all bits are electrons, this means more virtual reality leads to more power demands than are in today’s forecasts.
Add to all this the recent trend of building micro-data centers closer to customers on “the edge.” Light speed is too slow to deliver AI-driven intelligence from remote data centers to real-time applications such as VR for conferences and games, autonomous vehicles, automated manufacturing, or “smart” physical infrastructures, including smart hospitals and diagnostic systems. (The digital and energy intensity of healthcare is itself already high and rising: a square foot of a hospital already uses some five-fold more energy than a square foot in other commercial buildings.)
Edge data centers are now forecast to add 100,000 MW of power demand before a decade is out. For perspective, that’s far more than the power capacity of the entire California electric grid. Again, none of this was on any energy forecaster’s roadmap in recent years.
Will digital energy priorities shift?
Which brings us to a related question: Will cloud companies in the post-coronavirus era continue to focus spending on energy indulgences or on availability? By indulgences, I mean those corporate investments made in wind/solar generation somewhere else (including overseas) other than to directly power one’s own facility. Those remote investments are ‘credited’ to a local facility to claim it is green powered, even though it doesn’t actually power the facility.
Nothing prevents any green-seeking firm from physically disconnecting from the conventional grid and building their own local wind/solar generation – except that to do so and ensure 24/7 availability would result in a roughly 400 percent increase in that facility’s electricity costs.
As it stands today regarding the prospects for purchased indulgences, it’s useful to know that the global information infrastructure already consumes more electricity than is produced by all of the world’s solar and wind farms combined. Thus there isn’t enough wind/solar power on the planet for tech companies — much less anyone else — to buy as ‘credits’ to offset all digital energy use.
The handful of researchers who are studying digital energy trends expect that cloud fuel use could rise at least 300 percent in the coming decade, and that was before our global pandemic. Meanwhile, the International Energy Agency forecasts a ‘mere’ doubling in global renewable electricity over that timeframe. That forecast was also made in the pre-coronavirus economy. The IEA now worries that the recession will drain fiscal enthusiasm for expensive green plans.
Regardless of the issues and debates around the technologies used to make electricity, the priority for operators of the information infrastructure will increasingly, and necessarily, shift to its availability. That’s because the cloud is rapidly becoming even more inextricably linked to our economic health, as well as our mental and physical health.
All this should make us optimistic about what comes on the other side of the recovery from the pandemic and unprecedented shutdown of our economy. Credit Microsoft, in its pre-COVID 19 energy manifesto, for observing that “advances in human prosperity … are inextricably tied to the use of energy.” Our cloud-centric 21st century infrastructure will be no different. And that will turn out to be a good thing.
from iraidajzsmmwtv https://ift.tt/2Y2KDfM via IFTTT
0 notes
Text
How many Panels are needed to power a Solar Car?
Petrol and Diesel cars are yesterday’s news. The current trend in the automotive industry is to switch to electric cars as soon as possible. This is all after the bomb of Global Warming was dropped on the entire world. So, not only are the fossil fuels running out, but their use is also causing a lot of damage to the environment and atmosphere as we speak. The problem however with electric cars is that the source of electricity is usually fossil fuels. With the threat of global warming, it is imperative that electricity is generated primarily from renewable energy.
This is where solar energy comes in. However, there are a lot of limitations when it comes to harnessing the energy of the sun. At the same time, there is also a ton of benefits attached to it. So, the question is – Is it possible to power cars with solar panels? Let’s do the math and find out. I know that math is generally boring, but I will try to keep it as interesting as possible. Time to get started.
2017 Chevy Bolt
Our Assumptions
When talking about a solar powered car, we mean an electric car whose battery is charged with solar panels. This can be done in two ways – directly with on-board solar panels, or indirectly with solar powered charging stations. The great part about using electric to power the car is that the efficiency will be quite high, around 80 to 90 percent. This means that around 80 to 90 percent of the electrical energy supplied will be directly transmitted over to the motors and will help drive the car forward.
For the simplicity of calculations (and to avoid boredom), we are not going to dive into the physics of it. We are going to consider 3 models and their respective mileage according to the amount of energy they require per 100 miles. We will consider both – the direct and indirect modes of solar charging. It is important to remember that most of these calculations will be theoretical and may not hold completely true in real life.
Don’t worry, these cars aren’t solely run by solar panels. They have in-built batteries that are charged beforehand. The solar panels’ job is to recharge this battery on the go. To make our calculations even easier and give a clearer picture, let’s assume that the vehicles are fitted with a battery that will last for a bit more than 100 miles.
There might be slight variations here and there due to various factors that pose a challenge to solar charging. These factors include the efficiency of the solar panel, weather and driving conditions. Let’s get started with the first car.
2017 Chevy Bolt
This car is supposed to consume about 28 kWh per 100 miles. Now, on a typical work day, a person is likely to travel around 33 miles to and from work. Thus, you will be using one third of the battery, or roughly 9 kWh a day. This means that the car can go for about 3 days without any charge. However, it’s best to charge the car daily in case an emergency arises.
Indirect Charging
In the market, you will find that an average solar panel that gives an output of 100 W is around 5.6 square meter in area. So, let’s say you have a garage roof area of about 56 square meters. That means you can get an output of 1 kW. You could also alter the angle to fit in more panels or use your entire roof for solar panels. If you think it will look ugly, don’t worry. Tesla’s Solar Roofing has got you covered.
At the end of the day you manage to somehow get an output of 4 kW with high efficiency solar panels and using your entire roof. Then it would take approximately 9/4 or 2.25 hours to charge your car for the entire day next time. But remember we mentioned that there are many factors to consider when we talk about charging? Because of these factors, the time is practically double or it will require 4.5 hours instead of 2.25. So, leaving your Chevy Bolt for overnight charging will power the vehicle for approximately two days.
But how can we charge the vehicle using solar energy at night you ask? Well it’s simple. The solar panels will charge a battery in the house similar to Tesla’s Powerwall during the day. This, in turn, will charge the car at night.
Direct charging
But that was all about indirect charging. What about direct charging where the solar panels are mounted on the car itself? Well, a car has a lot less area available for mounting solar panels compared to a house. A typical sedan will have around 12 to 14 square meters of area. This is enough for only 200 W. Also, the bigger the car is, more energy it will consume. The Chevy Bolt, being a hatchback, has about 10 square meters of area for solar panels which is enough for 150 W. Now, if by some miracle, the car receives the entire 150 W, it would still take the car 60 hours to charge for a day’s work. This is quite impractical and thus has been ruled out on several occasions.
This is why people (and sometimes even engineers) often regard the whole concept of Solar Car Racing as an urban myth. The engineers behind these cars design them specifically for one person and increase the area available for the panels. They also use super-efficient panels and batteries to help drive the car along with extremely light materials. All of this increases the range of their car on a single charge by miles.
Other models
I am sure that you can do the rest of the calculations yourself for any given car. But, just for reference here are the two others –
A 2013 Nissan Leaf would give approximately the same numbers as the Chevy Bolt since it consumes 29 kWh per 100 miles.
A 2017 Tesla Model S however would consume 35 kWh per 100 miles. Thus, it would require 6 hours to charge the battery for a day or 12 for two.
2017 Tesla Model S
But is it cheaper?
One of the main reasons for switching to new technology is that they prove to be more economical. When it comes to electric cars, let’s first consider the possibility of conventional charging. On average, a kilowatt-hour in america costs 12 cents. Thus it would take $3.36 if you use the Chevy Bolt and $4.2 if you use the Tesla S to travel 100 miles. Considering a Toyota Camry with a mileage of 28 MPG, it would take $8.57 to travel the same distance. That is more than double the amount of the electric car.
On the other hand, the use of solar panels, will incur virtually no operating costs other than maintenance. However, the installation costs are quite high. It costs around $3000 to set up a system that generates 1kW of energy. Going by our previous assumption of a car travelling just 33 miles a day (which is a very optimistic estimate without considering any roadtrips), a person would save about $1000 in a year.
So in three years, all you would be doing is making a profit. It would be absolutely free energy. Also, bear in mind this same system will only be charging your car for about 30 to 50 percent of the time. The rest of the time it can power your home (again, at virtually no extra costs).
The Verdict
As clear as day, the electrical and the solar alternatives are more economical. They are also more environment-friendly. It will only take a few more years and after that, a solar car can be considered as an actual mode of transport for day to day life.
After all that, you must be glad that you don’t have to deal with such calculations in your daily life. As I mentioned before, there are a lot more factors at play here and each of them bring a change to the numbers. If you thought these calculations were child’s play and want to dive deeper into the physics of it all, you can check out Tom Murphy’s blog on Solar Powered Cars.
We have both taken different assumptions and that’s why our numbers may not add up. For the rest of you, see the numbers for yourselves. It is possible to make indirect Solar Cars a reality. Promoting the use of solar energy will bring about new and further developments in the technology used today, and who knows? Maybe one day, solar cars that are directly powered by solar panels may become a reality (or even a thing of the past, if we’re lucky!). I don’t know about you, but a future where everything runs on renewable energy and the atmosphere is devoid of polluting gases, seems pretty exciting to me.
To read more news like – How many Panels are needed to power a Solar Car?, visit www.solarpanel.education
https://www.solarpanel.education/many-solar-panels-needed-power-solar-car/
from WordPress https://solarpaneledu.wordpress.com/2017/05/25/how-many-panels-are-needed-to-power-a-solar-car/
0 notes